ANALYSIS OF GLOBAL GENE EXPRESSION PROFILES AND INVASION RELATED GENES OF COLORECTAL LIVER
METASTASIS DISSERTATION
Zur Erlangung des akademischen Grades doctor rerum naturalium
(Dr. rer. nat.) im Fach Biologie
eingereicht an
Mathematisch-Naturwissenschaftlichen Fakultät I der Humboldt-Universität zu Berlin
von
MSc.Biotechnology. Obul Reddy Bandapalli geboren am 01.06.1977 in Madanapalli, Indien
Präsident der Humboldt-Universität zu Berlin Prof. Dr. Christoph Markschies
Dekan der Mathematisch-Naturwissenschaftlichen Fakultät I Prof. Dr. Christian Limberg
Gutachter
PD. Dr. Karsten Brand Prof. Dr. Wolfgang Uckert PD. Dr. Glen Kristiansen
Tag der mündlichen Prüfung: 31.08.2007
SELBSTSTÄNDIGKEITSERKLÄRUNG
Hiermit versichere ich, dass ich die vorliegende Arbeit selbstständig und nur unter Verwendung der angegebenen Literatur und Hilfsmittel angefertigt habe.
Desweiteren erkläre ich meine Kenntnisnahme der dem angestrebten Verfahren zugrunde liegenden Promotionsverordnung. Ich habe mich anderwärts nicht um einen Doktorgrad beworben und bin nicht im Besitz eines entsprechenden Doktorgrades.
Berlin, den………
Obul Reddy Bandapalli
To my Father (“Appa”)
For his self-set values and the wisdom with which he raised me; always make a big difference in my life
CONTENTS
ACKNOWLEDGEMENTS VI
ABBREVIATIONS 1
ABSTRACT 3
ZUSAMMENFASSUNG 5
1 INTRODUCTION 7
1.1 Epidemiology of colon cancer 7
1.2 Etiology of colon caner 7
1.3 Prognosis of colon caner 8
1.4 Colorectal liver metastasis 9
1.5 Therapeutic approaches for colorectal liver metastasis 9
1.6 Physiopathology of Liver Metastasis 10
1.6.1 The role of the host in metastasis 11
1.6.2 Specific growth or specific homing 11
1.7 Microarray technologies for global gene expression profiles and identification of
invasion related genes 13
1.8 CXC chemokines 14
1.9 β-catenin 15
1.10 Aim of the thesis 17
2 MATERIALS 19
2.1 Instruments 19
2.2 Chemicals and reagents 19
2.3 Special Material 19
2.4 Plasmids 19
2.5 Kits 20
2.6 Cell Lines 21
2.7 Reagents 21
2.8 Antibodies 26
3 METHODS 27
3.1 Cell Culture and Animal Experiments 27
3.2 Tissue preparation and laser microdissection (LMD) 28
3.3 RNA extraction, quality control and quantification 29
3.3.1 Extraction of total RNA from cell lines 29
3.3.2 Extraction of total RNA from snap-frozen and microdissected tissues 29
3.3.3 Evaluation of RNA quantity and quality 30
3.4 RNA Amplification (In Vitro transcription) 32
3.4.1 Amplification of RNA for host-tumor interactions studies 32 3.4.2 Reverse transcription (RT) of RNA and second strand synthesis 32
3.4.3 T7-based RNA amplification 33
3.4.4 Subsequent rounds of aRNA amplification 33
3.4.5 Amplification of RNA for interspecies comparison studies 34
3.5 Microarray hybridization and data analysis 34
3.5.1 Generation of Oligonucleotide array probes 34
3.5.2 Hybridization 34
3.5.3 Percent Present 35
3.5.4 Scaling/normalisation 36
3.5.5 Data analysis 36
3.5.6 Pair-wise comparison 36
3.6 RT-PCR and Gel Electrophoresis 37
3.6.1 First-Strand cDNA Synthesis 37
3.6.2 Polymerase Chain Reaction (PCR) 37
3.6.3 Gel Electrophoresis 38
3.7 Quantification of mRNA expression levels using Light Cycler 38
3.7.1 General principle of quantitative PCR 38
3.8 Immunohistochemistry 40
3.9 shRNA 41
3.10 shRNAmir design 42
3.11 Extraction of Plasmid DNA 43
3.11.1 Mini-Preparation 43
3.11.2 Maxi-Preparation 44
3.12 Puromycin Dose-Response 45
3.13 Transfection 45
3.13.1 Transfection of Cells with Plasmid DNA containing shRNA constructs 45
3.13.2 Co-transfection of pSEAP plasmid with pBabe Puro 45
3.14 Protein preparation and quantification 46
3.15 Sodium dodecylsulphate polyacrylamide gel electrophoresis (SDS-PAGE) and Western
blotting (WB) 46
3.16 Reporter gene activity (SEAP) measurement 47
4 RESULTS 49
4.1 Interspecies comparison of gene and gene expression profiles in a mouse model of colorectal liver metastasis and in clinical specimens 49 4.1.1 Intraspecies cross-compartmental correlation of histology and gene expression 49 4.1.2 Interspecies overlap of compartment-specific up-regulated genes, gene expression
patterns and histological similarity 52
4.1.3 Gene expression patterns and pattern families 54
4.1.4 Single-gene overlap within overlapping patterns 58
4.2 Global gene expression profiles of host tissue at the invasive front of colorectal liver
metastases 61
4.2.1 Gene expression profiles of host tissue in response to tumor invasion: Over-represented
GO terms at the invasive front 62
4.2.2 Gene expression profiles of host tissue in response to tumor invasion: Under-represented
GO terms at the invasive front 69
4.2.3 Confirmation of stellate cell activation at the invasive front 72 4.3 Gene expression profiles of tumor cells in vitro, in vivo and at the invasion front of
colorectal liver metastasis 76
4.3.1 Elimination of cross reacting genes leads to a tolerable loss of genes 77 4.3.2 Degree of tumor cell Specialization increases with increased contact to host cells 79
4.3.3 Regulation of Pro-angiogeneic CXC chemokines 82
4.3.4 Targeted down-regulation of CXCL1 and CXCL8 expression using shRNA 83 4.3.5 Activation of the β-catenin promoter in the invasion front of colorectal liver metastases 86
5 DISCUSSION 91
5.1 Interspecies comparison of gene and gene expression profiles in a mouse model of colorectal liver metastasis and in clinical specimens 91
5.1.1 Inherent species differences 91
5.1.2 Tumor model 92
5.1.3 Misleading histology 93
5.1.4 Functional redundancy 94
5.2 Gene expression profiles of host tissue at the invasive front of colorectal liver
metastases 95
5.3 Gene expression profiles of tumor cells in vitro, in vivo and at the invasion front of
colorectal liver metastases 99
5.3.1 CXC Chemokines 100
5.3.2 Activation of the β-catenin promoter in the invasion front of colorectal liver metastases 102
REFERENCES 106
LEBENSLAUF 116
LIST OF FIGURES
Figure 1: Lab-on-a-chip (Source: Agilent Technologies) 30 Figure 2: MicroRNA processing pathway utilized for shRNAmir
(Source: Open Biosystems) 42
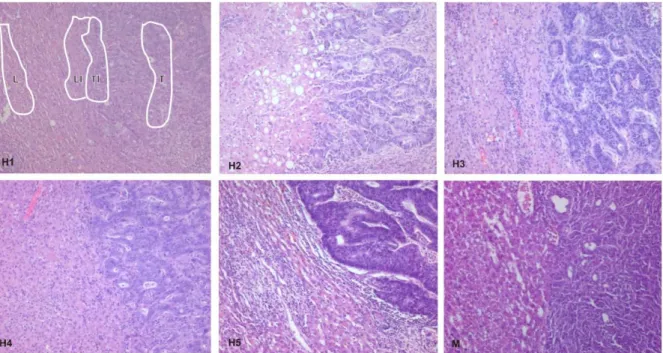
Figure 3: Unique microRNA adapted design (Source: Open Biosystems) 43 Figure 4: Histology of invasion fronts of liver metastases from the clinical
specimen and from the murine model. 51
Figure 5: Compartmental distribution of compartment specifically over-
represented GO-terms. 57
Figure 6: Areas subjected to microdissection 62 Figure 7: Immunohistochemistry for detection of activated HSC 75 Figure 8: Immunohistochemistry for detection of hepatocytes and HSC 76 Figure 9: Areas subjected to microdissection 77 Figure 10: Number of GO-terms over represented in pair wise comparisons 79 Figure 12: Inhibition of CXCL1 and CXL8 expression in LS174T cells. 84 Figure 13: Calibration of quantitative RT-PCR. 86 Figure 14: Elevated levels of β-catenin in vivo. 87 Figure 15: β-catenin promoter activity in vitro and in vivo. 89
LIST OF TABLES
Table 1: Percentage of genes present and total number of differentially
regulated genes 50
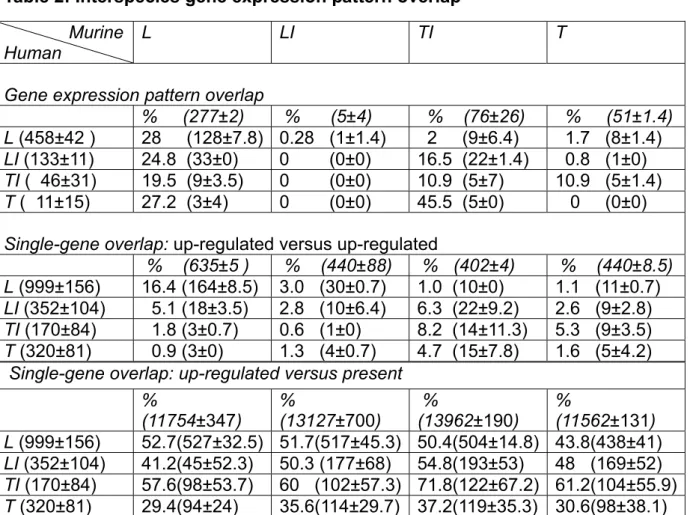
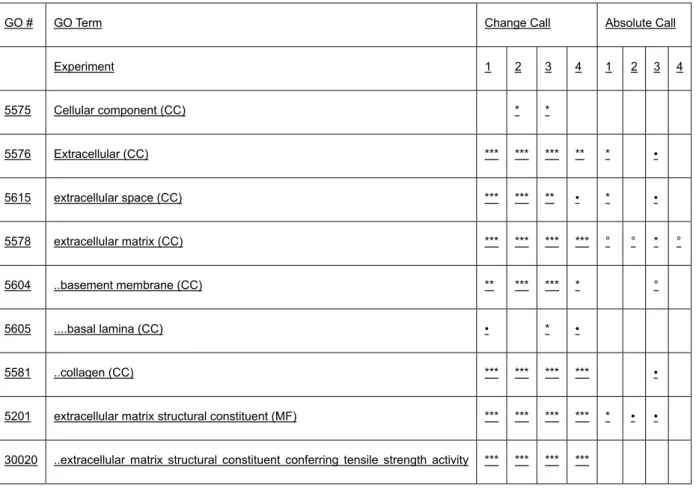
Table 2: Interspecies gene expression pattern overlap 53 Table 3: Interspecies overlap of single genes underlying specific GO-terms 59 Table 4: Gene expression of selected genes typical for specific compartments 60 Table 5: GO-terms consistently up regulated in the liver part of the invasion
front 64
Table 6: GO-terms consistently down regulated in the liver part of the invasion
front 70
Table 7: Determination of differentially regulated gene levels in liver and liver
part of the invasion front 73
Table 8: Murine tissue (liver) cross reacting with human chips 78 Table 9: Elimination of cross reactive gene (presernt or marginal in liver) 78 Table 10: Presence of angiogenic growth factors in tumor cells and
their respective receptors in host cells 82 Table 11: Pro-angiogenic CXC chemokines in tumor cells 83 Table 12: Conformation of differentially regulated gene levels in tumor and
tumor part of the invasion front 84
Acknowledgements_____________________________________________________
Acknowledgements
I am indebted to my supervisor PD. Dr.Karsten Brand, not only for introducing me to the exciting field of genomics but also for his motivating words, constructive criticism day after day, help, financial support and friendship.
I would like to thank Prof. Peter Schirmacher for all his support and encouragement during my work at the Institute of Pathology.
I am very grateful to Prof. Wolfgang Uckert and PD.Dr.Wolfgang Kemmner for hosting me at MDC.
I would like to thank Olaf, Kerstin, Sefer and all the CUSTOSians for a good start to my research in Germany with their friendly gesture at Custos Biotechnolgie GmbH.
Many thanks to Victoria, Nawid, Heiko, Christoph and all the colleagues whose friendship and support have made it more than a working place at Pathology institute in Heidelberg.
I am thankful to Dr. Ralf Weiskirchen, Dr. Dieter Beule, Dr.Susanne Dihlmann, Prof.Jürgen Weitz and Dr.Hanspeter Herzel for embarking with me on this thesis journey. Their contributions, in immunohistochemistry, bioinformatics and human liver metastasis samples have been of great value to the success of my thesis.
I also owe a lot to Mrs. Bonn at MDC and Mrs. Annette Weninger at DKFZ for their help in scanning the microarray chips.
I have to say 'thank-you' to: all my dear friends and well-wishers for all the emotional support, entertainment and caring they provided me over the past years. You are so many that to thank you all personally would take another thesis, but you know who you are and I am ever grateful to you all. Thanks to Shilpa for proofreading the thesis and for everything. Schoeppler´s family is a true substitute for my home in Germany;
I am blessed to have met you.
Thanks to the European Union for financial support under frame work 6 “Cancer Degradome”.
Finally, I thank my family for everything. It is their love and support for what I am today.
Abbreviations
Abbreviations
0C Degree Centigrade
A Adenosine
Apaf-1 Apoptosis protease activating factor 1
Apof Apolipoprotein
APS Ammoniumpersulphate
ATP Adenosine Triphosphate
bp Base pair
CO2 Carbon dioxide
cDNA Complementary DNA
CXCL1 Canonical Cysteine-any amino acid Cysteine Ligand 1 CXCL2 Canonical Cysteine-any amino acid Cysteine Ligand 2 CXCL3 Canonical Cysteine-any amino acid Cysteine Ligand 3 CXCL5 Canonical Cysteine-any amino acid Cysteine Ligand 5
DMSO Dimethyl Sulphoxide
DNA Deoxyribonucleic Acid
dNTP Deoxyribonucleosidetriphosphate
DTT 1, 4-Dithiothreitol
ECL Enhanced Chemiluminescence
EDTA Ethylenediaminetetraacetate et al et alii (and others)
EtBr Ethidium Bromide
FCS Fetal Calf Serum
g Gram
GO Gene Ontology
GCOS Gene Chip Operating Software
h Hour
IHC Immunohistochemistry
IL-8 Interleukin-8
IgG Immunoglobulin G
IVT In vitro Transcription
Kb Kilobase
kDa Kilo Dalton
l Liter
LB Luria Bertoni Broth Medium
LSB Lamaelli Sample Buffer
M Molar
mM MilliMolar
mA Milliampere
mg Milligram
min Minute
ml Milliliter
µg Microgram
µl Microliter
µM Micromolar
mM Millimolar
mRNA Messenger RNA
ng Nanogram
N2 Nitrogen
Abbreviations
PAGE Poly Acrylamide Gel Electrophoresis PBS Phosphate Buffered Saline
PBS-T Phosphate Buffered Saline with 0.1% Tween 20
PCR Polymerase Chain Reaction
qPCR Quantitative Polymerase Chain Reaction
RNA Ribonucleic acid
RNAsin RNAase inhibitor
RPM Rotations per Minute
RT Room Temperature
RT-PCR Reverse Transcriptase- Polymerase Chain Reaction SDS Sodium Dodecyl (lauryl) Sulphate
Sec Second
TAE Tris-Acetate-EDTA
Taq Thermophilus aquaticus
TBS Tris Buffered Saline
TBS-T Tris Buffered Saline with 0.1% Tween 20
TE Tris EDTA
TEMED N,N,N,N -Tetramethyl-Ethylenediamine Tris Tris Hydroxymethylaminoethane
U Unit
UV Ultraviolet
V Volt
Abstract
3
Abstract
The liver is the organ, which is most frequently populated by metastases and may therefore serve as a model organ for metastatic invasion. For this reason, it was the aim of this thesis to understand the gene expression profiles and identify metastasis and invasion related genes.
Differential gene expression was examined in three systems: A syngeneic mouse model (CT26/Balb/C mouse), a xenograft model (LS174/nude mouse) and five clinical specimens.
Gene expression profiles of a syngenic mouse model (CT26) and human clinical specimen revealed that the invasion front should be considered as a whole instead of separating it into histologically defined liver invasion and tumor invasion to find more overlapping potential target genes. This indicates that gene expression patterning may aid in the assessment of the suitability of an animal model for target gene determination.
Global gene expression studies focussed on the host part of the invasion front, using gene ontology terms and GOSSIP software revealed a pronounced overrepresentation of GO-terms (e.g. “extracellular matrix”, “cell communication”,
“response to biotic stimulus”, “structural molecule activity” and “cell growth”). On the single gene level hepatic stellate cell (HSC) activation markers were over- represented in this region demonstrating the feasibility of a differential gene expression approach on a genome wide scale.
Global gene expression studies focusing on the tumor cells in vitro, in vivo and tumor part of the invasion front revealed an overall increase of cellular specialization from in vitro to the in vivo situation and a further increase of specialization from tumor to invasion front. Secreted angiogenic cytokines (Invasion specific pattern) were found to be up regulated in the invasion front compared to the inner parts of the tumor. ß - catenin gene of “cell adhesion” GO term was elevated 9.6 fold in invasion front compared to in vitro. Evaluation of transcriptional up-regulation of ß-catenin by promoter activity showed an 18.4 fold increase in the tumor cells of the invasion front as compared to the tumor cells in the inner parts of the tumor. In addition, promoter activity as assessed by soluble human placental alkaline phosphatase reporter gene mRNA was 3.5 fold higher in the inner parts of the tumor than in cells growing in cell
Abstract
culture indicating a transcriptional mechanism of β-catenin regulation in addition to the well described posttranslational regulatory mechanisms.
In summary, application of high throughput Oligonucleotide microarray analysis in combination with real time PCR technology allowed the identification of genes, which might play a role in proliferation, invasion and angiogenesis of tumors in colorectal liver metastasis.
Key words
Tumor-stromal cell interactions, invasion and metastasis, gene expression profiling, xenograft models, liver, β-catenin, cross-species.
Zusammenfassung
5
Zusammenfassung
Die Leber ist das am häufigsten von Metastasen betroffene Organ und kann daher als Modellorgan für metastatische Invasion dienen. Aus diesem Grund war es das Ziel dieser Dissertation Genexpressionsprofile zu verstehen und metastasierungs- sowie invasionsassoziierte Gene zu identifizieren.
Differentielle Genexpression wurde in drei Systemen überprüft: Einem syngenen Mausmodell (CT26/Balb/C Maus, einem Xenograftmodell (LS 174/Nacktmaus) sowie in fünf Gewebeproben von Patienten.
Genexpressionprofile des syngenen Mausmodells (CT26) und der Patientenproben zeigten, dass man die Invasionsfront als Ganzes betrachten sollte und sie nicht in einen histologisch naheliegenden Leberteil und Tumorteil separieren sollte, um möglichst viele überlappende Gene zu finden. Diese Daten zeigen, dass die Ermittlung von Genexpressionsmustern bei der Prüfung der Eignung eines Tiermodells für die Ermittlung von Targetgenen helfen kann.
Globale Genexpressionstudien, die auf den Wirtsteil der Invasionsfront fokussiert sind zeigten bei Nutzung von „gene ontology terms“ und der „Gossip“ Software eine bemerkenswerte Überrepräsentation z. B. der „GO-terms“ „extrazelluläre Matrix“, Zellkommunikation“, „Antwort auf biotischen Stimulus“, Strukturmolekülaktivität“ und
„Zellwachstum“. Auf der Einzelgenebene waren in dieser Region Marker der Aktivierung hepatischer Sternzellen (HSCs) überrepräsentiert, was die Durchführbarkeit einer Analyse differentieller Genexpression im genomweiten Rahmen anzeigt.
Globale Genexpressionsstudien, mit Fokus auf den Tumorzellen in der in vitro Situation, in vivo und in der Invasionsfront zeigten insgesamt einen Anstieg zellulärer Spezialisierung von der in vitro- zur in vivo Situation und einen weiteren Anstieg vom Tumorinneren zur Invasionsfront. Sezernierte proangiogenetische Chemokine (invasionsspezifisches Muster) zeigten eine Hochregulation in der Invasionsfront im Vergleich zum Tumorinneren. Das β-catenin -Gen (GO-term „cell adhesion“) war in der Invasionsfront 9.6 fach erhöht im Vergleich zur in vitro Situation. Die Überprüfung der transkriptionellen Aktivierung von β-catenin über die Prüfung der Promotoraktivität zeigte einen 18.4 fachen Anstieg in den Tumorzellen der Invasionsfront verglichen mit den Tumorzellen im Tumorinneren. Weiterhin war die
Zusammenfassung
Promotoraktivität (an Hand der Aktivität der mRNA des Alkalischen Phosphatase Reportergens) im Tumorinneren 3.5 fach höher als in der Zellkultur, was für einen transkriptionellen Mechanismus der β-catenin Regulation zusätzlich zu den bereits gut beschriebenen posttranslationalen Mechanismen spricht.
Zusammenfassend kann man festhalten, dass die Hochdurchsatz-Oligonukleotid Mikroarray-Analyse in Kombination mit der real time PCR Technologie die Identifikation von Genen ermöglicht hat, die eine Rolle in Proliferation, Invasion und Angiogenese in kolorektalen Lebermetastasen spielen könnten.
Schlagworte
Tumor-stroma Zelle interaktionen, Invasion und Metastasierung, Gene Expression Profiling, genograft modelle, leber, β-catenin, Inter-spezies
Introduction
7
1 Introduction
1.1 Epidemiology of colon cancer
Colorectal cancer, also called colon cancer or bowel cancer, includes cancerous growths in the colon, rectum and appendix. It is the third most common form of cancer and the second leading cause of death among cancers in the Western world.
Many colorectal cancers are thought to arise from adenomatous polyps in the colon.
These mushroom-like growths are usually benign, but some may develop into cancer over time. The majority of the time, the diagnosis of localized colon cancer is through colonoscopy. The most common colon cancer cell type is adenocarcinoma which accounts for 95% of cases. Other, rarer types include lymphoma and squamous cell carcinoma.Colon cancer incidence is not much different between males and females, however colon cancer is slightly more prevalent in women compared to men (ratio of 1.2:1) but the rectal cancer is more common in males (ratio of 1.7:1). Colon cancer is more common among elderly persons compared to younger persons. The risk of developing colon cancer begins to increase from the age of 40 and goes up with every passing year. The median age of presentation of colon cancer varies according to the country. In the United States the median age at presentation is 72 years. Colon cancer is more common in African Americans compared to the Caucasian population in the United States. The incidence of colon cancer has been on the increase in African Americans since 1973 and the incidence in this ethnic group has gone up by about 30 percent during the last 3 decades. Incidence of colorectal cancer varies widely from country to country. Countries which are more industrialized like United States, Canada, UK, Western Europe, Australia have a much higher incidence of colorectal cancer compared to less industrialized parts of the world like Asia, Africa, and South America. The American Cancer Society estimates that about 145,000 cases of colorectal cancer will be diagnosed and about 56,000 people will die from the disease in 2005. The death rate from colon cancer has declined over the past 15 years due to improved screening methods and advances in treatment.
1.2 Etiology of colon caner
Age is the primary risk factor. Incidence of the disease increases significantly after the age of 50. Some people have a genetic predisposition to carcinogenic (i.e., cancer causing) effects of the diet on the digestive tract, which increases the risk for
Introduction
colorectal cancer. When this predisposition is combined with a high dietary intake of fat and red meat and a low dietary intake of fiber (e.g., bran), vitamins (e.g., folate), and minerals (e.g., calcium), the risk is even higher. Ashkenazi Jews have a higher incidence of a specific genetic mutation (called I1307K) that increases the risk for colorectal cancer. Daily alcohol use (may double the risk), eating a high-fat, low-fiber diet, obesity, sedentary lifestyle, Smoking. A family history of intestinal polyps or colorectal cancer (especially before the age of 60) results in an increased risk for the disease. Other diseases and medical conditions that increase the risk include diabetes, genetic disorders such as familial polyposis syndromes and hereditary non- polyposis colon cancer syndrome (HNPCC), inflammatory bowel disease (e.g., ulcerative colitis, Crohn's colitis, granulomatous colitis). (Familial polyposis syndromes are rare genetic (i.e., inherited) conditions characterized by early onset of multiple intestinal polyps (called polyposis) and a very high (virtually 100%) risk for colorectal cancer. Familial adenomatous polyposis (characterized by as many as thousands of polyps throughout the entire colon), Hereditary nonpolyposis colon cancer (HNPCC) syndrome is a genetic condition characterized by early-onset colorectal cancer (i.e., develops before age 50) and multiple colorectal cancers).
1.3 Prognosis of colon caner
Colorectal cancer can be asymptomatic (i.e., it may not cause symptoms). Blood in the stool is a common sign of the disease. Blood may be bright red or dark in color, and may not be noticeable. Chronic bleeding may result in iron deficiency anaemia, which may cause fatigue and pale skin. Other symptoms include: Abdominal discomfort (e.g., pain, bloating, cramping, fullness), change in bowel habits, Constipation or diarrhoea, narrow stools, nausea and vomiting, unexplained weight loss and hepatomegaly (enlargement of the liver) due to spreading of the tumor. The survival rate for people with colorectal cancer depends on the extent of the cancer at the time of diagnosis and the individual’s response to treatment. In addition, many new discoveries have the potential for improving the treatment of colorectal cancer, as well as the prognosis. Prognosis depends on the stage of the disease and the overall health of the patient. Overall, colorectal cancer patients have a 5-year survival rate of about 61%. The 5-year survival rate is about 92% when the disease is treated before it has spread (metastasized); 64% when the cancer has spread to nearby
Introduction
9
organs or lymph nodes; and 7% when it has spread to other parts of the body (e.g., liver, lungs).
1.4 Colorectal liver metastasis
The liver is the most common site of distant metastasis from colorectal cancer for two main reasons.
A. The liver filters the venous drainage from the intra-abdominal viscera, including the distal oesophagus, stomach, spleen, small bowel, colon, rectum, adrenals, pancreas, gallbladder, and biliary tree. Furthermore, the liver receives 30% of the cardiac output. Thus, the volume of blood filtered by the liver is second only to that filtered by the lungs.
B. Physiologically, the liver is occupied by numerous cell types capable of providing a rich milieu for tumor cell growth. Tumor cells that survive the systemic circulation may eventually reach the liver. If the tumor cells express the appropriate phenotype allowing progression through all stages of the metastatic cascade, then the result is a metastasis. The liver microenvironment consists of not only organ- specific cells, such as hepatocytes, but also endothelial cells, pericytes, inflammatory cells, Kupffer cells, fibroblasts, and the extracellular matrix, all of which provide a favourable milieu for tumor cell implantation and initiation of angiogenesis. (Radinsky et al., 1996)
1.5 Therapeutic approaches for colorectal liver metastasis
Clinical experience suggests that patients with colorectal liver metastases have heterogenous tumor biology. The ongoing trend is to include a surgical approach for more patients with liver metastases from colorectal carcinoma. With the addition of newer chemotherapeutics, survival has improved in patients treated both medically and surgically for metastatic colorectal cancer. The role of neoadjuvant chemotherapy is being clarified. The current approach is upfront surgery unless a lesion is considered unresectable. Neoadjuvant therapy may soon be recommended more frequently, however, as more predictable responses from the intervention occur.
During the preoperative evaluation, attention needs to be focused on considering sufficient liver parenchyma and assessment for extra hepatic disease. Survival
Introduction
benefits in patients undergoing a second liver resection have similar outcomes as those undergoing a primary resection. Regardless of the surgical resection, patients benefit most when tumor-free margins greater than 1 cm are achieved. If the margins are close, RFA or cryotherapy can be added to ensure an adequate depth. Resection remains a critical treatment modality for patients with colorectal liver metastases since it provides the only significant chance for cure or long-term survival. With the extraordinary advances made in chemotherapeutics as well as newer surgical techniques, metastatic colon cancer remains a potentially curable disease. Patients are best treated in a multimodality environment where a medical oncologist, a radiologist, and those skilled in hepatobiliary surgery plan and execute optimal therapy.
1.6 Physiopathology of Liver Metastasis
Spreading of cancer cells from their site of origin to distant organs, named metastasis is a major cause of therapy failure (Mareel et al., 1993). In colorectal cancer half of the cancer deaths are due to loco-regional extension and the other half due to distant metastasis. In order to metastasise, cancer cells must acquire the capability to invade into the vascular system, to survive and to proliferate at the place of metastasis.
Invasion marks the onset of malignancy; cells are released from their normal epithelial context, lose polarity, perforate the basement membrane and finally migrate into the stroma. There, they meet with the vessels that provide a route for transport to distant sites such as the liver. Then, metastases emerge through proliferation of cancer cells that have left the vessel and lodged in the liver parenchyma or have formed an embolus in the vessel lumen and grown from that site. All these activities are intimately linked with alterations of a variety of host cells that are in continuous cross talk with the cancer cells (Mareel et al., 1993). The liver is a frequent site of metastasis from many types of primary tumours (Debois et al., 2002). Such high frequency and liver specificity cannot be explained solely by the blood flow in the efferent vessels, portal vein and hepatic arteries respectively.
Organ specificity of metastasis, as exemplified by the liver, is best explained by the
“seed” and “soil” hypothesis by Paget in 1889 (Paget 1889). He raised the question
“What is it that decides what organ shall suffer in a case of disseminated cancer?”.
His answer was “The microenvironment of each organ (the soil) influences the survival and growth of tumour cells (the seed)”. This hypothesis is still valid and
Introduction
11
serves as a rich source of inspiration for clinical and experimental analysis of metastasis. What modern research has added to Paget’s seed and soil hypothesis mainly concerns the cellular and molecular mechanisms that underpin the cross talk between the cancer cells and their host.
A current definition of the "seed and soil" hypothesis consists of three principles.
First, neoplasms are biologically heterogeneous and contain subpopulations of cells with different angiogenic, invasive, and metastatic properties. Second, although some of the steps in this process contain stochastic elements, metastasis as a whole favors the survival and growth of a few subpopulations of cells that pre-exist within the parent neoplasm. Thus, metastases can have a clonal origin, and different metastases can originate from the proliferation of different single cells. Third, the outcome of metastasis depends on multiple interactions ("cross talk") of metastatic cells with homeostatic mechanisms.
The cancer cells are the seed
Before cancer cells produce metastases, they undergo a series of genetic alterations, conveying upon them uncontrolled growth, loss of differentiation, acquisition of invasion and ectopic survival (Mareel et al., 2002).
The liver is the soil
1.6.1 The role of the host in metastasis
Numerous clinical and experimental observations support the role of host factors in the development and the malignancy of tumours. Pathologists have since a long time recognized that tumours contain not only cancer cells but also host cells. This host participation is described as desmoplasia, consisting of fibroblastic cells and extracellular matrix, as inflammation and immune response, represented by lymphocytes, macrophages and dendritic cells, and as angiogenesis evidenced by newly formed blood and lymph vessels (Mareel et al., 2003).
1.6.2 Specific growth or specific homing
The question whether cancer cells can home everywhere and grow only at distinct sites or whether they home only at specific sites but can grow everywhere is too simple. Metastasis is a multifactorial event including molecular crosstalking between cancer cells and host cells as well as the blood flow, carrying colorectal cancer cells
Introduction
to the capillary bed of the liver via the portal vein. Growth is currently best explained in terms of neoangiogenesis (Carmeleit et al., 2000). When the balance between positive and negative angiogenic factors switches to the positive side, endothelial cells are stimulated to leave the constraints of the vessel wall; much like invasive cancer cells leave the epithelium. These endothelial cells migrate towards the cancer cell nest, proliferate and finally differentiate to make new vessels. Such vessels constitute not only a source of nutrients, growth factors and invasion factors but also provide access for host cells from distant sites, initiate further spread of the cancer cells and establish a link between the primary tumour and its metastases (O´Reilly et al., 1994). Homing of cells implicates a stepwise interaction between the circulating cancer cells and the endothelium that is regulated by the cross talk of cell adhesion molecules and chemokines with their respective receptors. Two molecular explanations have been forwarded for specific homing: expression of specific receptors on the surface of endothelial cells or release of specific chemokines, molecules exerting an attractive force on circulating cancer cells that bear specific receptors. Such chemo-attractants have been demonstrated for breast cancer (Müller et al., 2001).
Metastasis is a hallmark of malignancy in cancers of the gastrointestinal tract. In colorectal cancers as well as in cancers of many other organs, the liver is a predilection site for metastasis. This predilection is explained by the seed and soil theory, launched by Paget in 1889 (Paget 1889). The seed, cancer cells, need a series of genomic alterations in oncogenes and tumour-suppressor genes to invade, survive and grow in distant organs. The soil, the liver, produces attractants and growth factors that undertake molecular cross talk with the metastatic cancer cells.
Understanding of the mechanisms of metastasis may assist in the treatment.
Besides unrestricted proliferation and reduced apoptosis, unbalanced invasion is the third major prerequisite of malignant behaviour of the tumor cell. Invasion of tumor cells depends on a permissive host environment at the invasive site of the primary tumor as well as at the site of metastasis. The host participates in the induction, selection and expansion of neoplastic cells to an extent that researchers are even raising the question of “who is invading whom?”(Liotta et al., 2001). Likewise, the tumor cells of the invasion front display features, which differ from those in the inner parts of the tumor. The increased knowledge about this host environment and
Introduction
13
possible therapeutic advantages of targeting this compartment like reduced capability to acquire resistance and easy access have led to the development of several therapeutics (Liotta et al., 2001). Prominent examples of this group of drugs are synthetic metalloprotease inhibitors, which have received much attention although only recently one trial proved clinical therapeutic efficacy (Bramhall et al., 2002&
Evans et al., 2001). The difficulty in the design of stromal therapeutics may in part be due to the huge number of potential target molecules and the complicated not yet resolved interactive pathways. As an adjunct to focussed mechanistic studies which are usually performed in vitro, understanding of the biological processes could be increased by global in vivo gene expression studies. Several interesting studies towards this direction have been reported (Ryu et al., 2001,Roesch et al., 2003, Paweletz et al., 2001, Mariani et al., 2001& Brazma et al., 2001) but studies with a clear focus on the gene expression patterns of the host tissue excluding the tumorous epithelial compartment have not yet been published.
1.7 Microarray technologies for global gene expression profiles and identification of invasion related genes
Patterns in the invasion front as compared to the inner parts of the tumor have been published (Mariani et al., 2001, Roesch et al., 2003 & Iacobuzio-Donahue et al., 2002). However, none has specifically focussed on angiogenesis or on liver metastases nor has there been a distinction between tumor genes and host genes.
This distinction is of particular interest if tumor cell/host cell interaction which is the initiating and probably crucial interaction during angiogenesis is studied in vivo.
In particular, the microenvironment has a significant effect on tumor development and progression (Bissell et al., 2001). Tumor cell lines have been considered an important resource for cancer investigations because of their limited cellular complexity compared with human tumors and the ease with which they can be grown and manipulated under controlled conditions. However, as the in vitro microenvironment is substantially less complex than the environment in which cancer cells proliferate in vivo, the conclusions reached from cancer cell line investigations, although informative, may not be directly applicable to the natural setting in which human tumors arise, progress, and are treated. Given that the consequences of particular genetic alterations in cancer may be highly context dependent and governed by the
Introduction
spatial and temporal involvement of multiple interacting components, identification of gene expression differences between in vitro proliferation and in vivo tumor growth potentially may uncover genes that play an important role in tumor formation.
Global RNA expression profiling of xenograft tumors from human-derived cells grown in immune-compromised mice makes it possible to determine the extent to which cancer cells modify their expression profile in response to the local microenvironment. Gene expression profiling using oligonucleotide arrays represents an excellent means to study such tumor-host relationships in this setting because the potential background due to cross-species hybridization is minimal (bandapalli et al., 2006).
In this thesis, transcriptional changes in human LS174T colon adenocarcinoma cells grown orthotopically in the liver of nude mice were investigated to better mimic the environment of human liver metastasis. Potential host tissue response to the implantation of cancer cells were also examined using a mouse oligonucleotide array to measure the expression of mouse genes in liver tissue adjacent to tumor. To gain further insight into the contributions of various factors in the microenvironment of liver metastasis, transcriptional profiles of cells grown in vitro with profiles of orthotopically implanted tumors were compared. Furthermore the role of CXC chemokines and ß- catenin genes was studied that were found to be up regulated in the invasion front.
1.8 CXC chemokines
The CXC chemokines are a unique family of cytokines for their ability to behave in a disparate manner in the regulation of angiogenesis. CXC chemokines have four highly conserved cysteine amino acid residues, with the first two cysteine amino acid residues separated by one nonconserved amino acid residue (i.e., CXC). A structural domain within CXC chemokine family dictates their functional activity. The NH2
terminus of the majority of the CXC chemokines contains three amino acid residues (Glu-Leu-Arg: the ELR motif), which precedes the first cysteine amino acid residue of the primary structure of these cytokines (Strieter et al., 1995). Members that contain the ELR motif (ELR+) are potent promoters of angiogenesis (Luster et al., 2000&
Belperio et al., 1998). In contrast, members that are inducible by interferons and lack the ELR motif (ELR-) are potent inhibitors of angiogenesis (Strieter et al., 2004). The
Introduction
15
angiogenic members of the CXC chemokine family include CXCL1,CXCL2, CXCL3, CXCL5 and CXCL8. The best described member is probably CXCL8 (IL-8). The ability of CXCL8 to promote endothelial cell survival and proliferation has been substantiated by a number of studies (Nor et al., 2001 & Li et al., 2003). Induction of the expression of CXCL8 in cancer cells by diverse signals and subsequent tumor- associated angiogenesis has been shown (Strieter et al., 2004& Dong et al., 2001).
The other pro-angiogenic members of the CXC chemokine family have been less extensively described (Strieter et al., 2004).
The fact that all ELR+ CXC chemokines mediate angiogenesis highlights the importance of identifying a common receptor that mediatestheir biological function in promoting angiogenesis. The candidate CXC chemokine receptors are CXCR1 and/or CXCR2. Only CXCL8 and CXCL6 specifically bind to CXCR1, whereas all ELR+ CXC chemokinesbind to CXCR2 (Addison et al., 2002). The ability of all ELR+
CXC chemokine ligands to bind to CXCR2 supports the notion that this receptor mediates the angiogenic activity of ELR+ CXC chemokines. While CXCR1 and CXCR2 are detected in endothelial cells (Addison et al., 2000, Murdoch et al., 1999 &
Salcedo et al., 2000),the expression of CXCR2, but not CXCR1, has been found to be theprimary functional chemokine receptor in mediating endothelialcell chemotaxis (Addison et al., 2000 & Murdoch et al., 1999et al.,) Another receptor which binds at least to CXCL1, CXCL5 and CXCL8 (Addison et al., 2004) and is expressed on endothelial cells is the Duffy antigen receptor for chemokines (DARC).
The angiostatic members of the CXC chemokine family include CXCL4, 9, 10 and 11 (Strieter et al., 2004). They are interferon-inducible. The putative receptor for angiostatic chemokines is CXCR3 (Strieter et al., 2004). Angiostatic effects of chemokines seem to be mainly attributable to immunologic effects involving T lymphocytes, and the paradigm of immunangiostasis has been postulated (Strieter et al., 2004).
1.9 β-catenin
β-catenin is involved in cell-cell adhesion as well as in signal transduction and transcriptional activation of a huge number of target genes
.
Introduction
For its action as transcriptional activator it has been shown to localize to the nucleus and associate to members of the TCF/LEF family of transcription factors (Brembeck et al., 2006 & Huelsken et al., 2002). During cancer development this nuclear accumulation as well as overall increased protein levels seem to be caused by either stabilizing mutations of the gene itself or by mutations affecting components of the ß- catenin degradation complex including the APC, AXIN1 or AXIN2 tumor suppressor genes (Brembeck et al., 2006 & Huelsken et al., 2002). In colorectal cancer, the second most common cancer in both sexes (Grem et al., 2001), nuclear localization has been mainly observed at the invasion front of primary tumors as well in liver metastases (Brabletz et al., 2001). One current concept interprets this finding as mechanism within the epithelial mesenchymal transition which takes place preferably at the invasive margin and leads to the acquisition of a less differentiated and more mesenchymal appearance (Brabletz et al., 2005). Posttranslational regulation is generally believed to be the main regulatory mechanism for β-catenin activity.
However, increased mRNA levels have occasionally been reported in some types of cancers including colorectal (El-Bahrawy et al., 2001& Mann et al., 1999), gastric (Ebert et al., 2002), hepatocellular (Cui et al., 2001) and desmoid (Saito et al., 2002) cancer indicating at least some influence of transcriptional or posttranscriptional regulation.
Aim of the thesis
17
1.10 Aim of the thesis
Global RNA expression profiling of xenograft tumors from human-derived cells grown in immune-compromised mice makes it possible to determine the extent to which cancer cells modify their expression profile in response to the local microenvironment. Gene expression profiling using oligonucleotide arrays represent an excellent means to study such tumor-host relationships in this setting because the potential background due to cross-species hybridization is minimal.
The thesis is majorly focused on two themes. Chapter 1 deals with the degree of interspecies overlap of genes between the syngenic model CT26 and human clinical specimen.
Chapter 2, 3 deal with the analysis of global gene expression profiles and invasion front related genes in xenograft model.
1. Interspecies comparison of gene and gene expression profiles in a mouse model of colorectal liver metastasis and in clinical specimens A. What is the degree of interspecies overlap on the single-gene level?
B. How similar are gene expression patterns and single-gene expression in an interspecies comparison and can relations between these parameters in addition to histological assessment be used to explain interspecies overlap?
C. Which gene expression patterns and selected marker genes can be considered typical for the different compartments?
2. Global gene expression profiles of host tissue at the invasive front of colorectal liver metastases
A To examine whether a xenograft nude mouse model of colorectal liver metastases would deliver reliable and valid data
B To provide comprehensive and unbiased study of the components of the host reaction upon tumor invasion and
C To deliver potential target genes for the development of host cell directed therapeutics.
Aim of the thesis
3. Gene expression profiles of tumor cells in vitro, in vivo and at the invasion front of colorectal liver metastases
A To explore the gene expression changes in tumor invasion front during confrontation with host tissue
B Gain insight in the activation of the β-catenin promoter in the invasion front of colorectal liver metastases.
Materials
19
2 Materials
2.1 Instruments
Autoclave Systec V-95 (Systec GmbH)
Centrifuges MiniSpin & 5804R (Eppendorf) CO2-Incubator Hera-Cell 150 (Heraeus) Laminar Air- flow HeraSafe (Hearaeus) Microscope Axiovert 40 C (Carl Zeiss) MultiTM Image Light Cabinet Alpha Innotech
PALM® MicroBeam-Laser-System P.A.L.M. Microlaser Technologies AG, Bernried, Germany
PCR Machine Cyclone Gradient (PeQlab)
pH Meter Meter SevenEasy (Mettler Toledo) Precisions Balance ABS 104-S (Mettler Toledo)
Spectrophotometer Bio photometer (Biorad) UV Transilluminator Benda Laboratories
Vacuum pump VaccuSafe (Integra Biosciences)
Vortexer Reax Top (Heidolph)
2.2 Chemicals and reagents
1Kb Ladder Invitrogen
dNTP Invitrogen
ECL Amersham Pharmacia
FCS Sigma Aldrich
Lipofectamine 2000 Invitrogen
Rainbow Protein Marker Amersham Pharmacia RNAsin Promega RPMI Invitrogen Skimmed Milk Powder Carl Roth
2.3 Special Material
Biomax Light Film Kodak
Cell Culture Material Falcon, Greiner and Nunc Nalgene Membrane Slides for LCM Molecular Machines&Industries Microarray chips Affymetrix
Nitrocellulose Membrane Hybond Amersham Pharmacia
Whatmann Paper Whatmann
2.4 Plasmids
pSM2C Plasmid containing CXCL-1, IL-8 & non-silencing shRNAmir construct from Open Biosystems USA
Materials
pSEAPBhBCTNf1, pSEAPBhBCTNf2, pSEAPBhBCTNf3 containing fragment 1, 2&3 of β-catenin promoter from BCCM/LMBP Plasmid&DNA Library collection, Belgium
pBabe Puro containing puromycin resistance marker.
Sh RNAmir Clone Sequences
) Clone 1 (RHS1764-9681692)
TGCTGTTGACAGTGAGCGCCCTGCACACTGTCCTATTATATAGTGAAGCCACAGA TGTATATAATAGGACAGTGTGCAGGTTGCCTACTGCCTCGGA
Clone 2 (RHS1764-9193979)
TGCTGTTGACAGTGAGCGCCCTGCACACTGTCCTATTATATAGTGAAGCCACAGA TGTATATAATAGGACAGTGTGCAGGTTGCCTACTGCCTCGGA
) Clone 1 (RHS1764-9502516)
TGCTGTTGACAGTGAGCGAGGGAGAATATACAAATAGCAATAGTGAAGCCACAGA TGTATTGCTATTTGTATATTCTCCCGTGCCTACTGCCTCGGA
Clone 2 (RHS1764-9210951)
TGCTGTTGACAGTGAGCGCCGGAATAATGAGTTAGAACTATAGTGAAGCCACAGA TGTATAGTTCTAACTCATTATTCCGTTGCCTACTGCCTCGGA
2.5 Kits
ECL Plus Western Blotting Detection Kit Amersham Pharmacia Fast PlasmidTM Mini kit Eppendorf
Light Cycler RNA Master SYBR Green I Roche
Materials
21
MegascriptTM High Yield Transcription Kit Ambion
Phospha-LightTM System Applied Biosystems
Plasmid Maxi Kit Qiagen
RiboAmpTM HS RNA Amplification Ki Arcturus
RNA 6000 Pico LabChip Kit Agilent Technologies RNA Transcript Labelling Kit Affymetrix
RNeasy® mini Kit Qiagen
2.6 Cell Lines
LS174T Human colon adenocarcinoma cell line CT26 Mouse colon carcinoma cells
2.7 Reagents
50x TAE-Buffer (1l)
242g Tris Base
57.1ml Glacial Acetic acid
37.2g Na2 EDTA, pH 8,0
TE Buffer
0.040M Tris-acetate
0.1% Acetic acid
0.002M EDTA.2H2O pH 8.0
Gel loading Buffer
5% Glycerin
166. 7 µM EDTA
0.0025% Bromophenol Blue
PBS 10X, pH 7,4
80g NaCl
2g Kcl
14.4g Na2HPO4-7H2O
2.4g KH2PO4
make upto 1l with H2O LB-Agar medium
20 g/l Peptone
10 g/l Yeast extract
5 g/l NaCl
Materials
15 g/l Agar
2x-LB broth (low-salt) Medium
20 g/l Peptone
10 g/l Yeast extract
5 g/l NaCl
50µg/ml Chloramphenicol 10X Laemmli running Buffer
250mM Tris base
1.92M Glycine
1% SDS
2X Laemmli sample buffer
pH 6.8 0.12M Tris-HCl
20% V/V Glycerine
4% V/V SDS
10%V/V B-Mercaptoethanol
Stacking Gel (5%)
1.1ml H2O
2.5ml 30% Acrylamide Mix
1.3ml 1.0M Tris pH6.8
0.05ml 10% SDS
0.05ml 10% Ammonium Persulphate
0.002ml TEMED Separating Gel (15%)
0.68ml H2O
0.17ml 30% Acrylamide Mix
0.13ml 1.5M Tris pH6.8
0.01ml 10% SDS
0.01ml 10% Ammonium Persulphate
0.001ml TEMED Transfer Buffer I
36.33g Tris Base in 600ml water (pH 10.4)
200ml Methanol
Make upto 1l with water Transfer Buffer II
3.03 g Tris base in 600ml of water (pH 10.4)
200ml Methanol
Make upto 1l with water Transfer Buffer III
5.25g Norleucin 3.03g Tris Base in 600ml of water (pH 9.4)
200ml Methanol
Make upto 1l with water
Materials
23
Z-Buffer+EDTA
60mM Na2HPO4
40mM NaH2PO4
10mM KCl
1mM MgSO4
2.5mM EDTA pH 8.3
50mM b-mercaptoethanol (3µl/ml) Make upto 1l with water
Special Primers
T7 Primer MBI Fermentas
Oligo dT Invitrogen
Materials
Human Specific Primers
Gene Primer sequence Ann.
temp T(oC)
Product size (bp)
APAF1 60 124
For: 5’- AACCAGGATGGGTCACCATA -3’
Rev: 5’- ACTGAAACCCAATGCACTCC -3’
APOF 62 110
For: 5’- TTCTGCACCCAAAGTCACTG -3’
Rev: 5’- ATCAGCCTGACAACCAGCTT -3’
CDH1 65 110
For: 5’-AGGCCAAGCAGCAGTACATT-3’
Rev: 5’-ATTCACATCCAGCACATCCA-3’
CXCL1 55 -
For: 5’-Qiagen Quantitech Primer-3’
Rev: 5’- Qiagen Quantitech Primer -3’
CXCL2 55 -
For: 5’- Qiagen Quantitech Primer -3’
Rev: 5’- Qiagen Quantitech Primer -3’
CXCL3 55 -
For: 5’- Qiagen Quantitech Primer -3’
Rev: 5’- Qiagen Quantitech Primer -3’
CXCL5 55 -
For: 5’- Qiagen Quantitech Primer -3’
Rev: 5’- Qiagen Quantitech Primer -3’
COL5A2 58 105
For: 5’- TGGAGAAGGTGGAAAACCAG -3’
Rev: 5’- TCTCCTCTTTCCCCAGGATT -3’
CTNNB1 55 268
For: 5’- TTGGTAGGGTGGGAGTGGTTTA- 3’
Rev: 5’- CAGGCCAATCACAATGCAAG-3’
EpHB2 60 110
For: 5’- AGCATTACCCTGTCGTGGTC -3’
Rev: 5’- TTTATGGCTGTGGCGTTGTA -3’
EREG 60 186
For: 5’- TTTGCTCTCAGCTGATGTGTCC -3’
Rev: 5’- TGGCCTTGGTTGAAGACCAT -3’
IL-8 8CXCL8) 60 85
5'-CTC TTGGCA GCC TTC CTG ATT-3' 5'-TAT GCA CTG ACA TCT AAG TTC TTT
AGCA-3'
Materials
25
Mouse specific primers
MARCKS 58 189
For: 5’- CACCTTCTTCCTCTGCCTTG -3’
Rev: 5’- CCCATTGTGACCCCTATCAC -3’
MARK3 58 120
For: 5’- TTCCGTTACCCTGAGAGTCG -3’
Rev: 5’- GCCAGTGTAGGGAGATGCTT -3’
MPZL1 58 128
For: 5’- AAGGAAGCTGCTCACACTGA -3’
Rev: 5’- TCTGCAACCAGGAAAGGAGT -3’
RHOB 60 106
For: 5’- ACAGCTTCAGCACAGCCTCT -3’
Rev: 5’- CGCTTATGGCAAAAACAACC -3’
THBS2 58 124
For: 5’- TATTCCCGAGACCAACGAAG -3’
Rev: 5’- ACATCATCGTCACTCCCACA -3’
18s RNA 60
For: 5’-AAACGGCTACCACATCCAAG -3’
Rev: 5’-CCTCCAATGGATCCTCGTTA -3’
Gene Primer sequence Ann temp
T ( oC) Product size (bp)
Apof 62 124
For: 5’- ATACAGCCCAGCCGTCTAAA-3’
For: 5’- CCAGGGACAGAAAGGTTCAA-3’
cRBP 58 229
For: 5´- GAGGCATGGTTCTGCACTGA -3`
Rev: 5´- CCGTGGCTTCTGATCCTTGT -3`
Col5a2 58 210
For: 5’- ACACACGTGCCCAGTAATGA-3’
For: 5’- GGAAATCTATCCCAGCTTGC-3’
cstb 58 151
For: 5’- TGAAGTCCCAGCTTGAATCG -3’
Rev: 5’- AGGGGTTGAAACACCCTCAA -3’
ctsc 60 223
For: 5’- GGCAGTTGCCTTTGAAGTCC -3’
Rev: 5’- TCCTCTGCGGATACGGAAGT -3’
Materials
2.8 Antibodies
Actin ICN Biomedicals
α-Smooth Muscle Actin (Clone ASM-1) Cymbus Biotech
ß-catenin BD Biosciences
cRBP Santhacruz Biotechnology
CXCL-1 R&D (Gift from Dr.Wente)
Desmin (Clone D33) Dako Cytomation
Hep Par-1 (M7158) Dako Cytomation
Interleukin-8 Santacruz Biotechnology
Transgelin (SM 22 α) Abcam
ctss 60 178
For: 5’- ATTCAGCTCCCCTTTGGTGA -3’
Rev: 5’- TCCCATAGCCAACCACAAGA -3’
Dfy 62 173
For: 5’- GCCTCATGGGATGGTTCTCA -3’
Rev: 5’- TGGTCTGATGGCAGAACAGG -3’
Efnb2 59 176
For: 5’- TGTCATCGGTTGGCTACGTT -3’
Rev: 5’- CCAAAGCTGAACCAACTCCA -3’
Eng 58 197
For: 5’- ATATGGCTGCCCGGGATTAC -3’
Rev: 5’- CCAACCGAAGTTGTGCCAGT -3’
Flt1 60 176
For: 5’- CAGTGCAATCCCCACTGAGA -3’
Rev: 5’- ACACACTGCAGCCGACAAGA -3’
GapDH 62 -
For: 5’-TGC ACC ACC AAC TGC TTA-3’
For: 5’-CCT GCT TCA CCA CCT TCT T-3’
Gbp1 60 114
For: 5’- AGGGCAGCTGTCTTTGGGTA -3’
Rev: 5’- GCCAATCCCAGCTTAGAGCA -3’
Gbp2 60 127
For: 5’- CGACTCCATTTTGGGGTCAC -3’
Rev: 5’- GCATGATGAAGGCCGAGAGT -3’
Gbp3 60 171
For: 5’- CATAGCAGCTGAGCGGACAA -3’
Rev: 5’- TCCCTCAGCAGCATCTCCTT -3’
α-SMA 58 280
For: 5’-CCTGACTGAGCGTGGCTATT-3’
Rev: 5’-CGCTGACTCCATCCCAATGA-3’
Thbs2 58 108
For: 5’- GGGACCACACAAATTGATCC-3’
For: 5’- CCCAAACTCGTCGAAACCTA-3’
Tie1 58 173
For: 5’- AGCCTCGAAACTGCGATGAC -3’
Rev: 5’- GATGCCCGCATAGGTGAAGT -3’
Methods
27
3 Methods
3.1 Cell Culture and Animal Experiments Cell Culture
LS174T human colon adenocarcinoma and CT 26 Mouse colon carcinoma cells were cultured in RPMI (PAA Laboratories GmbH) supplemented with 10% FCS (Sigma–
Aldrich GmbH), 2 mM glutamine, 100 IU/ml penicillin, and 50 mg/ml streptomycin (PAA Laboratories GmbH). Medium renewal was done two times per week.
Cells were detached using Trypsin-EDTA (0.05% Trypsin/0.02% EDTA; PAA Laboratories GmbH) following standard protocols (Freshney et al., 1987). In order to freeze cells, cultures were detached and resuspended in 5 ml culture medium. Cells were pelleted by centrifugation at 1000 rpm for 10 min at 4°C. Pellets were resuspended in culture medium containing 10% DMSO (Sigma) to a concentration of 1x10⁶ cells/ml and stored at -800C
For cell counting, cells were stained with one volume trypan blue (Sigma–Aldrich GmbH) to visualize apoptotic cells and counted using a haemocytometer (Neubauer chamber), according to standard protocols (Freshney et al., 1987).
Animal Experiments
For animal experiments we modified a previously described model in which tumor cells are injected into the spleen of nude mice, resulting in extensive liver metastasis (Dunnington et al., 1987). Six to eight week old female, athymic nude mice (NMRI- nu/nu) (Möllegard and Bomholdgard Laboratories, Ry, Denmark) were anesthesized using Ethomidat (Radenarkon, Asta Medica Frankfurt, Germany) at a concentration of 40 µg/g bodyweight. They were subjected to a lateral abdominal incision extending just below the last left rib in a sickle shape of about 1 cm. The spleen was luxated and 50 µl of 5x10⁶ LS174T-cells were injected into the tip of the spleen using a 30.5 gauge needle. Alternatively, mice were subjected to a midline abdominal incision extending from the xiphoid process to just above the urinary bladder. The liver and its major blood vessels were exposed and 50 µl of 5x10⁶ LS174T-cells were injected into the upper mesenteric vein using a 30.5 gauge needle. In a third model, 50 µl of 5x10⁶ LS174T-cells were injected along the margin of the large liver lobe. All three
Methods
models produce extensive liver colonization after a period of 2 to 4 weeks. At that time, animals were euthanized, livers were removed and 10 mm thick pieces containing tumor areas and liver were embedded in TissueTek OTC medium (Sakura, Tokyo, Japan), snap frozen in methyl butane, pre-cooled in liquid nitrogen, and stored at -80°C.
3.2 Tissue preparation and laser microdissection (LMD)
Frozen tissue blocks were cut into 8 µm sections using a cryostat (Leica, Wetzlar, Germany) and stained using Cresyl Violet. Briefly, the staining consisted of sequential incubations in 70% ethanol (1 min), Meyer’s hematoxylin (Sigma, Taufkirchen, Germany, 1 min), DEPC treated tap water (1 min), 2% eosin (10 s), 70% ethanol (30 s), 95% ethanol (2 x 30 s), and 100% ethanol (2 x 30 s). Thereafter, the sections were left to air-dry for 5-10 minutes. After microscopic control of staining quality and tissue preservation, the sections were used for microdissection using Leica AS LMD (Leica, Wetzlar, Germany), MMI (Molecular Machines & Industries, Eching, Germany) or PALM laser microdissection instrument (PALM Microlaser Technologies GmbH).
Two distinct cell populations were separately microdissected for comparison between liver and invasion front liver: a) invasion front tissue extending 3 cell rows into the liver and 3 cell rows into the tumor, b) normal liver tissue at least 3 rows away from the invasion front. Microdissection was performed separately by three different scientists yielding material for three separate experiments (experiments 2-4, subject for RNA amplification). In addition, material for a fourth experiment was generated by the concerted action of all scientists (experiment 1, no RNA amplification). Four different distinct cell populations were microdissected for interspecies comparison and tumor versus tumor invasion comparison. a) Liver tissue atleast 3 cell rows away liver invasion front, b) liver invasion front 3 cell rows adjacent to the tumor invasion front, c) tumor invasion front 3 cell rows adjacent to the liver invasion front and d) tumor atleast 3 cell rows away from the tumor invasion front. After microdissection the slices were collected in tubes, added 50µl of Buffer RLT (Qiagen) and stored at - 80°C.
Methods
29
3.3 RNA extraction, quality control and quantification 3.3.1 Extraction of total RNA from cell lines
To extract RNA for microarray experiments, cells were quickly thawed at 37°C and pelleted at 1000 rpm for 10 min at 4°C prior addition of RLT Buffer (Qiagen). For quantitative RT-PCR experiments cells were detached by directly adding RLT Buffer (Qiagen) to the culture vessel. Total RNA was extracted according to the instructions given in the RNeasy mini kit manual. Briefly 1 volume of 70% ethanol (350µl) was added to the homogenized lysate and mixed well by pipetting slowly. 700 μl of the sample, including any precipitate that may have formed was transfer to an RNeasy spin column in a 2 ml collection tube and centrifuged for 15 seconds at10,000 rpm.
Flow-through was discarded, 350 μl Buffer RW1 was added to the RNeasy spin column and centrifuged for 15 seconds at 10,000 rpm to wash the spin column membrane. 80ml of DNase was added to the centre of the column and incubated at RT for 15 min. 350µl o of RW1 was pipetted onto the spin column and centrifuged at 10,000 rpm for 15 Sec. Flow-through was discarded and 500 μl Buffer RPE was added to the RNeasy spin column, centrifuged for 15 seconds at 10,000 rpm to wash the spin column membrane. 500 μl Buffer RPE was added to the RNeasy spin column, centrifuged for 2 min at 10,000 rpm. RNeasy spin column was placed in a new 2 ml collection tube and centrifuged at full speed for 1 min. RNA was eluted with 30-50 μl RNase-free water by centrifuged for 1 min at 10,000 rpm to elute the RNA in a new 1.5 ml collection tube.
3.3.2 Extraction of total RNA from snap-frozen and microdissected tissues
H&E and Cresyl violet stained histological sections were prepared from each tissue prior to RNA extraction. Representative tissue areas, identified on the H&E stained histological sections, were microdissected as described in the Tissue preparation and laser microdissection section and used for RNA extraction. 350µl final volume of RLT Buffer (Qiagen) was added to 3-5 frozen tubes of each sample and total RNA was extracted as described above.
(http://www1.qiagen.com/literature/handbooks/PDF/RNAStabilizationAndPurification/
FromAnimalAndPlantTissuesBacteriaYeastAndFungi/RNY_Mini/1035969_HB_Bench
Methods
Protocol.pdf). To eliminate contaminating DNA, RNA was treated using the DNAse I system of Qiagen.
3.3.3 Evaluation of RNA quantity and quality
Total RNA concentrations were determined using a spectrophotometer. To assess the quality of total RNA from cells, 0.5–1 μg RNA was separated on conventional 0.8%
agarose (Applichem GmbH) gels using 1 X TAE (prepared from 50 X TAE stock solution, see Appendix) as a running buffer (Ausubel et al.,1994.). Total RNA concentrations from microdissected samples were determined using RNA 6000 pico kit on an Agilent Bioanalyser instrument (Agilent technologies Deutschland GmbH) as described below
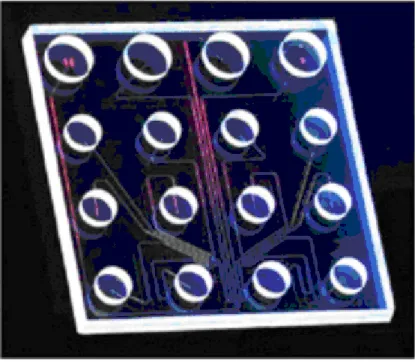
Principle of Lab-on-a-Chip
The electrophoretic assays are based on traditional gel electrophoresis principles that have been transferred to a chip format. The chip format dramatically reduces separation time and sample consumption. The system provides automated sizing and quantitation information in a digital format. On-chip gel electrophoresis is performed for the analysis of DNA, RNA and proteins.
Figure 1: Lab-on-a-chip (Source: Agilent Technologies)