ATLAS-CONF-2012-029 10March2012
ATLAS NOTE
ATLAS-CONF-2012-029
March 9, 2012
A Search fortt¯Resonances in the Lepton Plus Jets Channel using 2.05 fb−1of ppCollisions at √
s =7 TeV
The ATLAS Collaboration
Abstract
A search for top quark pair (t¯t) resonances in the lepton plus jets final states has been performed with the ATLAS experiment at the LHC. The search uses a data sample corre- sponding to an integrated luminosity of 2.05 fb−1 which was recorded in 2011 at a proton- proton centre-of-mass energy of 7 TeV. Limits are set on the production cross-section times branching ratio to top quark pairs of such resonances, ranging from approximately 9.3 pb at m=500 GeV to 0.95 pb atm=1300 GeV, excluding a leptophobic topcolourZ0boson with 500 GeV<mZ0 <860 GeV at 95% C.L. In Randall-Sundrum models, Kaluza-Klein gluons with masses between 500 and 1025 GeV are excluded at 95% C.L.
1 Introduction
The Standard Model of particle physics is believed to be an effective theory valid up to energies close to 1 TeV. However, no new physics beyond the Standard Model has been observed yet, and it is critical to explore a wide range of possible signatures.
A promising venue lies in final states that involve the heaviest of the particles presumed to be ele- mentary: the top quark. This note describes searches for new heavy particles decaying tot¯tpairs using the ATLAS detector [1] at the CERN Large Hadron Collider (LHC). Two final state topologies are con- sidered: “eplus jets” and “µplus jets”, in which the lepton originates from the decay to a neutrino and either an electron or a muon of one of the W bosons produced in the top quark decays. Events with electrons or muons produced inW→τν→e/µ3νcascade decays also contribute to this final state. The reconstructedt¯tmass spectrum, based on three or four jets, an electron or muon, and missing transverse momentum, is used to search for a signal.
Previous searches fort¯tresonances were most recently carried out by the CDF [2–6] and D0 [7–9]
collaborations at Run II of the Fermilab Tevatron Collider, and the ATLAS [10, 11] and CMS [12–14]
collaborations at the CERN LHC. No evidence for new particles was uncovered and 95% confidence level (C.L.) limits were set on the mass of a leptophobic topcolourZ0boson [15] atmZ0 > 900 GeV [5]
as well as on the coupling strength of a heavy colour-octet vector particle.
The benchmark model considered here to quantify the experimental sensitivity to narrow resonances is a topcolour Z0 boson [16] arising in models of strong electroweak symmetry breaking through top quark condensation [17]. The specific model is the leptophobic scenario, model IVin Ref. [16] with f1 =1 and f2 =0 and a width of 1.2% of theZt0boson mass. This is the same set of parameters that was used by the CDF and D0 Collaborations [5, 7]. The model for wide resonances is a Kaluza-Klein gluon gKK, which appears in Randall-Sundrum (RS) models with a warped extra dimension in which particles are located in the extra dimension [18–21]. The concrete model is described in detail in Ref. [22] and implemented in the Madgraph[23] event generator. The couplings to quarks take the “standard” RS values [19]: gL = gR = −0.2 for light quarks including charm,gL = 1.0, gR = −0.2 for bottom quarks andgL=1.0, gR=4.0 for the top quark. In this case, the resonance is predicted to be significantly wider than the detector and reconstruction algorithm’s resolution. This model is taken as a proxy for coloured resonances.
2 Data sample
The events in the dataset were collected with the ATLAS detector [1] at the CERN LHC in 2011 using single lepton triggers with transverse momentum thresholds at 20 or 22 GeV for electrons and 18 GeV for muons. These triggers use similar, but looser selection criteria than the offline reconstruction and reach their respective efficiency plateaus at 25 GeV (electrons) and 20 GeV (muons).
Only data where all subsystems are operational are used. Applying these requirements toppcollision data recorded in stable beam conditions between March and August 2011 at √
s=7 TeV results in a data sample of 2.05±0.08 fb−1[24, 25].
3 Simulated samples
The irreduciblet¯tbackground is simulated using MC@NLOv3.41 [26, 27] withCTEQ6.6[28] parton distribution functions (PDFs), interfaced to Herwig v6.5 [29,30] for the parton shower and hadronization steps and Jimmy[31] to model effects due to the underlying event and multiple parton scattering. Only events in which at least one of theW bosons decays leptonically, including decays to taus, are consid- ered. The totalt¯tcross-section is taken to be 165 pb based on an approximate NNLO calculation [32–34].
Electroweak single top quark production is simulated using the same programs, and cross-sections are based on approximate NNLO calculations: 65 pb (t-channel) [35], 4.6 pb (s-channel) [36] and 15.7 pb (Wt process) [35]. Samples produced with different settings or other generators are used to evalu- ate the systematic uncertainties due to the top quark mass, modelling of thet¯tmass distribution shape (Powheg[37]), the parton shower model (Powheg+Herwigcompared to Powheg+Pythia[38]), and ini- tial and final-state radiation effects (using AcerMC [39]). The latter uncertainties are considered both separately and in a correlated way.
Production of W and Z plus jets with leptonic vector boson decays are simulated with Alpgen v2.13 [40] andCTEQ6L1[41] PDFs in exclusive bins of parton multiplicity for multiplicities lower than five, and inclusively above that. For theZ boson plus jets sample,Z-photon interference is included and events are required to have a dilepton invariant mass in the range 40 < m`` < 2000 GeV. The events are processed by Herwigand Jimmy, and matrix element-parton shower matching is performed with the MLM [42] method. TheWandZplus jets samples are normalized to the NNLO cross-sections [43, 44], and in additionWplus jets samples are later normalized to data as described in Section 6.
The diboson samples are produced using Herwig v6.5 and MRST2007LO∗ [45] PDFs with Jimmy, with a filter requiring the presence of one lepton with pT >10 GeV and pseudorapidity|η| <2.81. The cross-sections (K-factors) used for these filtered samples are: 11.8 pb (1.52) forWW production, 3.43 pb (1.58) forWZ production, and 0.98 pb (1.20) forZZ production. The K-factors are chosen such that the cross-sections agree with results obtained using the MCFM [46, 47] generator.
Signal samples forZ0 bosons decaying tot¯tare generated using Pythia v6.421 withCTEQ6L1PDFs allowing all top quark decay modes. Samples of RS gluons are generated with Madgraph v4.4.51 [23]
with CTEQ6L1PDFs, and showered with Pythiawithout taking into account interference effects. The signal cross-sections are given in Table 1.
After event generation, all simulated samples are run through a GEANT4-based [48] simulation [49]
of the ATLAS detector and reconstructed using the same reconstruction software used for data. All samples are simulated including the effects due to multiple pp interactions per bunch-crossing, and events are reweighted so that the data and simulated sample luminosity profiles match.
1ATLAS uses a right-handed coordinate system with its origin at the nominal interaction point in the centre of the detector and thez-axis along the beampipe. Cylindrical coordinates (r,φ) are used in the transverse plane,φbeing the azimuthal angle around the beam pipe. The pseudorapityηis defined in terms of the polar angleθbyη=−ln
tanθ2 .
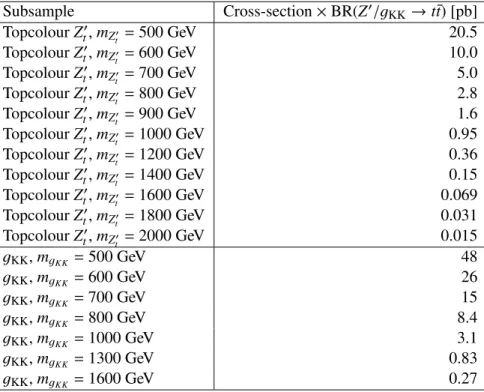
Table 1: Cross-sections for the resonant signal processes obtained using the generator and PDF combi- nations described in the text.
Subsample Cross-section×BR(Z0/gKK→t¯t) [pb]
TopcolourZt0,mZ0
t =500 GeV 20.5
TopcolourZt0,mZ0
t =600 GeV 10.0
TopcolourZt0,mZt0=700 GeV 5.0
TopcolourZt0,mZ0
t =800 GeV 2.8
TopcolourZt0,mZ0
t =900 GeV 1.6
TopcolourZt0,mZt0=1000 GeV 0.95
TopcolourZt0,mZ0
t =1200 GeV 0.36
TopcolourZt0,mZt0=1400 GeV 0.15
TopcolourZt0,mZ0
t =1600 GeV 0.069
TopcolourZt0,mZ0
t =1800 GeV 0.031
TopcolourZt0,mZt0=2000 GeV 0.015
gKK,mgKK =500 GeV 48
gKK,mgKK =600 GeV 26
gKK,mgKK =700 GeV 15
gKK,mgKK =800 GeV 8.4
gKK,mgKK =1000 GeV 3.1
gKK,mgKK =1300 GeV 0.83
gKK,mgKK =1600 GeV 0.27
4 Object reconstruction
Electron candidates are required to pass a tight electron selection, withET >25 GeV and|ηcluster|<2.47, whereηclusteris the pseudorapidity of the calorimeter cluster associated to the candidate. Candidates in the calorimeter transition region at 1.37 < |ηcluster| < 1.52 are excluded. Muon candidates are recon- structed from track segments in the different layers of the muon chambers. These segments are then combined starting from the outermost layer, with a procedure that takes material effects into account, and matched with tracks found in the inner detector. The final candidates are refitted using the complete track information from both detector systems, and required to satisfy pT>25 GeV and|η|<2.5.
To reduce the background due to leptons from decays of hadrons (including heavy flavours) produced in jets, the leptons in each event are required to be isolated. For electrons, the calorimeter isolation transverse energy in a cone inη-φspace of radius∆R= 0.2 around the electron position2, corrected for electron leakage and for the dependence on the number of primary vertices, is required to be less than 3.5 GeV. For muons, the corresponding calorimeter isolation energy in a cone of∆R = 0.3 is required to be less than 4.0 GeV, and the scalar sum of track transverse momenta in a cone of∆R = 0.3 is also required to be less than 4.0 GeV after subtraction of the muon pT. Additionally, muons are required to have a separation∆R > 0.4 from any jet with pT > 20 GeV, to further suppress muons from heavy flavour decays inside jets.
Jets are reconstructed with the anti-kt algorithm [50, 51] (R = 0.4) from topological clusters [52]
of energy deposits in the calorimeters, calibrated at the electromagnetic (EM) energy scale appropriate for the energy deposited by electrons or photons. These jets are then calibrated to the hadronic energy scale, using a correction factor obtained from simulation [52] which depends on pT andη. While the topological clusters are taken to be massless, their distribution within the jet cone leads the jet to acquire
2The radius∆Rbetween the object axis and the edge of the object cone is defined as∆R=p
(∆φ)2+(∆η)2.
a mass. Jets must have pT > 20 GeV and|η| <4.5. If the closest object to an electron candidate is a jet with a separation∆R<0.2 the jet is removed in order to avoid double-counting of electrons as jets.
Jets originating from b-quarks are selected by exploiting the long lifetimes of B-hadrons (about 1.5 ps) leading to typical flight paths of a few millimeters, which are observable in the detector. The combined JetFitter+IP3Db-tagging algorithm [53] is used in this analysis at an operating point yielding a 60% averageb-tagging efficiency in simulatedt¯tevents.
The magnitude of the missing transverse momentum (EmissT ) is constructed from the vector sum of all calorimeter cells contained in topological clusters. Calorimeter cells are associated with a parent physics object in a chosen order: electrons, jets and muons, such that a cell is uniquely associated to a single physics object. Cells belonging to electrons are calibrated at the electron energy scale, but omitting the out-of-cluster correction to avoid double cell-energy counting, while cells belonging to jets are taken at the corrected energy scale used for jets. Finally, the transverse momentum of muons passing selection requirements is included, and the contributions from any calorimeter cells associated to the muons are subtracted. The remaining clustered energies not associated to electrons or jets are included at the EM scale.
For all reconstructed objects in simulation, scaling factors are applied to compensate for the dif- ference in reconstruction efficiencies between data and simulation. The uncertainties on these scaling factors are used to determine the corresponding systematic uncertainties.
5 Event selection
After the event has been accepted by the trigger, it is required to have at least one offline-reconstructed primary vertex with at least five tracks, and it is discarded if any jet with pT > 20 GeV is identified as out-of-time activity or calorimeter noise [54]. The event must contain exactly one isolated lepton, and the lepton must match the triggered lepton. Events where an electron shares an inner detector track with a non-isolated muon are rejected. Finally the fraction oft¯tevents in the sample is enhanced by applying the following event cuts:
• in the electron channel, EmissT must be larger than 35 GeV and mT > 25 GeV, wheremT is the lepton-ETmisstransverse mass3;
• in the muon channel,ETmiss>20 GeV andEmissT +mT >60 GeV is required.
• If one of the jets has massmj>60 GeV, the event must contain at least three jets withpT >25 GeV and|η|<2.5. If not, at least four jets satisfying the same pTand|η|<2.5 criteria must be present.
• The leading jet must have pT >60 GeV.
• At least one of the jets must be tagged as ab-jet.
The sample of events with one high-mass jet represents less than 1% of the selected event sample.
6 Data-drivenW+jets corrections
The W+jets background is modeled using the Alpgen samples described in Section 3, but additional normalization factors are derived based on the charge asymmetry inW-boson production at the LHC:
(NW++NW−)exp = rMC+1 rMC−1
!
(NW+−NW−)data, (1)
3The transverse mass is defined by the formulamT = q
2p`TETmiss(1−cos∆φ), whereplT is the lepton pT and∆φis the azimuthal angle between the lepton andEmissT .
where NW+ and NW− are the number of events with W+ and W− bosons, rMC = NW+/NW−, and the superscripts exp and data denote expected and data events, respectively. The difference, (NW+−NW−)data, and ratio, rMC, are extracted from data and simulation, respectively, as a function of the number of reconstructed jets passing the selection cuts. The background contamination in the W boson samples extracted from data is verified to be charge-symmetric within uncertainties and cancels in the difference.
In the tagged four-jet bin, the simulated samples are found to need an overall normalization factor of 0.91 (0.81) in the electron (muon) channel to match the data-driven prediction. The overall normalization uncertainty on theWplus jets background is conservatively set at 48%.
The flavour composition is determined from data based on the tagged fraction of one and two-jet events [55] and the knownb-tagging efficiencies, measured using various techniques involving jets con- taining muons [56]. The MC predictions for different flavour contributions are scaled accordingly, while keeping the totalWplus jets normalization unchanged. TheWbb¯ andWc¯ccomponents have to be scaled by a factor 1.63, theWccomponent by a factor 1.11, and the “light parton” component by a factor 0.83.
The flavour composition uncertainty of theWplus jets background is estimated by varying these scaling factors by their uncertainties (13% forWbb¯ andWc¯c, 9% forWc).
7 Data-driven multijet background estimation
Jets, including those containing a leptonically decaying B or D hadron, can fake the isolated lepton signature produced by W boson decays. Multijet events can thus contain “fake” leptons (i.e. objects that pass the lepton selection but are not leptons from W boson decay) and contribute to the selected event sample. The multijet background expectation and kinematic distributions are determined using the jet-electron method, developed for the electron channel in the t¯t cross-section measurement [57]
and described below. Since the multijet background in theb-tagged samples is dominated by real, non- prompt leptons from heavy flavour quark decays in both electron and muon samples, the jet-electron method is applied to the muon channel as well. The method models the fake lepton background with a data-driven template, whose normalization is determined from the multijet-dominated lowEmissT region.
The jet-electron method selects events from a jet-triggered sample where exactly one jet with a high electromagnetic fraction (between 0.8 and 0.95) is present. This jet, which in addition must have at least four tracks to reduce the contribution from photon conversions, is used to model the fake electron.
Events in which a good electron is present are rejected, thus yielding samples highly enriched in multijet background with kinematic characteristics very similar to the multijet events that do pass all the selection cuts.
To determine the normalization of the multijet background, the data-driven multijet template and the simulated t¯t, single top,W+jets andZ+jets background MC samples are fitted to the data, for each channel separately, using the fullETmissspectrum, i.e. applying all selections except theEmissT cut. Other contributions are negligible after all selection cuts. The MC samples are scaled to the Standard Model expectation, with each bin value allowed to vary according to a Gaussian distribution, with 10% RMS to account for their own modelling uncertainties. The multijet background and signal EmissT spectra are sufficiently different so that fitting the multijet contribution to the full distribution will not mask a potential signal.
In the jet-electron approach, the template is determined before applyingb-tagging to reduce statistical fluctuations. The kinematic distributions in both tagged and untagged samples have been verified to agree in shape within the available statistics.
Normalization uncertainties of 50% are assigned, based on the fit results and available statistics in the multijet-dominated region of the EmissT distribution. Uncertainties in the shape of the multijet background are estimated by comparing the templates for different primary vertex multiplicities and for different values ofHT+ETmiss, whereHTis the scalar sum of transverse momenta of jets, and the lepton
in the event.
8 Mass reconstruction
To reconstruct thet¯tinvariant mass, the neutrino’s longitudinal momentum (pz) is determined by impos- ing the W-boson mass constraint. If there are two solutions, the smallest pz solution is chosen. If the discriminant of the quadratic equation is negative, the missing transverse energy is adjusted to get a null discriminant [58].
Different mass reconstruction algorithms are used for the samples with or without a jet withmj >
60 GeV. In the sample without, the dominant source of long, non-Gaussian tails in the mass resolution is the use of a jet from initial- or final-state radiation in the place of one of the jets directly related to a top quark decay product. To reduce this contribution, the four leading jets with pT > 20 GeV and
|η| <2.5 are considered, and a jet is excluded if its angular distance to the lepton or closest jet satisfies
∆R > 2.5−0.015×mj, wheremj is the jet’s mass. If more than one jet satisfies this condition, the jet with the largest∆Ris excluded. If a jet was discarded and more than three jets remain, the procedure is iterated. Thenmt¯t is reconstructed from the lepton,EmissT and the leading four jets, or three jets if only three remain. The∆Rcut removes jets that are well-separated from the rest of the activity in the event.
Furthermore, by only requiring three jets in the mass reconstruction, the method allows one of the jets from top quark decay to be outside the detector acceptance, or merged with another jet.
For high-mass events, the top quark andW boson momenta might be large enough for some of the decay products to be merged into a single jet, in which case using the four highest pTjets would lead to an overestimation ofmtt¯. To mitigate this, if one of the jets has massmj >60 GeV, it is combined with the jet closest to it (in∆R) with pT > 20 GeV to form the hadronic top quark candidate, and the other top quark is formed by combining the reconstructed leptonicWboson candidate with the jet with pT >
20 GeV closest to it.
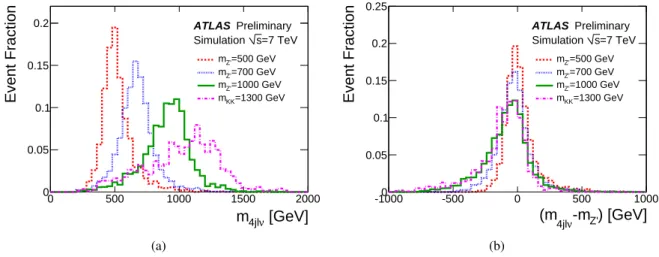
The reconstructed invariant masses and corresponding resolutions obtained are shown for four dif- ferent simulatedZ0boson masses in Figure 1.
[GeV]
ν
m4jl
0 500 1000 1500 2000
Event Fraction
0 0.05 0.1 0.15 0.2
=500 GeV mZ'
=700 GeV mZ'
=1000 GeV mZ'
=1300 GeV mKK
ATLAS Preliminary
=7 TeV s Simulation
(a)
) [GeV]
-mZ' ν
(m4jl
-1000 -500 0 500 1000
Event Fraction
0 0.05 0.1 0.15 0.2 0.25
=500 GeV mZ'
=700 GeV mZ'
=1000 GeV mZ'
=1300 GeV mKK
ATLAS Preliminary
=7 TeV s Simulation
(b)
Figure 1: Reconstructedt¯tpair invariant mass (left) and its resolution (right) for fourZ0 boson masses:
mZ0 =500, 700, 1000 and 1300 GeV.
9 Comparison of data and background expectation
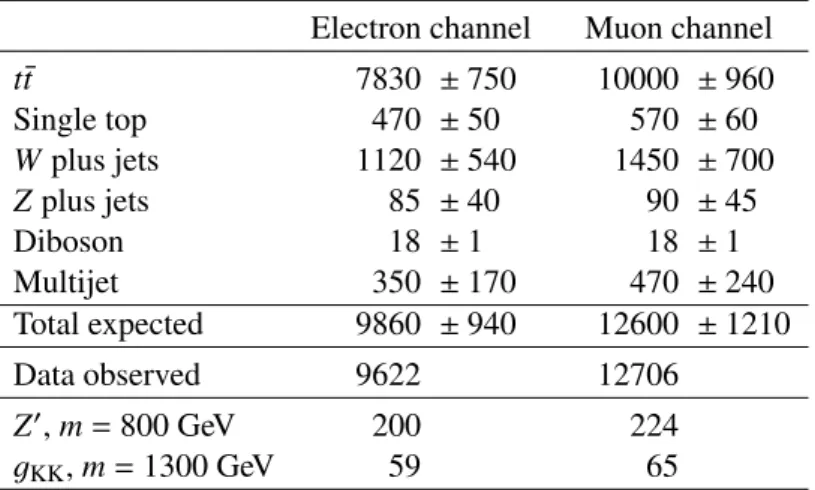
Table 2 compares the event yields observed in data with the expectation from the background estimation after applying the event selection cuts described in Section 5. The agreement is seen to be very good.
Table 2: Number of expected and observed events for the electron and muon channels after applying all selection cuts described in Section 5. The uncertainties given are the normalization uncertainties as described in Section 10. Statistical uncertainties on these numbers are small. Expected event yields for two signal points are also shown.
Electron channel Muon channel
t¯t 7830 ±750 10000 ±960
Single top 470 ±50 570 ±60
Wplus jets 1120 ±540 1450 ±700
Zplus jets 85 ±40 90 ±45
Diboson 18 ±1 18 ±1
Multijet 350 ±170 470 ±240
Total expected 9860 ±940 12600 ±1210
Data observed 9622 12706
Z0,m=800 GeV 200 224
gKK,m=1300 GeV 59 65
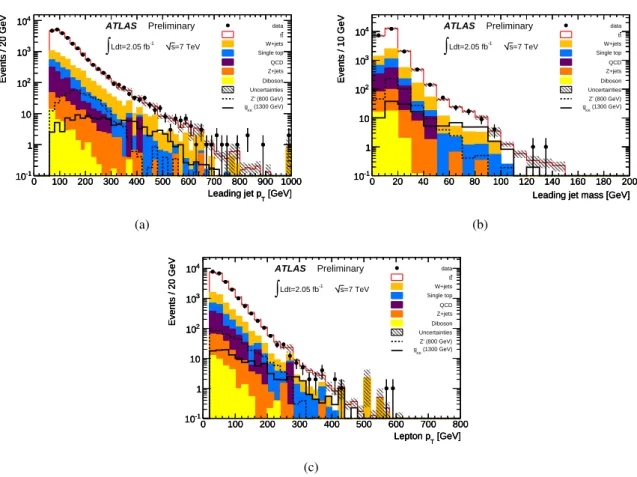
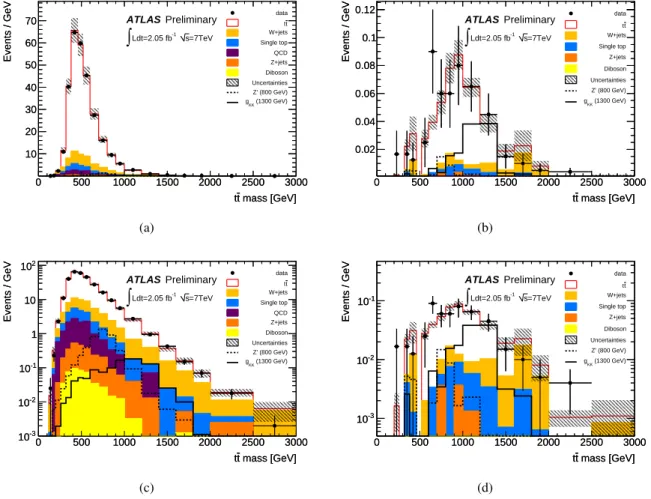
Good agreement is seen in the shapes of kinematic distributions as well. Figure 2 shows the leading jet pT, mass and charged lepton pTdistributions, and Fig. 3 the reconstructedmt¯t spectrum.
[GeV]
Leading jet pT
0 100 200 300 400 500 600 700 800 900 1000
Events / 20 GeV
10-1
1 10 102
103
104 data
t t W+jets Single top QCD Z+jets Diboson Uncertainties Z' (800 GeV) (1300 GeV) gKK
ATLAS Preliminary Ldt=2.05 fb-1
∫ s=7 TeV
[GeV]
Leading jet pT
0 100 200 300 400 500 600 700 800 900 1000
Events / 20 GeV
10-1
1 10 102
103
104
[GeV]
Leading jet pT
0 100 200 300 400 500 600 700 800 900 1000
Events / 20 GeV
10-1
1 10 102
103
104
(a)
Leading jet mass [GeV]
0 20 40 60 80 100 120 140 160 180 200
Events / 10 GeV
10-1
1 10 102
103
104 datatt
W+jets Single top QCD Z+jets Diboson Uncertainties Z' (800 GeV) (1300 GeV) gKK
ATLAS Preliminary Ldt=2.05 fb-1
∫ s=7 TeV
Leading jet mass [GeV]
0 20 40 60 80 100 120 140 160 180 200
Events / 10 GeV
10-1
1 10 102
103
104
Leading jet mass [GeV]
0 20 40 60 80 100 120 140 160 180 200
Events / 10 GeV
10-1
1 10 102
103
104
(b)
[GeV]
Lepton pT
0 100 200 300 400 500 600 700 800
Events / 20 GeV
10-1
1 10 102
103
104 data
t t W+jets Single top QCD Z+jets Diboson Uncertainties Z' (800 GeV) (1300 GeV) gKK
ATLAS Preliminary Ldt=2.05 fb-1
∫ s=7 TeV
[GeV]
Lepton pT
0 100 200 300 400 500 600 700 800
Events / 20 GeV
10-1
1 10 102
103
104
[GeV]
Lepton pT
0 100 200 300 400 500 600 700 800
Events / 20 GeV
10-1
1 10 102
103
104
(c)
Figure 2: Leading jetpT(a), leading jet mass (b) and charged leptonpT(c) distributions after all cuts. The electron and muon channels have been added together and the grey hashed area shows the background normalization uncertainties. Overflows have been added to the last bin.
mass [GeV]
t t
0 500 1000 1500 2000 2500 3000
Events / GeV
10 20 30 40 50 60
70 datatt
W+jets Single top QCD Z+jets Diboson Uncertainties Z' (800 GeV) (1300 GeV) gKK
ATLAS Preliminary
Ldt=2.05 fb-1
∫ s=7TeV
mass [GeV]
t t
0 500 1000 1500 2000 2500 3000
Events / GeV
10 20 30 40 50 60 70
(a)
mass [GeV]
t t
0 500 1000 1500 2000 2500 3000
Events / GeV
0.02 0.04 0.06 0.08 0.1
0.12 data
t t W+jets Single top Z+jets Diboson Uncertainties Z' (800 GeV) (1300 GeV) gKK
ATLAS Preliminary
Ldt=2.05 fb-1
∫ s=7TeV
mass [GeV]
t t
0 500 1000 1500 2000 2500 3000
Events / GeV
0.02 0.04 0.06 0.08 0.1 0.12
(b)
mass [GeV]
t t
0 500 1000 1500 2000 2500 3000
Events / GeV
10-3
10-2
10-1
1 10 102
data t t W+jets Single top QCD Z+jets Diboson Uncertainties Z' (800 GeV) (1300 GeV) gKK
ATLAS Preliminary
Ldt=2.05 fb-1
∫ s=7TeV
mass [GeV]
t t
0 500 1000 1500 2000 2500 3000
Events / GeV
10-3
10-2
10-1
1 10 102
(c)
mass [GeV]
t t
0 500 1000 1500 2000 2500 3000
Events / GeV
10-3
10-2
10-1
data t t W+jets Single top Z+jets Diboson Uncertainties Z' (800 GeV) (1300 GeV) gKK
ATLAS Preliminary
Ldt=2.05 fb-1
∫ s=7TeV
mass [GeV]
t t
0 500 1000 1500 2000 2500 3000
Events / GeV
10-3
10-2
10-1
(d)
Figure 3: Reconstructedt¯tmass for all events (left) and for events with a jet with massmj > 60 GeV (right), on linear (top) and logarithmic (bottom) scales. The electron and muon channels have been added together and all events beyond the range of the histogram have been added to the last bin. The grey hashed area shows the background normalization uncertainties.
10 Systematic uncertainties
A total of 32 systematic uncertainties are taken into account, with none contributing more individually than 15% of the total uncertainty.
Systematic uncertainties that only affect the normalization of the different backgrounds come from the uncertainty on the integrated luminosity (3.7%), background normalizations (t¯t: +−9.67.0% [32], single top: 10%,W+jets: 48%,Z+jets: 48%, diboson: 5%, multijet: 50%), and lepton trigger and reconstruc- tion efficiencies (≤1.5%).
The dominant shape uncertainties arise from theb-tagging efficiency (18.9%/16.5% variation in the mZ0 =1000 GeV signal/background yields), jet energy scale including pileup effects (3.4%/4.2%) [52], and modelling of initial and final state radiation (0.9%/8.5%). The first two have been determined from data by comparing results from different methods and/or data samples, while the latter has been estimated from MC simulations in which the relevant parameters were varied (see Section 3).
Other uncertainties arising from MC modelling as well as lepton identification and momentum mea- surements have a substantially smaller impact.
11 Results
The results of this search are obtained by comparing the top quark pair invariant mass (mt¯t) distribution with background-only and signal-plus-background hypotheses. In practice, the search is done in two steps: in a first step the data is compared to the Standard Model prediction, i.e. the null hypothesis, using the BumpHunter[59] algorithm. Since no excess or deficit is found, in a second step a limit is set using a Bayesian approach [60] on the maximum allowed cross-section times branching ratio for new physics as a function ofmt¯t. In this limit-setting step, variable-size binning is used, with bins ranging in size from 40 to 500 GeV bins for narrow resonances, and 80 to 500 GeV for Kaluza-Klein gluons. These values are close to the mass resolution while limiting bin-by-bin statistical fluctuations. Mass values below 500 GeV, i.e. the threshold region, are not considered. A single bin contains all events with mtt¯ >2.5 TeV.
To set the limit, a likelihood function is defined for each bin of the reconstructedt¯tinvariant mass distribution. To calculate a likelihood for the whole distribution, the likelihoods of the single bins are multiplied. To combine the electron and muon channels, again the product of the single likelihoods is taken. The posterior probability density is calculated using Bayes’ theorem, with a positive flat prior in the signal cross-section. Systematic uncertainties are incorporated by smearing the parameters of the Poisson distribution in each bin. For each systematic a Gaussian prior controls the probability for a given deviation of the parameter from the nominal value. The upper limit on the signal cross-section times branching ratio is identified with the 95% point of the posterior probability. The expected limits are determined by using the background expectation instead of the data in the limit computation, and the one and two sigma bands around these limits are determined from the distribution of limits in pseudo- experiments.
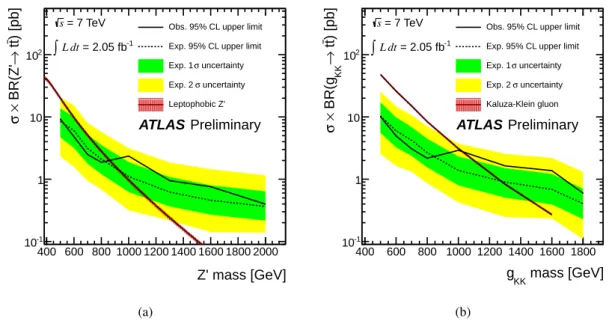
No significant excess is found. The observed limits on narrow and wide resonances are shown in Figure 4 together with the predicted cross-section times branching ratio for the models considered and the expected sensitivity of the analysis. The observed (expected) cross-section limit onσ×BR(Z0 →t¯t) ranges from 9.3 (8.5) pb atmZ0 = 500 GeV to 0.95 (0.62) pb atmZ0 = 1300 GeV, excluding 500 GeV
< mZ0 < 860 GeV at 95% credibility level (C.L.). The expected mass exclusion is 500 GeV< mZ0 <
940 GeV at 95% C.L. The observed (expected) cross-section limit on σ× BR(gKK → t¯t) ranges from 11.6 (10.3) pb atmgKK =500 GeV to 1.6 (0.9) pb atmgKK =1300 GeV, excluding resonances with mass between 500 and 1025 GeV at 95% C.L. The expected mass exclusion is 500 GeV< mgKK <1270 GeV at 95% C.L.
Z' mass [GeV]
400 600 800 1000 1200 1400 1600 1800 2000
) [pb]t t→ BR(Z'×σ
10-1
1 10 102
Obs. 95% CL upper limit Exp. 95% CL upper limit
uncertainty σ Exp. 1
uncertainty σ Exp. 2 Leptophobic Z' Obs. 95% CL upper limit Exp. 95% CL upper limit
uncertainty σ Exp. 1
uncertainty σ Exp. 2 Leptophobic Z'
ATLAS Preliminary
= 2.05 fb-1
dt
L
∫
= 7 TeV s
excluded(CDF)
(a)
mass [GeV]
gKK
400 600 800 1000 1200 1400 1600 1800
) [pb]t t→ KK BR(g×σ
10-1
1 10 102
Obs. 95% CL upper limit Exp. 95% CL upper limit
uncertainty σ Exp. 1
uncertainty σ Exp. 2 Kaluza-Klein gluon Obs. 95% CL upper limit Exp. 95% CL upper limit
uncertainty σ Exp. 1
uncertainty σ Exp. 2 Kaluza-Klein gluon
ATLAS Preliminary
= 2.05 fb-1
dt
L
∫
= 7 TeV s
(b)
Figure 4: Expected (dashed line) and observed (solid line) upper limits on σ× BR(Z0 → t¯t) (a) and σ× BR(gKK → t¯t) (b) The green and yellow bands show the range in which the limit is expected to lie in 68% and 95% of experiments, respectively, and the red lines correspond to the predicted cross- section times branching ratio in the leptophobic topcolour and RS models. The bands around the signal cross-section curves represent the effect of the PDF uncertainty on the prediction.
12 Summary and conclusions
A search for top quark pair (t¯t) resonances in the lepton plus jets final state has been performed with the ATLAS experiment at the LHC. The search uses a data sample corresponding to an integrated luminosity of 2.05 fb−1, and was recorded at a proton-proton centre-of-mass energy of 7 TeV. No evidence for a resonance is found. Using the reconstructed t¯tmass spectrum, limits are set on the production cross- section times branching ratio to t¯t for narrowZ0 models. Observed limits range from 9.3 pb at m = 500 GeV to 0.95 pb atm=1300 GeV, excluding a leptophobic topcolourZ0boson with 500 GeV<mZ0 <
860 GeV at 95% C.L. In Randall-Sundrum models, Kaluza-Klein gluons with masses between 500 and 1025 GeV are excluded at 95% C.L.
References
[1] ATLAS Collaboration,The ATLAS Experiment at the CERN Large Hadron Collider, JINST3 (2008) S08003.
[2] CDF Collaboration, T. Aaltonen et al.,Search for resonant t¯t production in pp collisions at¯ √ s= 1.96 TeV, Phys. Rev. Lett.100(2008) 231801,arXiv:0709.0705 [hep-ex].
[3] CDF Collaboration, T. Aaltonen et al.,Limits on the production of narrow t¯t resonances in pp¯ collisions at √
s=1.96 TeV, Phys. Rev.D77(2008) 051102,arXiv:0710.5335 [hep-ex].
[4] CDF Collaboration, T. Aaltonen et al.,Search for New Color-Octet Vector Particle Decaying to tt¯ in pp Collisions at¯ √
s=1.96 TeV, Phys. Lett.B691(2010) 183–190,arXiv:0911.3112 [hep-ex].
[5] CDF Collaboration, T. Aaltonen et al.,A search for resonant production of tt pairs in 4.8 fb¯ −1of integrated luminosity of ppbar collisions at √
s=1.96 TeV,arXiv:1107.5063 [hep-ex].
[6] CDF Collaboration, T. Aaltonen et al.,Search for resonant production of t¯t decaying to jets in pp¯ collisions at √
s=1.96TeV,arXiv:1108.4755 [hep-ex].
[7] D0 Collaboration, V. Abazov et al.,Search for tt resonances in the lepton plus jets final state in p¯ p¯ collisions at √
s=1.96 TeV, Phys. Lett.B668(2008) 98–104,arXiv:0804.3664 [hep-ex].
[8] D0 Collaboration, V. M. Abazov et al.,Search for a Narrow tt Resonance in p¯ p Collisions at¯
√s=1.96 TeV, Phys. Rev. Lett. (2011) ,arXiv:1111.1271 [hep-ex].
[9] D0 Collaboration,Search for tt resonances in the lepton¯ +jets final state in pp collisions at¯ √ s
=1.96 TeV, D0 Note 5882-CONF, Fermilab, Batavia, IL, March, 2009.
[10] ATLAS Collaboration,A Search for t¯t Resonances in the Lepton Plus Jets Channel in 200 pb−1of pp Collisions at √
s=7TeV, ATLAS-CONF-2011-087, June, 2011.
[11] ATLAS Collaboration,A Search for t¯t Resonances in the Dilepton Channel in 1.04 fb−1of pp Collisions at √
s=7 TeV, ATLAS-CONF-2011-123, August, 2011.
[12] CMS Collaboration,Search for Resonances in Semi-leptonic Top-pair Decays Close to Production Threshold, CMS-PAS-TOP-10-007, 2010.
[13] CMS Collaboration,Search for BSM t¯t Production in the Boosted All-Hadronic Final State, CMS-PAS-EXO-11-006, July, 2011.
[14] CMS Collaboration,Search for heavy narrow resonances decaying to ttbar in the muon+jets channel, CMS-PAS-EXO-11-055, August, 2011.
[15] C. T. Hill and S. J. Parke,Top production: Sensitivity to new physics, Phys. Rev.D49(1994) 4454–4462,arXiv:hep-ph/9312324 [hep-ph].
[16] R. M. Harris, C. T. Hill, and S. J. Parke,Cross section for topcolor Z’(t) decaying to tt,¯ arXiv:hep-ph/9911288.
[17] C. T. Hill,Topcolor assisted technicolor, Phys. Lett.B345(1995) 483–489, arXiv:hep-ph/9411426.
[18] K. Agashe, A. Belyaev, T. Krupovnickas, G. Perez, and J. Virzi,LHC Signals from Warped Extra Dimensions, Phys. Rev.D77(2008) 015003,arXiv:hep-ph/0612015 [hep-ph].
[19] B. Lillie, L. Randall, and L.-T. Wang,The Bulk RS KK-gluon at the LHC, JHEP09(2007) 074, arXiv:hep-ph/0701166.
[20] A. Djouadi, G. Moreau, and R. K. Singh,Kaluza–Klein excitations of gauge bosons at the LHC, Nucl. Phys.B797(2008) 1–26,arXiv:0706.4191 [hep-ph].
[21] B. C. Allanach, F. Mahmoudi, J. P. Skittrall, and K. Sridhar,Gluon-initiated production of a Kaluza-Klein gluon in a Bulk Randall-Sundrum model,arXiv:0910.1350 [hep-ph].
[22] ATLAS Collaboration,Prospects for t¯t resonance searches using early ATLAS data., ATL-PHYS-PUB-2010-008, July, 2010.
[23] J. Alwall, P. Demin, S. de Visscher, R. Frederix, M. Herquet, et al.,MadGraph/MadEvent v4: The New Web Generation, JHEP0709(2007) 028,arXiv:0706.2334 [hep-ph].
[24] ATLAS Collaboration,Luminosity Determination in pp Collisions at √
s=7 TeV Using the ATLAS Detector at the LHC, Eur. Phys. J.C71(2011) 1630,arXiv:1101.2185 [hep-ex].
[25] ATLAS Collaboration,Luminosity Determination in pp Collisions at √
s=7 TeV using the ATLAS Detector in 2011, ATLAS-CONF-2011-116, August, 2011.
[26] S. Frixione and B. R. Webber,Matching NLO QCD computations and parton shower simulations, JHEP06(2002) 029,arXiv:hep-ph/0204244.
[27] S. Frixione, P. Nason, and B. R. Webber,Matching NLO QCD and parton showers in heavy flavour production, JHEP08(2003) 007,arXiv:hep-ph/0305252.
[28] P. M. Nadolsky, H.-L. Lai, Q.-H. Cao, J. Huston, J. Pumplin, et al.,Implications of CTEQ global analysis for collider observables, Phys. Rev.D78(2008) 013004,arXiv:0802.0007 [hep-ph].
[29] G. Corcella, I. Knowles, G. Marchesini, S. Moretti, K. Odagiri, et al.,HERWIG 6: An Event generator for hadron emission reactions with interfering gluons (including supersymmetric processes), JHEP0101(2001) 010,arXiv:hep-ph/0011363 [hep-ph].
[30] G. Corcella, I. Knowles, G. Marchesini, S. Moretti, K. Odagiri, et al.,HERWIG 6.5 release note, arXiv:hep-ph/0210213 [hep-ph].
[31] J. Butterworth, J. R. Forshaw, and M. Seymour,Multiparton interactions in photoproduction at HERA, Z. Phys.C72(1996) 637–646,arXiv:hep-ph/9601371 [hep-ph].
[32] S. Moch and P. Uwer,Theoretical status and prospects for top-quark pair production at hadron colliders, Phys. Rev.D78(2008) 034003,arXiv:0804.1476 [hep-ph].
[33] M. Beneke, M. Czakon, P. Falgari, A. Mitov, and C. Schwinn,Threshold expansion of the gg(qq)¯ →QQ¯+X cross section atO(α4s), Phys. Lett.B690(2010) 483–490,arXiv:0911.5166 [hep-ph].
[34] M. Aliev, H. Lacker, U. Langenfeld, S. Moch, P. Uwer, et al.,HATHOR: HAdronic Top and Heavy quarks crOss section calculatoR, Comput. Phys. Commun.182(2011) 1034–1046,
arXiv:1007.1327 [hep-ph].
[35] N. Kidonakis,Next-to-next-to-leading-order collinear and soft gluon corrections for t-channel single top quark production, Phys. Rev.D83(2011) 091503,arXiv:1103.2792 [hep-ph].
[36] N. Kidonakis,NNLL resummation for s-channel single top quark production, Phys. Rev.D81 (2010) 054028,arXiv:1001.5034 [hep-ph].
[37] S. Frixione, P. Nason, and C. Oleari,Matching NLO QCD computations with Parton Shower simulations: the POWHEG method, JHEP0711(2007) 070,arXiv:0709.2092 [hep-ph].
[38] T. Sjostrand, S. Mrenna, and P. Z. Skands,PYTHIA 6.4 Physics and Manual, JHEP0605(2006) 026,arXiv:hep-ph/0603175 [hep-ph].
[39] B. P. Kersevan and E. Richter-Was,The Monte Carlo event generator AcerMC version 2.0 with interfaces to PYTHIA 6.2 and HERWIG 6.5,arXiv:hep-ph/0405247 [hep-ph].