Schriften
zu Immobilienökonomie und Immobilienrecht
Herausgeber:
IREIBS International Real Estate Business School
Prof. Dr. Sven Bienert
Prof. Dr. Stephan Bone-Winkel Prof. Dr. Kristof Dascher Prof. Dr. Dr. Herbert Grziwotz Prof. Dr. Tobias Just
Prof. Gabriel Lee, Ph. D.
Prof. Dr. Kurt Klein
Prof. Dr. Jürgen Kühling, LL.M.
Prof. Dr. Gerit Mannsen
Prof. Dr. Dr. h.c. Joachim Möller Prof. Dr. Karl-Werner Schulte HonRICS Prof. Dr. Wolfgang Schäfers
Prof. Dr. Steffen Sebastian Prof. Dr. Wolfgang Servatius Prof. Dr. Frank Stellmann Prof. Dr. Martin Wentz
Band 88
Marcel Lang
Essays on Sentiment Analysis
through Textual Analysis in Real
Estate Markets
Marcel Lang
Essays on Sentiment Analysis through Textual Analysis in Real Estate Markets
Essays on Sentiment Analysis through Textual Analysis in Real Estate Markets Regensburg: Universitätsbibliothek Regensburg 2018
(Schriften zu Immobilienökonomie und Immobilienrecht; Bd. 88) Zugl.: Regensburg, Univ. Regensburg, Diss., 2018
ISBN 978-3-88246-390-3
ISBN 978-3-88246-390-3
© IRE|BS International Real Estate Business School, Universität Regensburg Verlag: Universitätsbibliothek Regensburg, Regensburg 2018
Zugleich: Dissertation zur Erlangung des Grades eines Doktors der Wirtschaftswissenschaften, ein- gereicht an der Fakultät für Wirtschaftswissenschaften der Universität Regensburg
Tag der mündlichen Prüfung: 12. Juli 2018 Berichterstatter: Prof. Dr. Schäfers
Prof. Dr. Just
II
Contents
List of Figures ... V List of Tables ... VI
1. Introduction... 1
1.1 General Motivation ... 1
1.2 Research Questions ... 3
1.3 Course of Analysis ... 4
1.4 References ... 6
2. Real Estate Media Sentiment Through Textual Analysis ... 7
2.1. Introduction ... 9
2.2. Literature Review ... 11
2.2.1 Sentiment in the Context of REIT Market Movements ... 11
2.2.2 Textual Analysis ... 12
2.3. Dataset ... 14
2.3.1 Text Corpus ... 14
2.3.2 Time Series Variables ... 14
2.4. Textual Analysis of News ... 16
2.4.1 Dictionary-based Approach ... 16
2.4.2 Sentiment Measures ... 18
2.5 Relationship Between Real Estate Media Sentiment and REIT Market Movements ... 20
2.5.1 Preliminary Analysis ... 20
2.5.2 Empirical Analysis: Vector Autoregressive Model ... 21
2.5.3 Results of VAR Models ... 22
2.6 Robustness ... 29
2.7 Conclusion... 31
2.8 References ... 33
3. On the Relationship Between Market Sentiment and Commercial Real Estate Performance – A Textual Analysis Examination ... 36
3.1 Introduction ... 37
3.2 Literature Review ... 39
3.2.1 Investors’ Sentiment and Commercial Real Estate ... 39
3.2.2 Sentiment Measure Using Textual Analysis ... 40
3.3 Data ... 42
3.3.1 News Data ... 42
3.3.2 Sentiment Measures Construction ... 43
3.3.3 Other Data ... 44
3.4 Methodology and Hypothesis Formation ... 46
3.4.1 Visual and Correlation Analysis ... 46
3.4.2 Regression Analysis ... 46
3.4.3 Vector Autoregressive Analysis ... 47
3.4.4 Granger Causality Tests ... 47
3.5 Results ... 49
3.5.1 Visual and Correlation Results ... 49
3.5.2 Regression Analysis Results ... 50
3.5.3 Vector Autoregressive (VAR) Analysis Results ... 55
3.5.4 Granger Causality Tests Results ... 57
3.6 Robustness Checks ... 58
3.7 Conclusion... 62
3.8 References ... 63
3.9 Appendix ... 65
4. News-Based Sentiment Analysis in Real Estate: A Machine-Learning Approach Via Support Vector Networks ... 67
4.1 Introduction ... 69
4.2 Literature Review ... 71
4.2.1 Sentiment Analysis and the Subcategory of Textual Analysis ... 71
4.2.2 Dominant Methodologies in Textual Analysis ... 72
4.2.3 Sentiment Analysis in the Context of Real Estate ... 72
4.3 Data ... 74
4.3.1 News Data ... 74
4.3.2 Real Estate Data ... 75
4.3.3 Further (Economic) Data ... 75
4.4 Methodology ... 77
4.4.1 Sentiment Extraction via Machine Learning ... 77
4.4.2 Creating Real Estate Sentiment Measures ... 78
4.4.3 Vector Autoregression ... 80
4.5 Results ... 82
4.5.1 Securitized Real Estate Market ... 82
4.5.2 Direct Real Estate Market ... 87
4.5.3 Synopsis ... 94
4.6 Conclusion... 95
4.7 References ... 97
4.8 Appendix ... 100
5. Conclusion ... 101
5.1 Executive Summaries ... 101
5.2 Final Remarks and Further Research ... 104
5.3 References ... 106
List of Figures
Figure 1.1: News-Impact Model ... 2
Figure 2.1: RE Media Sentiment vs. REIT Total Return ... 20
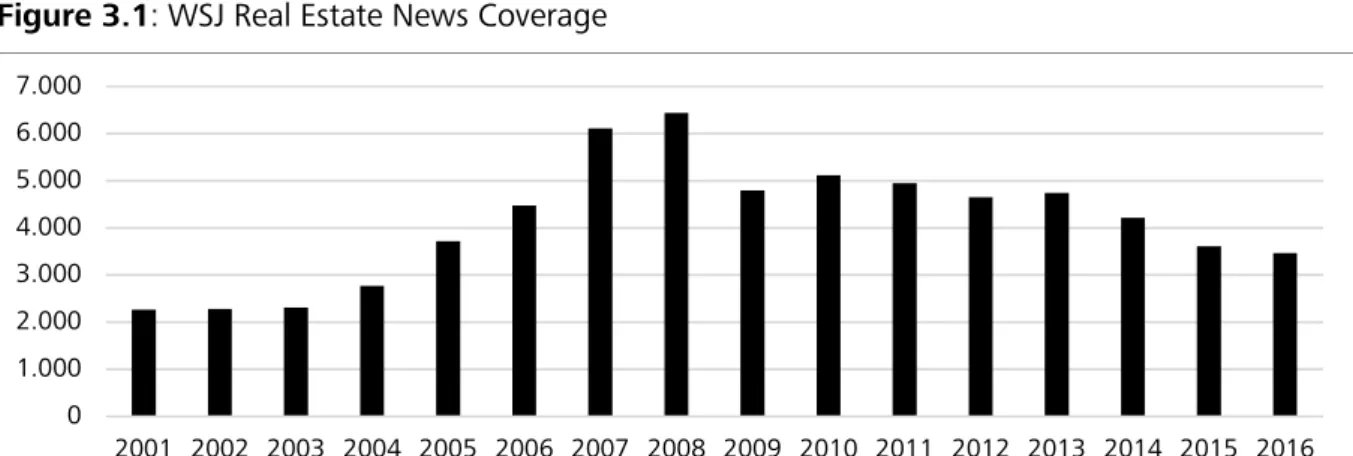
Figure 3.1: WSJ Real Estate News Coverage ... 43
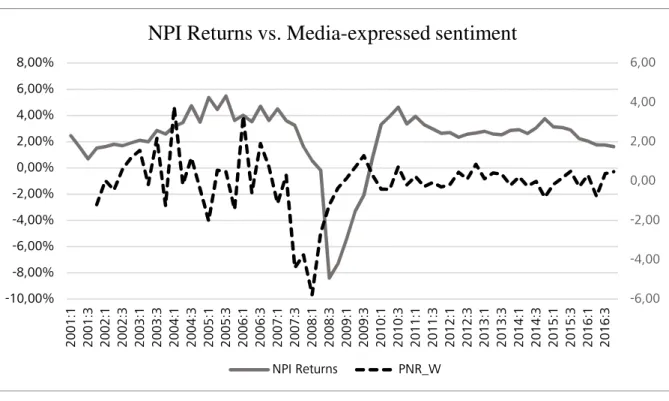
Figure 3.2: Direct Commercial Real Estate Returns and Media-Expressed Sentiment ... 49
Figure 4.1: SNL Real Estate News Coverage ... 75
List of Tables
Table 2.1: Descriptive Statistics ... 15
Table 2.2: VAR Results – Sentiment Quotient ... 23
Table 2.3: VAR Results – Various Different Sentiment Measures ... 26
Table 2.4: VAR Results – Specific REIT Sectors ... 28
Table 2.5: Robustness Tests ... 30
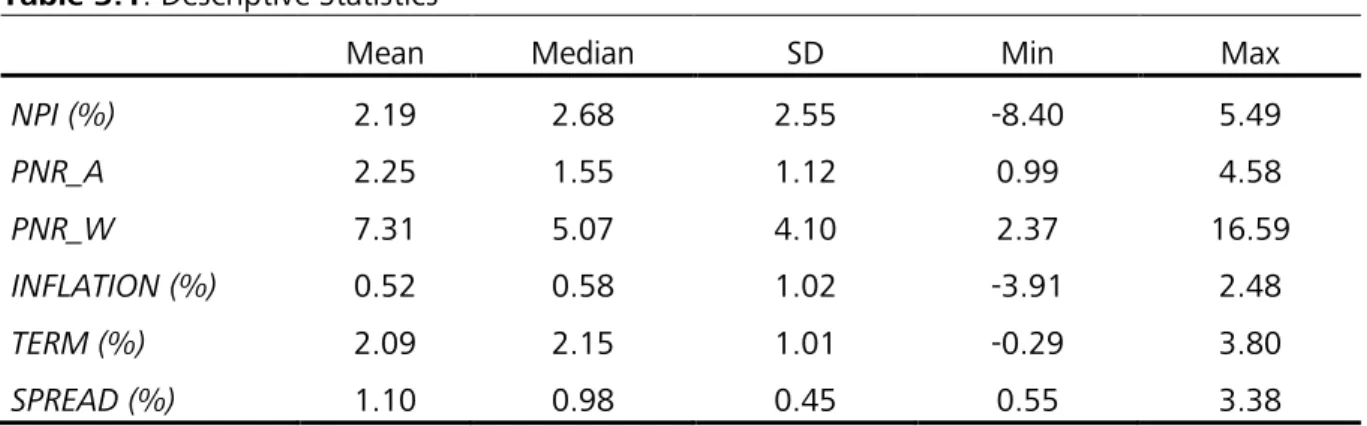
Table 3.1: Descriptive Statistics ... 45
Table 3.2: Correlations – Sentiment and Direct CRE Market ... 50
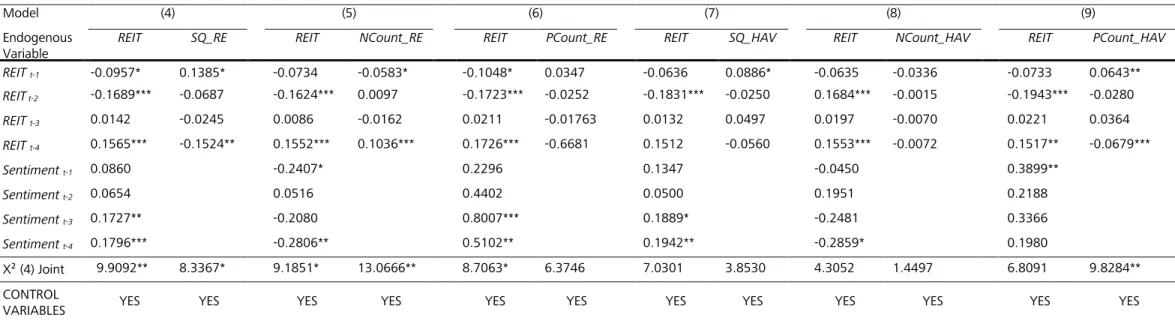
Table 3.3: Regression Results – Predicting Quarterly NPI Returns Using Media-Expressed Sentiment ... 51
Table 3.4: Regression Results – Predicting Annual NPI Returns Using Media-Expressed Sentiment ... 55
Table 3.5: VAR Results – Quarterly NPI Returns and Media-Expressed Sentiment ... 56
Table 3.6: Granger Causality Test Results ... 57
Table 3.7: Regression Results – Sentiment in Accelerating vs. Decelerating Markets ... 60
Table 4.1: Descriptive Statistics – Real Estate Returns and Economic Time Series ... 76
Table 4.2: Descriptive Statistics – News-Based Sentiment Measures ... 80
Table 4.3: VAR Results – News-Based Sentiment and Securitized RE Market ... 85
Table 4.4: VAR Results – News-Based Sentiment and Securitized RE Market – Controlling for Other Sentiment Indicators ... 86
Table 4.5: VAR Results – News-Based Sentiment and Direct RE Market ... 89
Table 4.6: VAR Results – News-Based Sentiment and Direct RE Market – Controlling for Other Sentiment Indicators ... 91
Table 4.7: Data Description ... 100
1. Introduction
1.1 General Motivation
Previous research (Clayton et al., 2009; Ling et al., 2014; Das et al., 2015) reports that fundamentals, such as economic variables and risk factors, do not account for all observed price changes in commercial real estate markets. Other studies (Baker and Wurgler 2007; Seiler et al., 2012) provide clear evidence that the investment decisions of real estate investors are not based solely on economic fundamentals, but also on personal beliefs and emotions. Despite these considerations, only limited research directly investigates the role of investor sentiment in real estate markets. To date, surveys are the most common approach to measuring investor sentiment directly in the realm of real estate. For example, recent research (Clayton et al., 2009; Das et al., 2015; Freybote, 2016) has employed the quarterly published Real Estate Research Corporation sentiment indicator.
However, surveys are associated with several inherent disadvantages. They are costly and labor- intensive, have a limited sample size and are highly dependent on the truthfulness of the respondents (Tourangeau et al., 2000). In addition, they are not ideal for time-series modeling, due to their low frequency and time-lag bias.
Sentiment analysis uses textual analysis to determine the sentiment expressed in text corpora regarding a certain entity, such as a particular product or stock. In short, it helps bridge the gap between qualitative information in texts and quantitative analysis for various purposes. Due to its great potential, sentiment analysis has recently drawn increased attention from companies, organizations and academia, and from various disciplines, as it enriches their analytical capabilities.
In fact, textual analysis is an emerging field of research in accounting and finance, where studies have found text-based sentiment measures to affect the aggregate market as well as individual stock performance (Tetlock, 2007; Loughran and McDonald, 2011; Heston and Sinha, 2016).
The digitalization of information and professionalization of the internet support sentiment analysis efforts, as a wealth of information worth investigating is created every day. The text data can come from several sources, such as news websites, social media platforms or corporate disclosures.
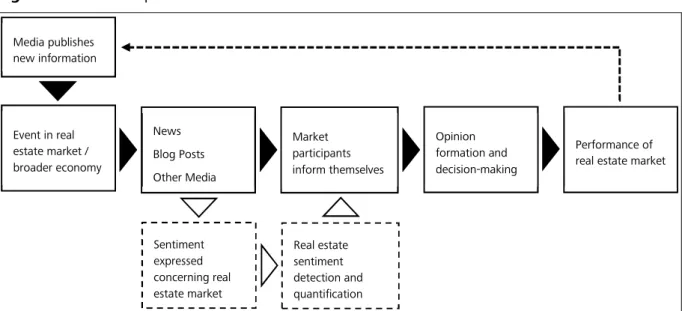
However, with his assessment “News media do play an important role both in setting the stage for market moves and in instigating the moves themselves”, Robert J. Shiller (2000), Nobel Prize Winner and Yale University Professor, highlights the importance of news for today’s markets. In addition, a considerable number of finance studies have found news to influence investor sentiment, hence the risk-return characteristics of assets (Tetlock, 2007; Schumaker and Chen, 2009; Heston and Sinha, 2016). Lately, real estate research has also started investigating the impact of text-based sentiment on decision-making processes and residential asset prices (Walker, 2014; Soo, 2015; Nowak and Smith, 2017). For example, Walker (2014) found text-based sentiment, captured from national newspapers, to Granger-cause house price changes in the UK. Similarly, Soo (2015) showed sentiment expressed in local housing news to have a significant effect on U.S. housing prices. Yet, no existing research directly investigates the role of any text-based sentiment in commercial real estate markets in the United States. Thus, the present dissertation addresses this gap in the literature and particularly captures text-based sentiment from real estate news published by leading financial and real estate news outlets. Consequently, the News-Impact Model (Figure 1.1) depicts the theoretical framework of the present dissertation. In simplified terms, different types of media report on certain events in the real estate markets or the broader economy. This model assumes that the information to which real estate investors are exposed – consciously or unconsciously – affects their
opinion-formation and decision-making processes. In this context, the news-based sentiment is assumed to impact on investor sentiment. Subsequently, investors’ expectation-based actions influence the commercial real estate market. Ultimately, the resulting real estate market events might be newsworthy and reported on again.
Figure 1.1: News-Impact Model
Accordingly, this dissertation aims to detect and quantify the sentiment expressed in real estate news stories published by several authoritative news outlets, such as The Wall Street Journal or S&P Global Market Intelligence. In this context, the dissertation proposes a novel approach to capturing news-based sentiment through various methodologies of textual analysis, i.e. the dictionary-based approach and a supervised machine-learning algorithm. Specifically, the three papers in this dissertation examine whether and to what extent news-based sentiment predicts returns from the securitized and direct commercial real estate market in the United States.
Event in real estate market / broader economy
News Blog Posts Other Media
Market participants inform themselves
Opinion formation and decision-making
Performance of real estate market
Real estate sentiment detection and quantification Media publishes
new information
Sentiment expressed concerning real estate market
1.2 Research Questions
This section provides an overview of the three papers in the dissertation and the respective research questions.
Paper 1: Real Estate Media Sentiment Through Textual Analysis
What is the status quo of textual analysis in the finance and real estate literature?
Is it possible to capture the sentiment expressed in real-estate-related news headlines using the dictionary-based approach?
Does news-based sentiment predict future movements of the securitized real estate market in the U.S.?
Is a sentiment measure which considers media optimism and pessimism, more appropriate than a measure which accounts only for either one?
Is a domain-specific dictionary more appropriate for domain-specific sentiment analysis tasks?
Paper 2: On the Relationship Between Market Sentiment and Commercial Real Estate Performance – A Textual Analysis Examination
What is the current state of research on sentiment analysis in the real estate literature?
Can the dictionary-based approach successfully capture sentiment expressed in real-estate- related news abstracts?
Does news-based sentiment predict returns from the direct commercial real estate market?
Is a weighted sentiment measure better suited as a leading market indicator, than an absolute measure?
Is there a feedback loop between news-based sentiment and the direct commercial real estate market?
Are direct commercial real estate markets more susceptible to sentiment during decelerating and/or bear markets?
Paper 3: News-Based Sentiment Analysis in Real Estate: A Machine-Learning Approach Via Support Vector Networks
What is the current state of research on text-based sentiment analysis for real estate markets?
Can sentiment expressed in real-estate-related news headlines be captured via a machine- learning approach?
Does text-based sentiment, captured via a supervised machine learning approach, predict returns from the securitized and direct commercial real estate market?
What are the intertemporal linkages between news-based sentiment and the securitized and direct U.S. real estate markets?
Do the text-based sentiment measures provide additional information beyond that provided by established sentiment indicators?
Are market participants influenced more strongly by pessimism rather than optimism expressed in news? Hence, is there empirical evidence of a negativity bias?
1.3 Course of Analysis
This section provides a chronological overview of the course of analysis with regard to the research purpose, the authors and the current publication status of the respective paper.
Paper 1: Real Estate Media Sentiment Through Textual Analysis
For the first time, the first paper in the dissertation examines the relationship between news-based sentiment and the securitized real estate market in the United States. In order to capture sentiment expressed in more than 125,000 real-estate-related news headlines from Bloomberg, The Financial Times, Forbes and The Wall Street Journal, a dictionary-based approach is deployed. Subsequently, the intertemporal linkages between different text-based sentiment measures and monthly returns from the securitized real estate market are analyzed in a vector autoregressive framework.
Authors: Jessica Ruscheinsky, Marcel Lang and Wolfgang Schaefers Submission to: Journal of Property Investment and Finance
Status: Forthcoming, Vol. 36 No. 5 (July 2018)
This paper was presented at the 2016 Annual Conference of the European Real Estate Society (ERES) in Regensburg, Germany, and the 2017 Annual Conference of the American Real Estate Society (ARES) in San Diego, USA. The paper received the ‘Best Paper Award in the PhD Session’ at ERES Conference, 2016.
Paper 2: On the Relationship Between Market Sentiment and Commercial Real Estate Performance – A Textual Analysis Examination
Inspired by the findings from the first study, this paper is the first to characterize the bi-directional relationship between news-based sentiment and the performance of U.S. direct commercial real estate from 2001 to 2016. The direct commercial real estate market is expected to be less efficient than the securitized and/or public market, and hence more susceptible to the impact of sentiment.
Using the dictionary-based approach, optimism and pessimism expressed in approximately 65,000 real-estate-related news abstracts of The Wall Street Journal is quantified and aggregated on a quarterly basis.
Authors: Eli Beracha, Jochen Hausler and Marcel Lang Submission to: Journal of Real Estate Research
Status: Under Review
This paper was presented at the 2018 Annual Conference of the ARES in Bonita Springs, USA.
Paper 3: News-Based Sentiment Analysis in Real Estate: A Machine-Learning Approach Via Support Vector Networks
The third and final paper of the dissertation aims to characterize the relationship between news- based sentiment and the securitized as well as the direct commercial real estate market in the United States from 2005 to 2016. This paper is unique in its approach, as for the first time, approximately 54,500 real-estate-related news headlines from S&P Global Market Intelligence were analyzed
concerning their respective sentiment, deploying a supervised machine-learning algorithm, i.e. a support vector machine.
Authors: Jochen Hausler, Jessica Ruscheinsky and Marcel Lang Submission to: Journal of Property Research
Status: Under Review
This paper was presented at the 2017 Annual Conference of the ERES in Delft, Netherlands, the 2017 Annual Conference of the ARES in San Diego, USA, as well as at the 2018 Annual Conference of the ARES in Bonita Springs, USA.
1.4 References
Baker, M. and Wurgler, J. (2007). Investor Sentiment in the Stock Market. Journal of Economic Perspectives, 21(2), 129-152.
Clayton, J., Ling, D. C. and Naranjo, A. (2009). Commercial Real Estate Valuation – Fundamentals Versus Investor Sentiment. The Journal of Real Estate Finance and Economics, 38(1), 5-37.
Das, P. K., Freybote, J. and Marcato, G. (2015). An Investigation into Sentiment-Induced Institutional Trading Behavior and Asset Pricing in the REIT Market. The Journal of Real Estate Finance and Economics, 51(2), 160-189.
Freybote, J. (2016). Real Estate Sentiment as Information for REIT Bond Pricing. Journal of Property Research, 33(1), 18-36.
Heston, S. L. and N. R. Sinha (2016). News versus Sentiment: Predicting Stock Returns from News Stories. Working Paper, Finance and Economics Discussion Series 2016, Washington, D.C., 6th June.
Ling, D. C., Naranjo, A. and Scheick, B. (2014). Investor Sentiment, Limits to Arbitrage and Private Market Returns. Real Estate Economics, 42(3), 531-577.
Loughran, T. and McDonald, B. (2011). When Is a Liability Not a Liability? – Textual Analysis, Dictionaries, and 10-Ks. The Journal of Finance, 66(1), 35-65.
Nowak, A. and Smith, P. (2017). Textual Analysis in Real Estate. Journal of Applied Econometrics, 32(4), 896-918.
Seiler, M. J., Seiler, V. L. and Lane, M. A. (2012). Mental Accounting and False Reference Points in Real Estate Investment Decision Making. Journal of Behavioral Finance, 13(1), 17-26.
Schumaker, R. P. and Chen, H. (2009). Textual Analysis of Stock Market Prediction using Breaking Financial News: The AZFin Text System. ACM Transactions on Information Systems, 27(2), 12-41.
Shiller, R. J. (2000). Irrational Exuberance. Princeton University Press, 71.
Soo, C. K. (2013). Quantifying Animal Spirits: News Media and Sentiment in the Housing Market.
Stephen M. Ross School of Business, Working Paper No. 1200, University of Michigan.
Tetlock, P. C. (2007). Giving Content to Investor Sentiment – The Role of Media in the Stock Market.
The Journal of Finance, 62(3), 1139-1168.
Tourangeau, R., Rips, L. J. and Rasinski, K. (2000). The Psychology of Survey Response. Cambridge University Press.
Walker, C. B. (2014). Housing Booms and Media Coverage. Applied Economics, 46(32), 3954-3967.
2. Real Estate Media Sentiment Through Textual Analysis
Abstract
Purpose
The purpose of this paper is to determine systematically the broader relationship between news media sentiment, extracted through textual analysis of articles published by leading U.S.
newspapers, and the securitized real estate market.
Methodology
The methodology is divided into two stages. First, roughly 125,000 U.S. newspaper article headlines from Bloomberg, The Financial Times, Forbes and The Wall Street Journal are investigated with a dictionary-based approach, and different measures of sentiment are created. Secondly, a vector autoregressive framework is used to analyse the relationship between media-expressed sentiment and REIT market movements over the period 2005 – 2015.
Findings
The empirical results provide significant evidence for a leading relationship between media sentiment and future REIT market movements. Furthermore, applying the dictionary-based approach for textual analysis, the results exhibit that a domain-specific dictionary is superior to a general dictionary. In addition, better results are achieved by a sentiment measure incorporating both positive and negative sentiment, rather than just one polarity.
Practical Implications
In connection with fundamentals of the REIT market, these findings can be utilized to further improve the understanding of securitized real estate market movements and investment decisions.
Furthermore, this paper highlights the importance of paying attention to new media and digitalization. The results are robust for different REIT sectors and when conventional control variables are considered.
Originality
This study demonstrates for the first time, that textual analysis is able to capture media sentiment from news relevant to the U.S. securitized real estate market. Furthermore, the broad collection of newspaper articles from four different sources is unique.
Acknowledgements
The authors would like to thank Matthias Himmelstoss for his technical support collecting the data.
The valuable feedback of the two anonymous referees is highly appreciated. Furthermore, we would like to thank ERES and ARES conference participants for their valuable feedback at our conference presentations. The authors also highly appreciate the Best Paper Award in the Ph.D Session at European Real Estate Society 2016 for this research project.
2.1. Introduction
‘A simple remark from him could cause the stock market and the dollar to rise or fall’, commented Abe (2011), who analysed the changes in Alan Greenspan’s language use during his period as chairman of the Federal Reserve Board. The message behind this concise proposition is one sound reason for intensified research efforts assessing how decision-making is often not based solely on fundamentals.
A substantial body of literature focuses predominantly on quantifying the effects of sentiment captured through the textual analysis of stock market related text corpora. The most important works on text-based sentiment analysis include Tetlock (2007), Das and Chen (2007), Tetlock et al.
(2008) and Loughran and McDonald (2011), who found significant correlations with stock returns, return volatility and trading volume. However, there is little research investigating the role of text- based sentiment in a real estate context and in particular none in relation to the securitized real estate market. Understanding the behaviour of Real Estate Investment Trust (REIT) price movements, using text-based sentiment measures, is especially relevant for two main reasons. Firstly, as an asset class, REITs are information-intensive. This derives from the aspect that both stock and real estate market characteristics must be taken into account due to the underlying asset class on the one hand and the stock exchange listing of REITs on the other hand. Secondly, real estate market information is mainly backward-looking and lacks expectations about future market conditions, for example, the NCREIF property index or Real Capital Analytics transactions.
Until recently, no attention has been paid to the extraction of sentiment through the textual analysis of online text corpora related to the REIT market. Especially interesting and promising is the investigation of online newspaper articles as a newly available source. Hence, this paper aims at filling this research gap by analysing newspaper article headlines from leading U.S. financial newspapers to evaluate the question of whether news media sentiment influences future securitized real estate market movements. The use of news analytics is defined by Das (2014) as a special subfield of textual analysis, which is associated with distinct advantages, in comparison to the traditional survey-based sentiment measures. Not only the immediate availability and objectivity of results is a key aspect, but also the option of scaling the methodology to a large data set and a wide variety of topics. Concerning the text corpus, news headlines offer several advantages compared to Twitter messages, blog posts or forum entries that have been explored in previous studies. News headlines are written more professionally and therefore contain (almost) no typographical errors, normally no slang or abbreviations, and extraction can be limited to a specific language.
Additionally, with respect to news, it is more likely that published information is reliable and read by a broad and, equally important, a relevant audience.
The newspaper sample consists of about 125,000 market-specific U.S. news article headlines from Bloomberg, The Financial Times, Forbes and The Wall Street Journal. These newspaper headlines are analysed by applying the dictionary-based approach. The adequacy of a general psychological dictionary is compared to a domain-specific dictionary. Subsequently, different sentiment measures are derived and tested in a vector autoregressive model on their linkage to the REIT market.
The empirical results suggest a significant relationship between media-expressed sentiment and REIT returns. The findings are robust when conventional control variables are considered. Specifically, a leading relationship of the created real estate media sentiment by three to four months is identified.
Moreover, the development of a domain-specific real estate dictionary, leads to a superior fit of the
model. The findings are relevant to various market participants, for example for investors’ decision- making processes, as media sentiment is forward-looking, contrary to traditional sentiment measures.
The remainder of this paper is structured as follows. Section 2.2 reviews the relevant literature in the context of textual analysis, as well as sentiment analysis in REIT markets. Section 2.3 presents a description of the data set. Having described the basics and the methodology of textual analysis in Section 4, a vector autoregressive model is derived and the results are analysed in Section 2.5.
Afterwards, these results are tested regarding their robustness in Section 2.6. Finally, Section 2.7 contains conclusions and the implications of the findings.
2.2. Literature Review
2.2.1 Sentiment in the Context of REIT Market Movements
Over the last few years, the theory of behavioural finance has replaced the efficient market hypothesis, introduced by Fama in 1970, which is based on the idea that asset prices incorporate
‘all existing, new, and even hidden information’ about fundamental values. Behavioural finance, which refers to as the collaboration between finance and a broader social science perspective, has led to new insights into actual financial markets. The real estate literature has evolved accordingly over the last years, augmenting traditional asset pricing models with behavioural factors. Relevant evidence in the direct real estate market was among others found by Ling et al. (2015). They constructed sentiment measures applying surveys of homebuyers, builders and mortgage lenders in order to predict movements in the Case Shiller U.S. National Home Price Index and ascertained a significant evidence in the following quarter. The direct commercial property market showed supportive results testing different investor sentiment measures and the effects on the NCREIF (Ling et al. 2014).
Likewise the securitized real estate market research developed. For instance, Lin et al. (2009) examined the return-generating process of REITs and showed that REIT returns become higher, or lower, when investors are more optimistic or pessimistic. Das et al. (2015) supplement the earlier findings by introducing institutional real estate investor sentiment as a non-fundamental component into REIT-pricing.
Economists have proposed and tested a broad range of measures to proxy for market sentiment.
Firstly, there are indirect measures such as the closed-end fund discount (Clayton and MacKinnon, 2003b, Barkham and Ward, 1999), the buy-sell-imbalance (Freybote and Seagraves, 2016) or mortgage flows (Ling et al., 2014; Clayton et al., 2009). Secondly, direct measures as survey-based proxies have been applied, such as the Real Estate Research Corporation sentiment measure (Das et al., 2015; Freybote, 2016; Clayton et al., 2009), a quarterly survey of institutional investors, the American Association of Institutional Investors Investor Sentiment Survey (AAII) or the U.S. Investor Intelligence sentiment indicator (Mathieu, 2016). With new possibilities opening up through digitalization, new ways of capturing sentiment are being introduced. Recently, several attempts have been made to use internet search volume data – Google Trends – to track investor sentiment, e.g. one of the first research papers is Hohenstatt et al. in 2011. Following on from that work, Rochdi and Dietzel (2015) and Braun (2016) found that Google-augmented models improve the predictability of REIT market movements and volatility.
However, many of the measures that are intended to indicate sentiment, are backward looking because they simply report information about the past. Sentiment extracted from newspaper articles focuses on published information in the past as well. However, there is a crucial difference:
newspaper articles not only reflect the past, but they do also discuss the implications from past events or announcements on the future. Furthermore, there are newspaper articles in the form of outlooks, forecasts or opinions about events in the future. Hence, market participants might get affected in their beliefs, which might affect decisions accordingly.
Beyond that, traditional survey-based sentiment measures are labour-intensive, rarely available and depend on the honesty of respondents. So far, there have been few empirical investigations using new online text corpora and none at all in the field of REIT market movements. Consequently, this paper seeks to go one step further and fill this knowledge gap by creating a media-expressed
sentiment that is captured from REIT-related newspaper articles by means of textual analysis. Hence, in the following Section, research on textual analysis is reviewed.
2.2.2 Textual Analysis
Probably, Tetlock (2007) represents the pioneering paper applying textual analysis to capture sentiment in the finance literature. Deploying the dictionary-based approach to capture sentiment in Wall Street Journal’s column ‘Abreast of the Market’, he found a significant relationship between pessimism reflected in news and price changes of the Dow Jones Industrial Average Index, as well as its trading volume. A number of researchers have used the dictionary-based approach, for example Henry and Leone (2010), Feldman et al. (2010) or Davis et al. (2012). This approach can be described as counting the number of positive and negative words in a text corpus according to a chosen dictionary that contains words considered to carry sentiment.
Tetlock (2007) used the Harvard GI word list, which subsequently became popular for further language processing research (Tetlock et al., 2008; Kothari and Short, 2009; Heston and Sinha, 2016). For example, Kothari and Short (2009) employed the Harvard GI word list to analyse firm- specific disclosures, discovering that positive disclosures are followed by declining firm risk measures and vice versa. Heston and Sinha (2016) made use of this dictionary, analysing news articles, and found that positive net sentiment for a specific firm (positive – negative frequency of words) is related to future high returns of that company.
A further milestone in dictionary-based textual analysis was conducted by Loughran and McDonald (2011), who demonstrated the relevancy of a domain-specific dictionary. They developed a financial- dictionary which was later used by many other researchers, for example Boudoukh et al. (2013), Jagadeesh and Wu (2013) or lately, Heston and Sinha (2016). Loughran and McDonald (2016) highlight two main advantages of the dictionary-based approach relevant for this paper. The first refers to subjectivity as a common problem within textual analysis. Once a dictionary-approach is applied, subjective decisions by researchers are avoided, as the evaluation process is bound strictly to the classifications within the dictionary. Second, and equally important for this research, the method can be scaled to a large sample. In summary, the literature has studied three main sources of digital information: public corporate disclosures/fillings, newspaper articles, internet messages as blog posts, tweets or forum entries.
Recently, some first attempts in the context of real estate were conducted to examine the impact of sentiment by analysing text corpora. First, Walker (2014) found a significant positive relationship between newspaper articles in the Financial Times and returns of listed companies engaged in the UK housing market. Soo (2013) investigated the sentiment expressed in 37,500 local housing news articles of 34 U.S. cities, in order to predict future house prices. She found that the measured sentiment leads housing price movements by more than two years. In accordance with his earlier findings, Walker (2016) subsequently analysed the direct housing market in the UK, and ascertained that news media granger-caused real house price changes from 1993 to 2008.
Based on the literature review and the highlighted research gap, this paper developed the following hypotheses:
Hypothesis 1: Media-expressed sentiment affects future REIT market movements.
Hypothesis 2: A domain-specific dictionary creates more efficient sentiment scores.
Hypothesis 3: The incorporation of both positive and negative sentiment creates a more accurate measure than solely negative sentiment.
2.3. Dataset
For this paper, two different datasets are relevant: (1) a text corpus consisting of news headlines and (2) a U.S. REIT index, as well as economic time series. In order to analyse the impact of media- expressed sentiment not solely for a specific market phase, an eleven-year period from 01/01/2005 to 12/31/2015 is considered. A monthly analysis is performed, to obtain a sufficient amount of news containing sentiment per aggregation period. Furthermore, monthly frequency is also chosen because some variables are not available at a higher frequency.
2.3.1 Text Corpus
Identifying the relevant information source – newspaper articles in this case – is essential for performing a meaningful sentiment analysis. In this context, a news source is considered ‘relevant’, if it has a significant readership by informed individuals or professional investors, who are expected to influence REIT prices. Consequently, this paper captures real estate-related sentiment expressed by the leading U.S. (financial) newspapers. In order to determine the relevance of a particular newspaper, the following aspects were considered: firstly, news sources from research already conducted in the literature (Wuthrich et al., 1998; Rachlin et al., 2007; Tetlock et al., 2008; and Chatrath et al., 2014 among others). Secondly, the most popular and frequently visited newspaper websites were identified using the Alexa1 U.S. ranking. Thirdly, the REIT-related news coverage of each newspaper was analysed.
Consequently, the text corpus consists of news articles from the following four leading U.S.
newspapers: Bloomberg, The Financial Times, Forbes and The Wall Street Journal. Gathering articles from multiple newspapers is advantageous, as it decreases the probability of obtaining biased sentiment from one source. The next step is the detection of real estate-related news, and excluding irrelevant news and noise. Therefore, specifically articles containing either the keywords ‘real estate’
and/or ‘REIT’ were retrieved from the digital archive of the respective news websites.2 This way, the data set includes news about the REIT market itself, as well as news about the underlying asset of REITs, namely real estate. Furthermore, the data queries were limited geographically to U.S. news.
Overall, 124,685 news articles were collected. Furthermore, it is important to note that this paper examines exclusively the headlines of the newspaper articles. This is in accordance with Permanuetilleke and Wong (2002), who argued that news headlines are usually more straight-to- the-point, more straightforward and contain fewer irrelevant words than full articles. Over the eleven-year period, Bloomberg (34.7%) and The Wall Street Journal (29.86%) account for the largest shares of real-estate-related news coverage, while the Financial Times and Forbes account for 22.57% and 13.43% of the dataset. On average, 945 headlines were published per month.
2.3.2 Time Series Variables
To analyse whether sentiment influences the aggregate U.S. securitized real estate market, the FTSE/NAREIT All Equity REITs U.S. Total Return Index (REIT) is selected, due to its comprehensive
1 www.alexa.com/about; Alexa offers a country-specific ranking, which measures the relative popularity of websites in a particular country, combining a site’s average of daily unique visitors and its estimated number of page views.
2 www.bloomberg.com, www.ft.com, www.forbes.com, www.wsj.com.
market coverage and long history. At the end of 2015, the index had a net market capitalization of
$937 billion, consisting of 166 constituents covering all property sectors. Monthly closing prices were used to track the movements of the REIT index.
Besides media-expressed sentiment, this study controls for potential fundamental and economic sources of variation in REIT market movements, according to the theory and previous empirical evidence. The significance of media-expressed sentiment must be tested in a multivariate setting to determine whether the created sentiment measures contribute independently to REIT returns, or whether they are simply picking up the impact of other missing variables. First, as several studies detect high correlations of REITs with common stocks (Clayton and MacKinnon, 2003a; Sebastian and Schaetz, 2009; Hoesli and Oikarinnen, 2012; Das et al,. 2015; Mathieu, 2016), the S&P 500 Price Index (SP500) controls for the U.S. stock market development. Second, the Aruoba-Diebold- Scotti Business Conditions Index (ADSI) and the Disposable Income (DISPOSINC) are considered as proxies for business conditions and the potential spending power of individuals. More precisely, the ADSI is a measure of economic activity at high frequency, covering the term structure of interest rates, defined by the spread between the 10-year and 3-month U.S. Treasury yields. In addition, it includes labour market developments by considering initial claims for unemployment insurance and real GDP, the latter representing general economic growth among others. To control for the direct commercial real estate market, this paper uses the U.S. Costar Commercial Repeat-Sale Index (CCRSI), a transaction-based index that is published monthly. Finally, the U.S. Consumer Confidence Index (CONCON) is a survey which accounts for consumer attitude towards the general state of the economy. All time series are derived from Thomson Reuters Eikon.
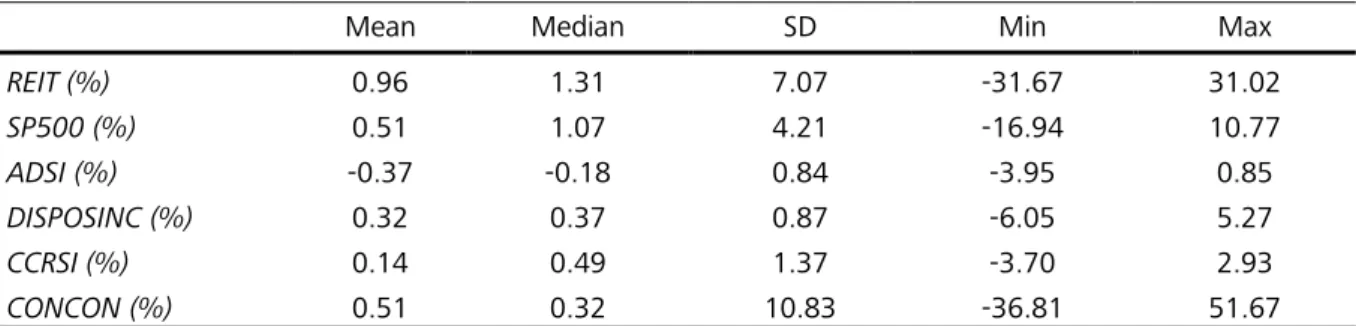
Table 2.1 provides descriptive statistics about the monthly REIT return data and the control variables.
Mean, median, standard deviation, minimum and maximum of levels are reported in decimal form.
Since the sample period covers part of a boom phase (2005/01 – 2007/06), the recent bust of the bubble (2007/07 – 2009/01) and the subsequent recession (2009/02 – 2015/12), the total returns of the securitized real estate market (REIT) show a wide range with extreme minimum (-31.67%) and maximum (31.02%) values. The REIT market averages at a monthly return of 0.96%. All control variables were transformed into growth rates to address non-stationarity issues.
Table 2.1: Descriptive Statistics
Mean Median SD Min Max
REIT (%) 0.96 1.31 7.07 -31.67 31.02
SP500 (%) 0.51 1.07 4.21 -16.94 10.77
ADSI (%) -0.37 -0.18 0.84 -3.95 0.85
DISPOSINC (%) 0.32 0.37 0.87 -6.05 5.27
CCRSI (%) 0.14 0.49 1.37 -3.70 2.93
CONCON (%) 0.51 0.32 10.83 -36.81 51.67
Notes: This table reports descriptive statistics of the monthly variables. REIT is the growth rate of the NAREIT All Equity total return index. SP500 is the growth rate of the S&P 500 Price Index. ADSI is the first difference of the Aruoba- Diebold-Scotti Business Conditions Index. DISPOSINC is the growth rate of the Disposable Income. CCRSI is the growth rate of the U.S. Costar Commercial Repeat-Sale Index. CONCON is the growth rate of the U.S. Consumer Confidence Index. Percentages are expressed in decimal form. The sample period is from January 2005 to December 2015.
2.4. Textual Analysis of News
2.4.1 Dictionary-based ApproachApplying the dictionary-based approach, the ‘bag-of-words’-technique is the basis for counting the number of positive and negative words. This technique is described by Nassirtoussi et al. (2014) as breaking the text corpora down into its individual words, meaning that the order and co-occurrence of the resulting features are not considered. Subsequently, the number of positive and negative words is summed for each text entity, delivering a sentiment score for each headline.
This paper uses two different dictionaries, first, the Harvard General Inquirer Word List and second, the financial dictionary of Loughran and McDonald (2011), adjusted for real estate specifics.
Harvard General Inquirer Dictionary
The established sociology and psychology dictionary Harvard General Inquirer (GI) Word List is a merger of the Harvard-IV-4 and Lasswell dictionaries and is freely available to all.3
The Harvard GI word list assembles 182 categories in total, such as words referring pleasure, pain, arousal or motivation-related words, such as need, goal, persist, and other categories such as words of cognitive orientation. This paper focuses on the classification categories positive and negative, which contain 1,915 words of positive and 2,291 words of negative outlook, after deleting duplicates. The decision to focus solely on the categories positive and negative, is based on the assumption that the allocation within these two categories is more precise and thus less error-prone compared to other categories.
Real Estate Dictionary
Loughran and McDonald (2011) showed that dictionaries should be sector-specific in order to classify text corpora successfully. Subsequently, many researchers have used the financial-language- orientated dictionary of Loughran and McDonald. As REITs are a financial product, the financial sector vocabulary is presumably applicable to the REIT context. Loughran and McDonald (2011) published six word lists – negative, positive, uncertainty, litigious, strong modal and weak modal – trying to capture the most likely interpretation of a word in a business context (McDonald, 2015).
This dictionary is also freely available.4 The two main advantages of this dictionary are firstly, that the words are selected based on financial communication from managers and secondly, they claim to be quite comprehensive. For subsequent analysis, the positive (354 words) and negative (2,355) word lists from Loughran and McDonald (2011) are used for the purpose of unambiguousness.
Following on from this, the financial dictionary was adapted to the context of real estate. First, the dictionary was controlled for its accuracy in a real estate context. If the given classification was not definite, words were deleted. Therefore, all words occurring more than 30 times within the complete text corpora were analysed. 43 out of 250 were found to have a rather different or unclear classification within a real estate context, and were subsequently removed. Second, over 10,000 newspaper articles were analysed manually regarding sentiment classification. Words appearing on
3 See http://www.wjh.harvard.edu/~inquirer/homecat.html.
4 See http://www.nd.edu/mcdonald/Word_Lists.html.
a regular basis and considered to convey a specific sentiment were added to the dictionary. In the end, 199 words, which 62 were positive and 137 negative, are included in the dictionary. For example, ‘bubble’ can be listed as a real-estate-specific word; it became popular in a real estate context during the recent financial crisis. Similarly, words like ‘crash’ and ‘depression’ were also included, since they are regarded as relevant, but missing in the financial dictionary. Ultimately, the real estate dictionary contains 410 positive and 2,455 negative words.
2.4.2 Sentiment Measures
Applying the dictionary-based approach, positive words are counted as ‘+1’ and negative words as
‘-1’; this facilitates calculating a sentiment score for each headline by summation. Negation is considered in the following way: the value of a positive or negative annotated word is reversed, multiplied by -1, if up to five words in front of the sentiment annotated word a negation word is present. This paper uses the following words from Loughran and McDonald (2012) as negation words: no, not, none, neither, never and nobody. The evaluation of the dictionary-based approach is performed with RapidMiner Studio.5 As a result, the predominantly represented sentiment in a headline defines the final sentiment score of a headline. More precisely, each headline is translated into a numerical sentiment value based on its overall classification: ‘1’ if the headline is positive (sentiment score ≥ 1), ‘-1’ if negative (sentiment score ≤ -1), and ‘0’ if neutral. Note, either of two circumstances can cause a score of ‘0’. First, no positive or negative word was found in a headline at all. Second, the number of positive and negative words is equal and hence, the scores neutralize each other.
After assigning each news headline individually with a sentiment score, this paper deploys three different ways of aggregating the scores into monthly sentiment measures: the Sentiment Quotient Positive (SQ), the Negative Count (NCount) and the Positive Count (PCount).
Equation 2.1: Sentiment Measure 1 – Sentiment Quotient (SQ)
= ℎ
ℎ + ℎ (1)
The SQ is a relative measure and considers headlines of both polarities, positive and negative, inspired by a company, offering sentiment analysis products (yukkalab 2017). Hence, the SQ indicates the degree of media optimism and pessimism for a given period, excluding all neutral headlines. The SQ is defined as the ratio of the number of positive headlines to the number of positive and negative headlines for a given period t. Consequently, one can easier identify whether a period is relatively positive or negative. If the number of positive headlines exceeds the number of negative ones, the SQ is greater than 0.5, indicating media optimism and vice versa.
In order to investigate the positive media sentiment and the negative media sentiment separately from each other, the subsequent two measures are calculated.
Equation 2.2: Sentiment Measure 2 – Negative Count (NCount)
= ℎ
ℎ (2)
The NCount is based on the negativity bias, which states that human psychology is affected more strongly by negative, rather than positive influences – even when the two are of equal intensity. The NCount yields to quantify relative media-expressed pessimism; and is defined as the number of negative headlines divided by the overall number of headlines for a given period t. This leads to the NCount ranging from 0 to 1; if the relative number of negative headlines increases, the NCount indicates increasing media pessimism.
5 RapidMiner Studio is a Data Science Software Platform.
To assess properly the relationship of media-expressed optimism and REIT returns, this paper deploys the Positive Count (PCount) as the third sentiment measure:
Equation 2.3: Sentiment Measure 3 – Positive Count (PCount)
= ℎ
ℎ (3)
The PCount is defined as the number of positive headlines divided by the overall number of headlines for a given period t. It ranges from 0 to 1 and increases with a relative increase in positive headlines indicating increasing media optimism.
2.5 Relationship Between Real Estate Media Sentiment and REIT Market Movements
2.5.1 Preliminary Analysis
Similarly to the findings of Walker (2014), who analysed the relationship between the UK housing market by means of 30,000 articles on local housing markets, the data of this paper shows an increase in the number of topic-specific newspaper articles published over time. However, the percentage of positive or negative news does not change. In 2005, the data set includes on average about 450 published articles per month. Over time, the number grew to a monthly average of about 1,100 articles in 2015. The number of articles peaked in November 2010 at 1,653 articles. A possible explanation for the sharp increase in 2007 can be the increased media attention due to the beginning of the U.S. subprime mortgage crisis, which led to the global financial crisis. Looking at 2010, a possible explanation is the enormous growth in web usage. In 2000, only 400 million users were connected to the Internet, by 2005, the number grown to 1 billion and then doubled to 2 billion people by 2010 (Internet Live Stats, 2017). Possibly, traditional journalism adapted by increasing the publication of digital news, as more people consume news online. This is reflected in the data set by a rise of 67% in the average yearly news coverage, when comparing the periods 2005 – 2009 and 2010 – 2015.
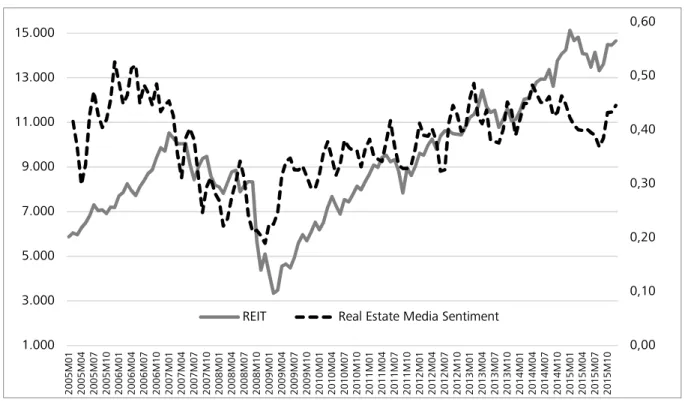
Figure 2.1: RE Media Sentiment vs. REIT Total Return
Notes: This figure plots the FTSE/NAREIT All Equity REITs U.S. Total Return Index (REIT) against the 2-month moving average of the Sentiment Quotient deploying the real estate dictionary (Real Estate Media Sentiment). The sample period is January 2005 to December 2015.
Figure 2.1 plots the positive sentiment quotient and the REIT total return index over the whole sample period. This gives a first impression about their relationship. The graph suggests the media sentiment measure to lead the REIT return index. For instance, the lowest value of the media sentiment can be found in December 2008, while the lowest value of the REIT is in February 2009.
Following, this initial idea is assessed statistically in a vector autoregressive framework.
0,00 0,10 0,20 0,30 0,40 0,50 0,60
1.000 3.000 5.000 7.000 9.000 11.000 13.000 15.000
2005M01 2005M04 2005M07 2005M10 2006M01 2006M04 2006M07 2006M10 2007M01 2007M04 2007M07 2007M10 2008M01 2008M04 2008M07 2008M10 2009M01 2009M04 2009M07 2009M10 2010M01 2010M04 2010M07 2010M10 2011M01 2011M04 2011M07 2011M10 2012M01 2012M04 2012M07 2012M10 2013M01 2013M04 2013M07 2013M10 2014M01 2014M04 2014M07 2014M10 2015M01 2015M04 2015M07 2015M10
REIT Real Estate Media Sentiment
2.5.2 Empirical Analysis: Vector Autoregressive Model
The relationship between REIT market movements and media-expressed sentiment possibly faces a so-called endogeneity problem. Similarly, macroeconomic variables often cannot be regarded as strictly exogenous. Furthermore, it is useful to investigate the additional explanatory power of the sentiment indices for the REIT returns over time. Therefore, a vector autoregressive model (VAR) is chosen. The dependent variables are each represented as a linear function of their own and each other’s lagged values, plus potential exogenous control variables.
Accordingly, the REIT index and the respective media sentiment indices are included as endogenous variables. To capture other potential sources of variation in REIT market movements, five different variants of the model were run, controlling for different factors influencing the model at each pass.
The control variables described in Section 2.3.2 are supplemented by a dummy variable for the recent financial crisis. The period is motivated by the findings of Walker (2016) and Brunnermeier (2009), who chose July 2007 as the starting point of the financial crisis; consistently, the end of the crisis is defined as January 2009.
An important assumption within the VAR framework is the stationarity of all variables. To test for stationarity, the Augmented Dickey-Fuller and Philipps Perron unit root tests are employed. Results from these tests suggest the use of first differences; all variables are found to be stationary in their first differences or growth rates.
A crucial step in constructing a VAR model is the appropriate selection of the lag length. This selection needs to be done with care, as it faces a trade-off; the curse of dimensionality reduces the degrees of freedom on the one side, whereas choosing a lag length that is too short, fails to correctly specify the model on the other side. To consider this trade-off, the Akaike Information Criterion (AIC), the Schwarz Information Criterion and the Hanna-Quinn Information Criterion were chosen.
They are measurements that minimize the variance of the error terms by punishing at the same time for included parameters to estimate. The basic functional form VAR framework looks as follows:
Equation 2.4: VAR Model
! = "#
"$! + % &'
&' ! + ( )
** +
./500
/ 0
0 0 1
22
3+ 4 56789
:79 ; (4)
As all three information criterions suggest a lag length of four; both endogenous variables enter the equation system with four lags: I = {1,..,4}. This is also confirmed by the likelihood ratio selection criteria and the Akaike’s final prediction error. A and B represent the respective coefficient matrix of the endogenous and exogenous variables. ut are the error terms in each equation.
One of the most important aspects is to test each model for autocorrelation. Each model output presented within this paper was tested for autocorrelation with the Autocorrelation LM Test and found not to be autocorrelated.
2.5.3 Results of VAR Models
Real Estate Sentiment Quotient
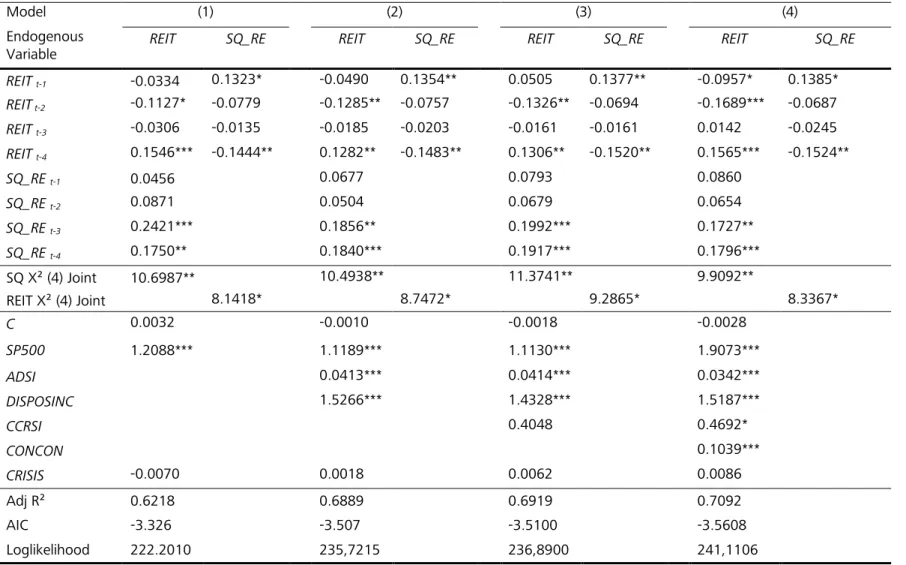
To ensure the comparability of results, a model is developed by controlling for different factors influencing REIT market movements at each pass. The analysis starts with the sentiment quotient, which is calculated by using the real estate dictionary, SQ_RE. Table 2.2 contains the results of the estimated VAR models. The main findings strongly imply a positive relationship between the generated real estate sentiment quotient SQ_RE and future REIT prices, even after controlling for common market factors. Considering the bigger picture, this means that media-expressed sentiment exerts an influence on REIT market movements.
Model (1) analyses the endogenous variables and the general stock market (SP500) as a control variable. Looking at the results, the SQ_RE exerts a statistically significant positive influence on three and four-month-ahead REIT returns. This result is backed by the associated Granger causality, which shows that the SQ_RE influences the REIT return movements, which is not already explained by the past of the REIT itself. In addition, there is a significant relation between lagged REIT returns and current period media sentiment. Hence, the relationship between media sentiment and REIT returns is bi-directional. This is in accordance with the idea, that newspaper articles among others report about past real estate events or performance. It would have been surprising to see the sentiment decoupled from the REIT returns. According to expectations, the past REIT total return values (REITt- 2 and REITt-4) exert an explanatory power on the current values. This is also in line with expectations.
Hence, the results give an inherently consistent overall picture.
Table 2.2: VAR Results – Sentiment Quotient
Model (1) (2) (3) (4)
Endogenous
Variable REIT SQ_RE REIT SQ_RE REIT SQ_RE REIT SQ_RE
REIT t-1 -0.0334 0.1323* -0.0490 0.1354** 0.0505 0.1377** -0.0957* 0.1385*
REIT t-2 -0.1127* -0.0779 -0.1285** -0.0757 -0.1326** -0.0694 -0.1689*** -0.0687
REIT t-3 -0.0306 -0.0135 -0.0185 -0.0203 -0.0161 -0.0161 0.0142 -0.0245
REIT t-4 0.1546*** -0.1444** 0.1282** -0.1483** 0.1306** -0.1520** 0.1565*** -0.1524**
SQ_RE t-1 0.0456 0.0677 0.0793 0.0860
SQ_RE t-2 0.0871 0.0504 0.0679 0.0654
SQ_RE t-3 0.2421*** 0.1856** 0.1992*** 0.1727**
SQ_RE t-4 0.1750** 0.1840*** 0.1917*** 0.1796***
SQ X² (4) Joint 10.6987** 10.4938** 11.3741** 9.9092**
REIT X² (4) Joint 8.1418* 8.7472* 9.2865* 8.3367*
C 0.0032 -0.0010 -0.0018 -0.0028
SP500 1.2088*** 1.1189*** 1.1130*** 1.9073***
ADSI 0.0413*** 0.0414*** 0.0342***
DISPOSINC 1.5266*** 1.4328*** 1.5187***
CCRSI 0.4048 0.4692*
CONCON 0.1039***
CRISIS -0.0070 0.0018 0.0062 0.0086
Adj R² 0.6218 0.6889 0.6919 0.7092
AIC -3.326 -3.507 -3.5100 -3.5608
Loglikelihood 222.2010 235,7215 236,8900 241,1106
Notes: This table shows the coefficients of the estimated VAR models (1) - (4) with 4 lags. The lag length was based on AIC, BC and HQ criterion. REIT is the NAREIT All Equity total return index. SQ is the Sentiment Quotient. RE stands for the usage of the real estate dictionary. ADSI and CCRSI are included with a second lag, DISPOSINC with fourth and CONCON with a first lag. The regression is based on 127 observations from January 2005 to December 2015 on a monthly basis. * denotes significance at the 10% level, ** at the 5% level and *** at the 1% level. Furthermore, granger causality x² with its p-
probability is given.
Extending the model with control variables for the general economy, adding the ADSI and the DISPOSINC, delivers consistent results (model 2). Lags 3 and 4 of the SQ_RE remain statically significant at the 5% level and the Granger causality is significant at a 5% level as well. Due to REIT specific characteristics, the paper next controls for the direct real estate market by subsequently including CCRSI COMM in the model (3). The results hold at a 1% significance level of the SQ_REt-3
and SQ_REt-4. Finally, the inclusion of a measure for consumer optimism or pessimism CONCON does not render the SQ_RE insignificant. Model (4) is subsequently referred to in this paper as the main model. The R-squared of 74.15% and the adjusted R-squared of 70.92% suggest that the main model is well specified. The SQ_RE exhibits in all models (1) – (4) a significant Granger causality at a 5% level. Likewise, the REIT returns granger-cause the media sentiment measure at a 10%
significance level in all model variations. That gives further proof of a robust relationship. In conclusion, the above findings confirm Hypothesis 1 of a positive influence of the created real estate news sentiment on future REIT prices. The results are consistent, independently of the order the control variables are included in the model. An improvement in the goodness of fit is reported with the adjusted R-squared increasing by including the control variables in Model (1) to (4). The evidence found, shows that the created media sentiment measure contains not only information already incorporated into prices or the control variables; otherwise the SQ_RE would not significantly explain REIT returns. Taken together, sentiment extracted from newspaper articles enhances information about REIT market movements.
A possible explanation for the time reference found, could be the opinion formation process. In other words, the opinion of an individual might not change by simply reading one article containing positive or negative sentiment about a specific topic. It can be assumed that it takes some time, and further information, until an individual changes his/her opinion about a certain topic. In addition, the reaction capability of REIT managers is bound to the real estate asset-specific transaction period.
Hence, the underlying asset allocation of REITs cannot be adapted right away. Another explanation is the statement from Devos et al. (2013), that traditionally, institutional investors which hold an increasing share of REITs, are both long-term and passive investors.
Furthermore, the findings contribute to answering the question in REIT analysis ‘do REITs behave more like real estate or equity investments?’, as investigated by Sebastian and Schaetz (2009), Hoesli and Moreno (2007) and Wang et al. (1995) among others. More precisely, the results of this paper are consistent with Morawski et al. (2008), who found interdependencies between REITs and the direct real estate market over the long-run. Accordingly, Wang et al. (1995) found REIT stocks to have a significantly smaller turnover ratio, less financial analyst coverage and to receive less attention from institutional investors.