Schriften
zu Immobilienökonomie und Immobilienrecht
Herausgeber:
IREIBS International Real Estate Business School
Prof. Dr. Sven Bienert
Prof. Dr. Stephan Bone-Winkel Prof. Dr. Kristof Dascher Prof. Dr. Dr. Herbert Grziwotz Prof. Dr. Tobias Just
Prof. Gabriel Lee, Ph. D.
Prof. Dr. Kurt Klein
Prof. Dr. Jürgen Kühling, LL.M.
Prof. Dr. Gerit Mannsen
Prof. Dr. Dr. h.c. Joachim Möller Prof. Dr. Karl-Werner Schulte HonRICS Prof. Dr. Wolfgang Schäfers
Prof. Dr. Steffen Sebastian Prof. Dr. Wolfgang Servatius Prof. Dr. Frank Stellmann Prof. Dr. Martin Wentz
Band 89
Sebastian Schnejdar
Liquidity Transformation Risk: An Investigation of German Open-End Real Estate Funds
Sebastian Schnejdar
Liquidity Transformation Risk: An Investigation of German Open-End Real Es- tate Funds
Liquidity Transformation Risk: An Investigation of German Open-End Real Estate Funds Regensburg: Universitätsbibliothek Regensburg 2018
(Schriften zu Immobilienökonomie und Immobilienrecht; Bd. 89) Zugl.: Regensburg, Univ. Regensburg, Diss., 2018
ISBN 978-3-88246-401-6
ISBN 978-3-88246-401-6
© IRE|BS International Real Estate Business School, Universität Regensburg Verlag: Universitätsbibliothek Regensburg, Regensburg 2018
Zugleich: Dissertation zur Erlangung des Grades eines Doktors der Wirtschaftswissenschaften, ein- gereicht an der Fakultät für Wirtschaftswissenschaften der Universität Regensburg
Tag der mündlichen Prüfung: 10. Juli 2018 Berichterstatter: Prof. Dr. Steffen Sebastian
Prof. Dr. Klaus Röder
greatly appreciated their always helpful advice.
Moreover, I would also like to thank my other co-authors Michael Heinrich, and René- Ojas Woltering for their hard work on our joint research projects.
At last I am deeply grateful to my wife Elizaveta and to my family for their strong encour- agement.
2.2 The German Open-End Fund Crisis . . . . 7
2.3 Related Literature and Hypotheses . . . . 9
2.3.1 Fund Run Risk . . . . 10
2.3.2 Economies of Scale and Scope . . . . 11
2.3.3 Industrywide Spillover Effects . . . . 13
2.3.4 Institutional Investors . . . . 14
2.3.5 Control Variables . . . . 14
2.4 Data, Methodology, and Sample Description . . . . 16
2.4.1 Data . . . . 16
2.4.2 Research Design and Variable Definitions . . . . 17
2.4.3 Descriptive Statistics . . . . 20
2.6 Conclusion . . . . 38
3.1 Introduction . . . . 41
3.2 Secondary Market for Open-End Real Estate Funds . . . . 43
3.3 Related Literature and Hypotheses . . . . 49
3.3.1 Economies of Scale and Scope . . . . 49
3.3.2 Fund Management Skills . . . . 50
3.3.3 Open-End Fund Status . . . . 52
3.3.4 Control Variables . . . . 53
3.4 Data, Methodology and Sample Description . . . . 54
3.4.1 Data Sources . . . . 54
3.4.2 Research Design and Variable Definitions . . . . 54
3.4.3 Descriptive Statistics . . . . 57
3.5 Results . . . . 63
3.5.1 Economies of Scale and Scope . . . . 63
3.5.2 Fund Management Skills . . . . 65
3.5.3 Open-End Fund Status . . . . 66
3.5.4 Control Variables . . . . 67
3.6 Conclusion . . . . 68
4.1 Introduction . . . . 69
4.2 The German Open-End Fund Crisis and Regulatory Background . . . . 74
4.3 Related Literature and Hypotheses . . . . 77
4.3.1 Financial Leverage . . . . 78
4.3.2 Conflicts of Interest . . . . 79
4.3.3 Portfolio Quality . . . . 81
4.3.4 Spillover Effects . . . . 81
4.3.5 Sentiment . . . . 82
4.4 Data, Methodology and Sample Description . . . . 83
4.4.1 Data . . . . 83
4.4.2 Research Design and Definition of Variables . . . . 84
4.4.3 Descriptive Statistics . . . . 89
4.5 Results . . . . 94
4.6 Conclusion . . . . 99
2.2 Overview Summary Statistics . . . . 20
2.3 Explaining Fund Closure Probability . . . . 26
2.4 Corr. Matrix: Fund Specifics, Spillover, and Macroeconomic Variables . . 32
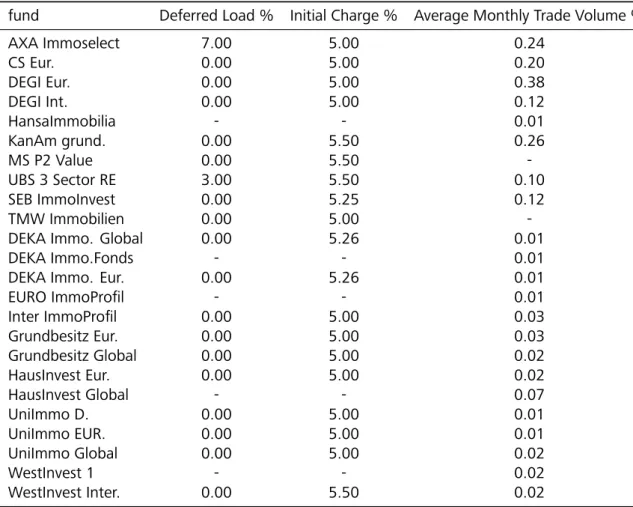
3.1 Overview Secondary Market Fund Fees . . . . 45
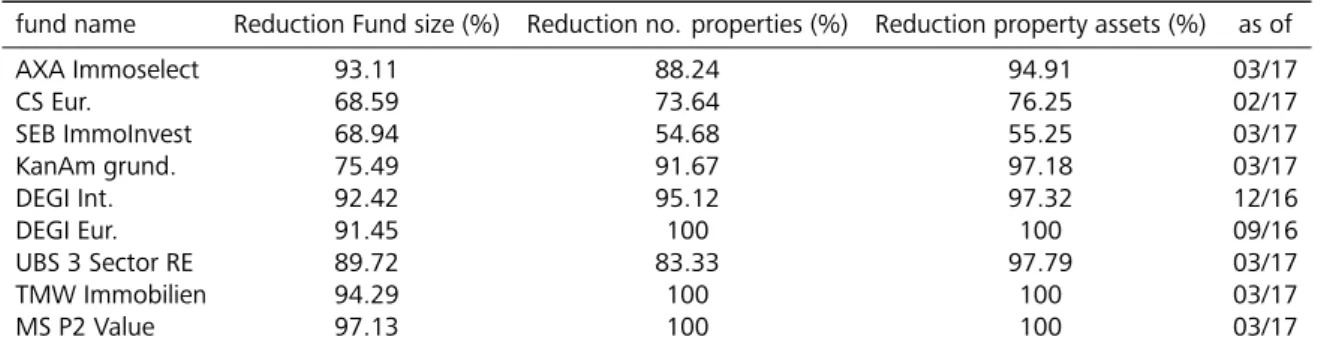
3.2 Liquidation Progress since Closure in October 2008 . . . . 46
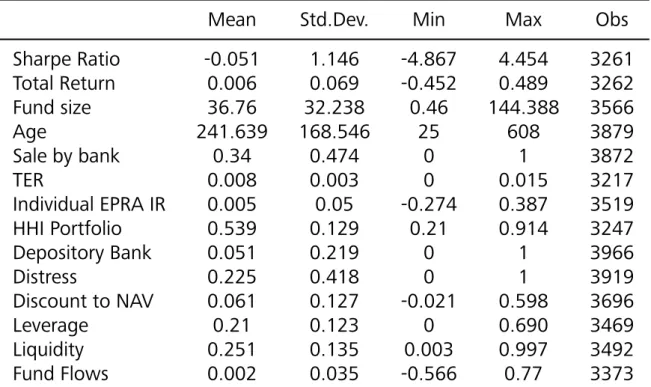
3.3 Overview Summary Statistics . . . . 57
3.4 Corr. Matrix . . . . 61
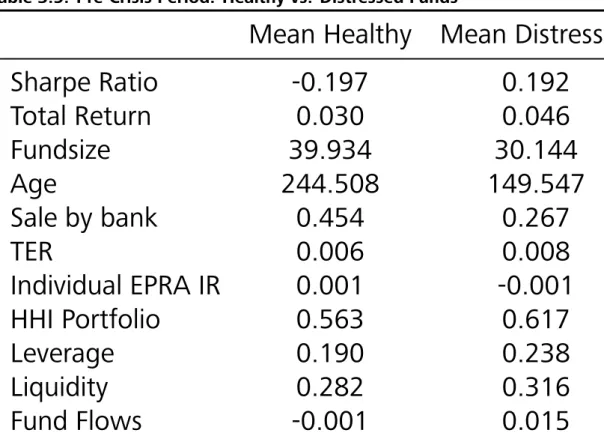
3.5 Pre-Crisis Period: Healthy vs. Distressed Funds . . . . 62
3.6 Explaining Funds‘ Sharpe Ratios (i.e., Risk-adjusted Total Returns) . . . . . 64
4.1 Overview of Distressed Open-End Real Estate Funds . . . . 77
4.2 Overview Summary Statistics . . . . 89
4.3 Corr. Matrix: Fund-Specifics, External Variables, and Control Variables . . 93
4.4 Explaining the Discount to NAV . . . . 95
2.2 Summary Statistics . . . . 21
2.3 Effects of the Liquidity Ratio on the Fund Closure Probability . . . . 27
2.4 Effects of Individual Fund Flows on Fund Closure Probability . . . . 28
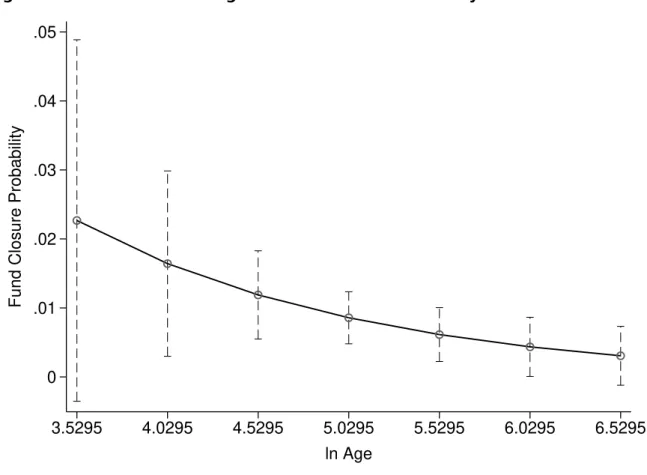
2.5 Effects of Fund Age on Fund Closure Probability . . . . 29
2.6 Effects of the Sale by Bank Variable on Fund Closure Probability . . . . . 30
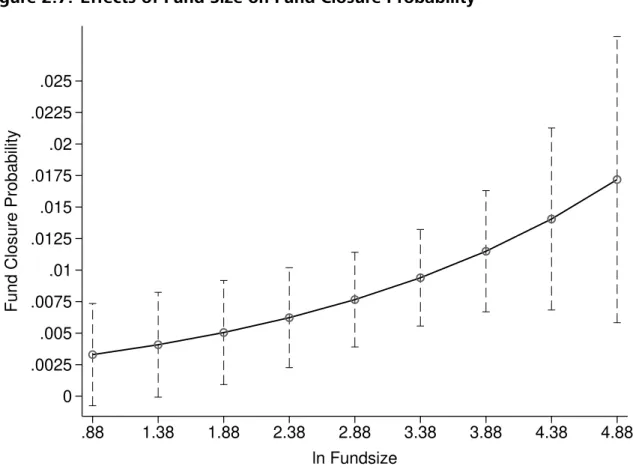
2.7 Effects of Fund Size on Fund Closure Probability . . . . 31
2.8 Effects of the Number of Fund Closures on Fund Closure Probability . . . 33
2.9 Effects of the Share of Institutional Investors on Fund Closure Probability 34 2.10 The Predicted Fund Closure Probability of Distressed Funds I . . . . 36
2.11 The Predicted Fund Closure Probability of Distressed Funds II . . . . 36
2.12 The Predicted Fund Closure Probability of Healthy Funds I . . . . 37
2.13 The Predicted Fund Closure Probability of Healthy Funds II . . . . 37
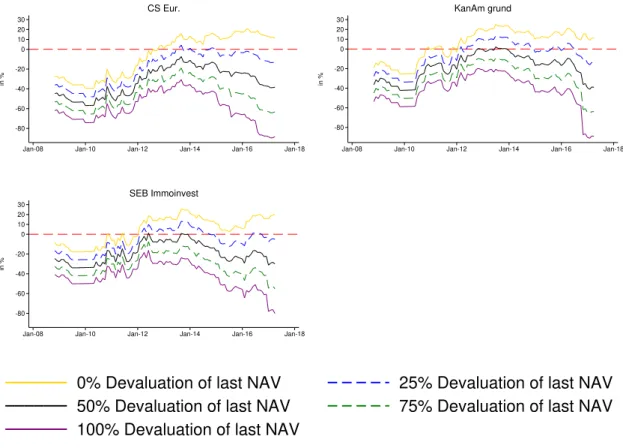
3.1 Total Return Potential for New Fund Investors I . . . . 47
3.2 Total Return Potential for New Fund Investors II . . . . 48
4.2 Discount to NAV . . . . 72
4.3 Overview Open-Ended Fund Crisis . . . . 76
4.4 Discount to NAV, Fund Specifics, External and Control Variables . . . . . 91
4.5 Development of Time Dummies . . . . 98
reasonable wish, since real estate investors gain substantial, relative stable returns from their direct real estate assets due to rental income or the saving of own rental costs in case of owner-occupied property. Especially in current times of historical low interest rates, an investment in direct real estate seems to be even more favorable, when comparing real estate returns to capital market returns. Real estate asset returns are also considered to show less volatility compared to stocks. The stock market‘s volatility is one reason for the common German mistrust in the secondary market.
In addition, direct real estate provides a considerable inflation protection due to an gen- eral increase in property values in response to inflationary pressures and index lease agree- ments. This inflation protection is of special importance for German investors, since the accruing hyperinflation in succession of the Great Depression of 1923 was a trauma for the German society and, therefore, fear of inflation became a commonplace in Germans collective memory.
As a consequence, home ownership is generally considered as a conservative, prefer- able investment opportunity and serves for numerous people as a central part of their retirement planning.
Nevertheless, direct real estate investments also exhibit considerable risks. For most pri-
vate investors the purchase of a house or an apartment is a one-in-a-lifetime decision.
These investors get into debt to purchase real estate to an extent, which exceed their current overall fortune. This considerable lot size risk is especially true for direct real es- tate investments in Germany‘s “Big 7” cities, which show a tremendous increase in real estate prices in the last decade. Moreover, due to large lot sizes, the construction of a diversified direct real estate portfolio for private investors is unfeasible. Therefore, direct real estate investments additionally contain a considerable cluster risk.
One preferable investment opportunity for German investors, which are not willing to participate in the stock market, and seek to avoid the addressed risks of direct real estate are German open-end real estate funds. Investors of these listed indirect real estate invest- ments are able to purchase fund shares for a minimum investment amount per share from EUR 40 to EUR 100, which eliminates the lot size risk.1 For this minimum amount, fund investors are able to participate on the advantages of direct real estate. Fund investors also avoid the risk of insolvency associated with excessive property loans. Investors ad- ditionally benefit from the fund managements‘s portfolio diversification, since open-end real estate funds invest their capital worldwide and across different asset classes.
Moreover, German open-end real estate funds also provide a liquidity transformation for investors. For decades, these funds gave their investors the opportunity to constantly redeem fund shares, while most of the capital is invested in long-term real estate assets.
As a consequence of these several advantages, open-end real estate fund are very popular in Germany, with invested capital of about EUR 171 billion (as of June 2017).
Nonetheless, this provided liquidity transformation bear the risk of a fund closure. In succession of the global financial crisis, starting in October 2008, ten open-end real estate retail funds, which represent 25% to 30% of the entire asset class, had to close due to liquidity squeezes.2 Later on, these funds were also forced to liquidate their real estate portfolio.
1Mitropoulos (2017).
2The share depends considering either all funds, which are officially addressed as open-end real estate retail funds or “actual” retail funds, which exhibit a minimum investment amount below EUR 10.000.
thesis is designed to reduce the uncertainty of all market participants about an investment in German open-end real estate funds, and especially about the funds liquidation process.
Accounting for the past helps to lower current uncertainty and, therefore, lead to a more stable market environment in case of future fund crises. This task is of special importance for German real estate retail investors, since these investors highly favor low volatility.
The present thesis is divided into three single studies (Chapter 2 to Chapter 4), which focus respectively on specific topics associated with the German open-end real estate fund crisis.
At first, it is of particular interest to derive the determinants of fund closures to answer the question why some funds were forced to close in succession of the global financial crisis, while others, which are exposed to the same market environment, remain unaffected. It becomes apparent that funds capital inflows, as well as larger liquidity ratios diminish fund closure probability. Moreover, funds immanent economies of scale and scope also show a decreasing effect on fund closure risk. In contrast, external spillover effects caused by other open-end real estate fund closures, as well as a greater share of institutional fund investors increase a funds closure probability.
A further step to diminish investors uncertainty, is to analyze the influential factors on fund performance, and the secondary market conditions, especially for distressed fund shares. It shows that emerging discounts to net asset value (NAV) on the secondary mar- ket for distressed funds, decrease fund performance due to fund managements loss in bargaining power in the selling process and due to pressure from current fund investors.
These discounts to NAV are also a measure for the level of investors uncertainty about the liquidation process in general, as well as about the current real estate asset valua- tion. Beside the influence on fund closure risk, funds economies of scale and scope also positively affects fund performance.
Since, the discount to NAV play a key role to work through this open-end fund crisis, it is reasonable to analyze, at last, which internal (i.e., fund-specific) and external factors
influence the price reduction for fund shares on the secondary market. It became ap- parent that funds leverage ratio increase discounts to NAV, while a large liquidity ratio diminish them. Moreover, the discount to NAV depends on conflicts of interest between current fund investors and fund management. Besides these fund-specific factors, NAV discounts are also driven by spillover effects from the announcement of other fund liqui- dations, and by investor sentiment. This sentiment influence is proxied by the aggregate level of overall capital flows into the fund industry and by the degree of macroeconomic uncertainty.
Summarizing, all considered topics, which are associated with the German open-end real estate fund crisis, exhibit a significant influence of external, predominantly uncertainty- related, factors.
In succession of this serious fund crisis, there was also a large debate how to change the legal environment for open-end real estate funds to avoid future fund closures. Sub- sequently, the investment law was amended several times. To account for this legal changes, we additionally test the effect of the legal environment (i.e., selling restrictions for the real estate assets in times of closure) for German open-end real estate funds by including dummy variables indicating the current selling restriction in all three parts of this thesis. Nevertheless, we find no significant influence of law enforced selling restrictions on funds closure probability, performance, or discount to NAV.
With invested capital of EUR 145 billion, the German open-end real estate fund industry is the predominant indirect German real estate investment vehicle and the largest market for open-end real estate funds worldwide.1
Investors in open-end real estate funds trade with the fund’s investment company, which sells and redeems shares at net asset value (NAV) on a regular basis. The open-end structure is associated with considerable “bank run” risk (i.e., fund run risk), because of the long-term direct real estate investments and daily share redemptions (Bannier et al.
(2008); Weistroffer and Sebastian (2015); Fecht and Wedow (2014)). Therefore, German regulation demands a minimum liquidity reserve of 5% of a fund’s NAV. In practice, aver- age liquidity ratios range from 20%-30% (see Downs et al. (2017)). Nevertheless, these liquidity ratios occasionally prove insufficient, especially during times of high volatility.
1Downs et al. (2016).
The German open-end fund industry was hit severely in the aftermath of the global finan- cial crisis. Starting in October 2008, ten public German open-end real estate funds with total assets under management of about EUR 28 billion were forced to suspend share redemption.2
We use a panel logit model to explain fund closure probability. Our empirical study is based on a monthly panel dataset that consists of twenty-four open-end German real estate retail funds, and which covers all closure events in the history of the asset class.3 We find that fund closure probability increases with increasing fund run risk, which is represented by a fund‘s liquidity ratio and net capital inflows. Economies of scale and scope, proxied by fund size, age, and the presence of a distribution network for fund shares, help prevent fund closures. Moreover, we find evidence that industrywide spillover effects from the closure of other open-end real estate funds tend to increase fund closure probability. Lastly, we find evidence that a larger share of institutional investors increases fund closure probability.
Identifying fund closure determinants helps diminish uncertainty about the overall asset class, while restoring trust in the remaining funds.
The most recent example of a fund crisis was the massive share redemptions from U.K.
open-end real estate funds that took place in the aftermath of the Brexit referendum on June 23, 2016. Seven public open-end funds from the U.K. closed, which represented one-half the total assets under management of the U.K. market.4 Hence, open-end fund participants in foreign countries like the U.K. could learn from the German experience.
The study is structured as follows. The next section (Section 2.2) gives an overview of the German open-end fund crisis. Section 2.3 describes the used variables, which are mainly
2The regulatory regime was modified in succession of the fund crisis. Nevertheless, our analysis is unaffected by those changes, since fund closure events occurred under the prior investment law (InvG, effective from January 1, 2004-July 22, 2013).
3In our sample, we focus on retail funds. We exclude semi-institutional funds, which are primarily intended for institutional investors. Semi-institutional funds are legally classified as retail funds, but the minimum investment ranges from EUR 10,000 to EUR 1 million.
4M&G Property Portfolio, Henderson UK Property PAIF, Standard Life UK Real Estate Fund, Aviva Investors Property Trust, Columbia Threadneedle UK Property Authorised Investment Fund (PAIF), Canada Life UK Property Fund, and Aberdeen UK Property Fund.
derived from the existing literature of business failure prediction models. Section 2.4 illustrates the dataset, while the regression results are presented in section 2.5. The last section exhibits our conclusion.
German open-end real estate funds are required by law to close (i.e., suspend share re- demptions) if liquidity ratios fall below 5%. A shortfall in the fund liquidity ratio is very serious because open-end real estate funds are obliged to sell their real estate assets in the aftermath of their closure without a discount to the last appraisal value. Closed funds must sell sufficient assets to raise their cash reserves and fulfill share redemptions (i.e., reopen).
After a twenty-four-month period, funds are forced to sell off their entire real estate portfolios and pay out the proceeds to investors. However, selling properties during times of market turmoil, especially in the first months of closure, is almost impossible. Hence, all the funds that closed in October 2008 were ultimately forced to liquidate after the twenty-four-month period. Nevertheless, seven of these funds reopened subsequent to their first close in October 2008, but all were forced to close for good for a second time.
Figure 2.1 shows the size of closed German open-end real estate funds (grey bars), as well as the size of funds in liquidation (dark grey bars). The graph also illustrates the size of fund reopenings (black bars). During the first fund crisis in 2005/2006, two open-end real estate retail funds with total fund volume of EUR 8 billion, closed. These closures were caused by short-term uncertainty about the funds’ property valuations. After a short pe- riod of time, both funds reopened. The second, and larger, crisis began in October 2008, with the closure of ten funds, with assets under management of about EUR 28 billion. The reopening of several funds over the following twelve months suggested an upward trend.
Nevertheless all of these funds were forced to close again. As of May 2010, the total fund size of distressed funds was equal to earlier levels of around EUR 27 billion. Following
0 10 20 30
Assets under Management in billion Euro 10-2005
04-2006
10-2006
04-2007
10-2007
04-2008
10-2008
04-2009
10-2009
04-2010
10-2010
04-2011
10-2011
04-2012
10-2012
04-2013
10-2013
04-2014
10-2014
04-2015
10-2015
04-2016
Liquidation Reopened
Closed
This figure shows the total fund size of German open-end real estate funds that either suspended share redemptions (grey bars) or were already in the process of fund liquidation (dark grey bars). The graph also indicates the total fund size of reopenings (black bars).
the first fund liquidation announcement in October 2010, and through August 2012, all previously closed funds were forced to announce their liquidations. The decreasing fund size over the sample period, as shown in Figure 2.1, is due to two primary effects: 1) The proceeds from distressed funds’ sold properties were distributed to investors, and 2) a decrease in property appraisal values. As of June 2016, about EUR 10 billion of invested capital remained inaccessible to investors.
Table 2.1 gives a clear overview of the fund closure and liquidation dates.5
5The HansaImmobilia fund was ultimately forced to close and liquidate in 2012 without a twenty-four- month closing period. Furthermore, the UniImmo global fund closed in 2011 for three months due to uncertainty about its Japanese property reappraisals following the Tohoku earthquake. The UniImmo global fund was able to reopen.
fund 1. crisis 2. crisis last closure notice liquidation
AXA Immoselect - 10/08 - 08/09 11/09 10/11
CS Eur. - 10/08 - 06/09 05/10 05/12
DEGI Eur. - 10/08 10/08 10/10
DEGI Int. - 10/08 - 01/09 11/09 10/11
HansaImmobilia - - 10/12 10/12
KanAm Grund. 01/06 - 03/06 10/08 - 07/09 05/10 03/12
MS P2 Value - 10/08 10/08 10/10
UBS 3 Sector RE - 10/08 - 10/09 10/10 09/12
SEB ImmoInvest - 10/08 - 06/09 05/10 05/12
TMW Immobilien - 10/08 - 10/09 02/10 05/11
DEKA Immo. Global - - - -
DEKA Immo.Fonds - - - -
DEKA Immo. Eur. - - - -
EURO ImmoProfil - - - -
Inter ImmoProfil - - - -
Grundbesitz Eur. 12/05 - 03/06 - - -
Grundbesitz Global - - - -
HausInvest Eur. - - - -
HausInvest Global - - - -
UniImmo D. - - - -
UniImmo EUR. - - - -
UniImmo Global - 03/11 - 06/11 - -
WestInvest 1 - - - -
WestInvest Inter. - - - -
This table provides an overview of all open-end real estate retail funds. It gives the date of the first closure of each fund during the first fund crisis in 2005/2006. Nine funds closed in the second fund crisis in October 2008; seven of these reopened for a certain period of time. Those funds show a second closing date. After twenty-four months of closing, all nine funds were required to announce their liquidations. Column 5 gives the liquidation date.
Our theoretical framework on fund closures is based on the literature on business failures.
Business failure prediction models generally focus on identifying an imminent financial crisis by predicting individual firm insolvencies. Several firm bankruptcies can cause con- siderable negative economic effects (i.e., high unemployment rates and reduced stability of the financial market in case of bank failures). Kupiec and Ramirez (2013) find that U.S.
bank insolvencies cause a significant drop in the overall economic development in the 1900 to 1930 period. Because of the importance of these issues, the literature on failure prediction models covers a plethora of scientific work over the past fifty years, beginning with Beaver (1966). Following Balcaen and Ooghe (2006), Zavgren (1985), Sheppard
(1994), Zmijewski (1984), Swanson and Tybout (1988), and Becchetti and Sierra (2003), we focus on conditional probability models, especially logit models. Zhao (2004) for ex- ample apply a logit model to derive the determinants of fund closings for U.S. open-end mutual funds in the 1992 to 2001 period.
One common problem of failure prediction models is that the balance sheet items are inconsistently defined. However, the fund-specific variables are regulated by law, so they are identically defined for all funds. Real estate fund closures are therefore somewhat predestined for use in failure predicting models.
According to Balcaen and Ooghe (2006), another important problem is how to precisely define failure. Most studies use a change in corporate legal status as the definition of a failure, although the closure of a fund does not immediately imply a loss for investors.
Nevertheless, at the time of closure, the open-end fund structure dissolves, which does change the intrinsic nature of the fund. Therefore, we use the legal event of “fund clo- sure” to mean failure in an effort to avoid the problem of poorly defining the dichotomy of the dependent variable.
Failing to capture corporate failures in a sample time period is another issue for failure prediction models. As a result, we find that the corporate qualities that may lead to a subsequent failure are assigned to the group of non-failing individuals. Moreover, most studies on failure prediction are non-random regarding particular industries or size classes.
To avoid a distortion, we include the entire relevant time frame, including all fund closures independent of age, size, or investment focus.6
Whenever fund investors observe increasing share redemptions that threaten to exceed a fund‘s liquidity ratios, they have an incentive to redeem their own shares. In the worst case, this “vicious cycle” leads to a fund closure. The mechanism is similar to a bank run, and is a serious shortfall of the open-end structure. Therefore, sufficiently large liquidity
6Balcaen and Ooghe (2006).
ratios are required. During times of economic uncertainty, this safety buffer can diminish the harmful impact of share redemptions.
Hill et al. (2011) find that a higher liquidity ratio, calculated as cash to total assets, leads to a lower probability of business failure. Gilbert et al. (1990) study the bankruptcies of seventy-six U.S. firms from 1974 through 1983, and find that larger liquidity ratios decrease the probability of a bankruptcy. Therefore, we expect a negative relationship between liquidity ratio and closure probability.
Large capital outflows that exceed a fund‘s cash reserves generally lead to fund closure.
Individual fund net flows can be a consequence of poor fundamentals, such as, e.g., low liquidity ratios, high leverage ratios, or excessive management fees. If investors lose trust in their investments, they may opt to redeem shares.
On the other hand, fund net flows could affect fund closure probability independent of fund-specific variables. Bannier et al. (2008), for example, find that investors redeem shares only because of expected share redemptions by other investors. Those expecta- tions could be a result of reported capital outflows, which by themselves do not allow for any direct conclusions about a fund‘s economic situation. Therefore, capital outflows may be a crucial element of a “self-fulfilling prophecy” that leads to fund closures. Hence, individual fund net flows could serve as an additional proxy for fund run risk.
The potential impact of a fund run leads us to Hypothesis 1:
.
According to Laitinen (1992), Hill et al. (2011), and Assadian and Ford (1997), corporate size plays an important explanatory role in business failures. Size is a proxy for potential economies of scale and scope, as well as for learning effects. Hence, larger companies should exhibit lower failure probability.7 Moreover, large open-end real estate funds that
7Hill et al. (2011).
show significant growth in prior periods are more likely to attract different, and therefore sufficiently uncorrelated, target groups. In contrast, smaller funds are more likely to de- pend on only a few investors. On the contrary, Laitinen (1992) finds that newly founded and fast growing companies (i.e., growth in net sales) that exhibit high leverage ratios also tend to exhibit higher bankruptcy risk. Moreover, Assadian and Ford‘s (1997) study on U.S. corporate bankruptcies from 1964 through 1991 finds that larger firms exhibit a higher probability of failure.
Although the literature is generally ambivalent about the sign of the influence on firm size, we include fund size as an additional explanatory factor. We suspect that the diminishing effect of size due to economies of scale and scope is dominant over the increasing effect of rapid growth on closure probability. Hence, we expect a negative overall influence of fund size on closure probability.
Company age is also a significant factor in business failures.8 Young companies have a higher probability of failure than older ones. Analyzing Canadian corporate bankruptcies in 1996, Thornhill and Amit (2003) state that age indicates economies of scope in the organizational process. Therefore, we include fund age as a further fund-specific variable.
We note that eight of the twenty-four open-end real estate funds belong to large German banks.9 Fund shares are sold by the retail distribution networks of these banks, which are actively advertised by bank advisors. Therefore, bank-owned funds have direct access to a plethora of bank customers. In addition, the purchase of open-end real estate fund shares is often part of clients’ pension provision solutions, which are directly sold by the fund‘s sponsor (bank). Therefore, these funds have a wider target group and larger economies of scope than funds without such a distribution network.
Maurer et al. (2004) state that fund sponsors can buy a sufficient amount of their own fund shares during times of high share redemptions to stabilize liquidity ratios. Hence, the financial power of the fund sponsor may serve as an additional element to prevent
8Thornhill and Amit (2003).
9Hausinvest funds, DEGI funds, Grundbesitz funds, DEKA funds.
fund closures.10 The open-end real estate funds that use a distribution network belong to the largest German banks and financial syndicates. Hence, we use the existence of a distribution network as an additional proxy for economies of scale and scope. The possible influence of economies of scale and scope are the basis of our second hypothesis:
.
Although fund specifics are suitable to describe a fund‘s economic situation, Zavgren (1985) and Maltz et al. (2003) find they are not sufficient to fully explain the probability of fund closure.
According to Aharony and Swary (1983) large-scale bank insolvencies lower the stock market value of the remaining solvent banks. Moreover, Bannier et al. (2008) analyze the first German open-end fund crisis in 2005/2006, and find that the closure of a partic- ular fund can result in significant contagion effects to the overall industry. Closed funds could be forced to sell assets to reopen again, or, in the case of a subsequent liquidation, must sell their entire portfolio. Because total assets under management often amount to several billion euros, fire sales could lead to lower real estate prices for a fund‘s portfolio properties. Furthermore, open-end real estate funds often share the same investment focus (e.g., asset class, investment volume, country share), so a significant price drop could affect the overall property prices of the remaining funds. These funds sell parts of their real estate properties on a regular basis, and, therefore, could be directly affected by lower overall property prices, especially during liquidity shortages.
Our third hypothesis accounts for these potential negative externalities.
.
10However, in December 2005, when the Grundbesitz investment fund experienced a liquidity shortage, Bannier et al. (2008) note that the fund sponsor Deutsche Bank was not willing to pay for its “own” fund shares.
On average, 98% of all fund shares are held by retail investors. Thus, our research design focuses solely on retail funds. Nevertheless, some funds have a considerably larger share of institutional investors than others (the range is typically from 0% to 30%). These professionals exploit stable, valuation-based fund returns, and regard them as a high- yielding alternative to money market investments.
Prior to the crisis, when interest rates were low, institutional investors used the open-end fund structure to “park” their capital in higher-yielding open-end real estate funds. As the crisis deepened, professionals have to decide if their investment in open-end real estate funds is still favorable regarding the current risk-return profile. In consequence, they could even be forced to sell their shares, which could come as a surprise to the remaining retail investors. This effect increases with the share of professional investors.
According to Larrain et al. (2017), legal restrictions for pension funds led to distressed sales of Chilean stock holdings, which caused a significant higher loss for these stocks than for others. Hence, retail investors should consider the prevailing blockholder risk, which could create additional selling pressure and decrease a fund‘s liquidity ratios. Our fourth hypothesis reflects the risk associated with potentially fast-moving “smart money.”
- .
V
Our control variables include management costs as an additional fund-specific factor.
Fund investors, as well as potential new investors, may consider management fees as too high, which could lead to selling pressure or a lack of inflows. In particular, we use the fund-specific total expense ratio (TER), and we expect an increasing effect on fund closure probability.
We also control for funds‘ annual total returns as a measure of fund performance. While
large returns indicate funds high quality, there is also the possibility, especially in times of financial crisis, that these funds did not fully reappraise their portfolio to current, hence lower, values. This uncertainty about the current valuation could increase the funds clo- sure probability.
Total return also includes the entire history of dividend fund payouts. Flagg et al. (1991) use COMPUSTAT data for the 1975-1981 time frame, and find that the reduction of divi- dends is a significant predictor of business failure.11 We expect funds with higher dividend payouts to exhibit a lower closure probability.
Hill et al. (2011), Dimitras et al. (1996), and Zavgren (1985) find that a higher ratio of total liabilities to total assets increases the probability of bankruptcy. Therefore, we use funds’ leverage ratios as an additional control variable affecting the probability of fund closure, and we expect a positive sign.
To strengthen our regression results, we also control for the macroeconomic environment by considering macroeconomic uncertainty and the returns of competing asset classes.
The macroeconomic development of the national economy, especially during downturns, has a significant impact on business failure probability.12 We use two popular uncertainty indices to control for macroeconomic influence. First, the Policy Uncertainty Index Europe from Baker et al. (2017) for macroeconomic uncertainty. Moreover, we use one of sev- eral implied volatility indices (shortened VIX), which are widely used to account for stock market uncertainty (e.g., Bekaert et al. (2013)). In detail, we use the VIX Europe volatil- ity index based on the Eurostoxx 50. Ben-Rephael (2017) use a similar implied volatility index based on the S&P100 as a measure of uncertainty in his study to test the impact of uncertainty on fund management decision to sell assets in U.S. equity mutual funds from 1986 to 2009.
According to Zavgren (1983), higher interest rates can strongly affect bankruptcy rates.
Moreover, Swanson and Tybout (1988) identify the interest rate as one of the two most important explanatory factors for business failures. Hence, we control for the external
11Flagg et al. (1991).
12Bhattacharjee et al. (2009).
environment by using the one-year German government bond yield to account for the German interest rate level, and the dividend yield of the German blue-chip stock market index (DAX30) to control for the return potential of the competing stock market. We also control for the development of the fund’s target real estate markets by using the country-specific EPRA total return.
We use a panel logit framework to analyze fund closure probability for twenty-four open- end real estate funds over a 167-month period from August 2002 through June 2016.
These twenty-four funds represent the population of both distressed and healthy open- end German real estate retail funds. Ten of the twenty-four funds were issued in the 2000s, five after August 2002. Therefore, our dataset begins in August 2002 in order to ensure a strongly balanced panel framework. Note further that a new investment law (InvG) was decided on in January 2002, based on an EU directive. This new regime had a significant effect on the legal environment for open-end real estate funds. The use of annual accounting information is also common in failure prediction models.13 Hence, our data consists of monthly, semiannual, and annual fund reports provided by individ- ual fund management to estimate the impact of fund-specific variables such as liquidity, leverage, and management fees on closure probability.14 Furthermore, we use data about professional investors from MorningStar Direct.
13See, e.g., Balcaen and Ooghe (2006) and Dimitras et al. (1996).
14Asset Management Deutschland, AXA Investment Managers Deutschland, Credit Suisse, KanAm Grund Kapitalanlagegesellschaft, Morgan Stanley Real Estate Investing, Pramerica Property Investment, SEB As- set Management, UBS Real Estate.
V fi
Our key variable of interest is the closure probability of fund at the end of month , which is calculated as a 0/1 indicator variable. In a fund closure month, the dummy variable is set to 1. In the following month, the distressed fund is excluded from the panel regression model. Hence, the closure events are captured solely in the panel logit framework.
For the purposes of our empirical tests, we estimate the following panel regression model:
Closurei,t =α+β1 Liquidityi,t−1+β2 Individual F und F lowsi,t +β3 ln F und Sizei,t−1 +β4 ln Agei,t +β5 Sale by banki,t
+β6 T ERi,t−1 +β7 T otal Returni,t−1+β8 ∆Leveragei,t−1
+β9 Institutionali,t−1+β10F und Closurei,t
+β11P olicy U ncertainty Index Europei,t+β12V IX Europei,t
+β13German Bond1Yi,t+β14 DAX 30Dividend Y ieldi,t +β15Individual EP RA T Ri,t +vi,t
(2.1)
Our regression results are estimated using a panel logit model with heteroscedasticity robust standard errors.
Since the provided fund-specific data is published with a significant time lag, we include a one-month time lag for these variables. In contrast, the individual fund flow variable, age, sale by bank, fund closure indicators, uncertainty indicators, and macroeconomic control indicators, are included without any time lag.
Due to the large assets under management of open-end real estate funds, a closure of one or more of these funds will be recognized by both institutional, as well as retail investors. As a consequence, fund investors will adjust their fund investment strategy within one month after the closure event occurs. The current market uncertainty and economic situation are also known by investors at present day. Hence, we do not include any time lag for the variables.
We use the following two variables as proxies for fund run risk.
denotes the liquidity ratio, which is calculated as the ratio of a fund‘s cash re- serves to gross asset value (GAV).
denotes capital net flows into the specific open-end real estate fund. This variable is calculated as the monthly percentage change of net capital fund flows proportional to the respective fund size.
We use three variables to test for the impact of economies of scale and scope on fund closure probability.
is the overall logarithmic fund volume measured in billions of euros.
represents the logarithmic monthly fund age.
is a 0/1 indicator variable that is set to 1 if the shares of a particular fund are sold by the distribution network of the fund sponsor (bank).
We proxy for the effect of potential spillover effects on fund closure probability by using the closure announcements of other funds.
is a counting variable that captures the effect of other fund closure an- nouncements. Thus, we test for the impact of industrywide spillover effects.
We also test for a relationship between the share of institutional investors and fund clo- sure probability.
represents the percentage share of institutional fund investors. It is calcu- lated as the ratio of a fund’s market value held by institutional shareholders to its overall market value.
We use the following fund-specific control variables.
represents the annual management costs, calculated in percentage of the overall fund size.
denotes annual NAV performance measured as the percentage change in net asset value. Total Return also includes all extraordinary payouts, which are defined as total fund-specific payouts in a given month relative to a fund’s NAV.
is the absolute difference (∆) of the fund’s debt compared to its GAV. In detail,
we use the first differences of the leverage ratio to correct for non-stationarity.
Furthermore, we use the general macroeconomic environment to validate our estimation results. First, we include two variables for market uncertainty. Second, we consider the impact of bond and stock market returns as alternative investments. We also control for the country-specific market return of the fund’s target markets.
P is a measurement of overall political uncertainty in the European market. In detail, Baker et al. (2017) use major newspapers from several Euro- pean countries and count the number of articles, which include simultaneously the items
“uncertainty”, “economic”, as well as items related to the political situation.15
X is the Euro Stoxx 50 Volatility Index (VSTOXX), which represents our second proxy for macroeconomic uncertainty. The index measures implied stock market risk.
Furthermore, we normalize both indices to make the comparison of the magnitude of both coefficients in the model framework more easier.
1Y illustrates the German interest level for bond investments. The interest rate of short-term German government bonds is considered the benchmark for bond investments. This variable serves as a proxy for the opportunity costs for an investment in open-end real estate funds.
X 30 Y captures the return potential of the German stock market. The DAX 30 consists of the largest thirty companies in Germany. We use the dividend yield instead of stock market performance in order to find a more suitable measure of the return potential of stocks versus fund investments, and bond market returns without speculative gains.
P is calculated as the weighted monthly EPRA total return of a fund’s target real estate market returns. This variable captures the development of the overall real estate markets, and serves as a proxy for the business cycle.
15A full list is available at: www.policyuncertainty.com.
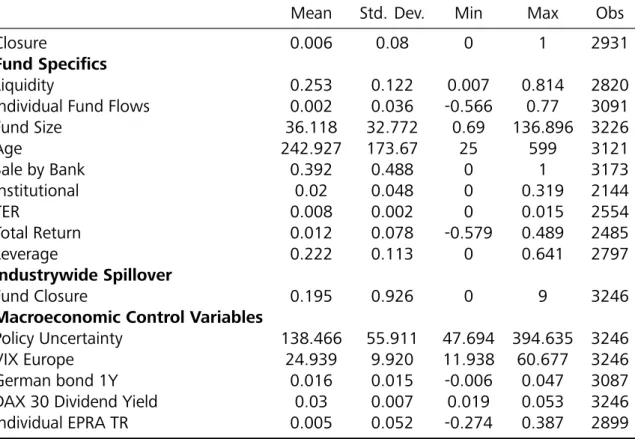
Table 2.2 shows the summary statistics for the explanatory variables.
The liquidity ratios show significant heterogeneity over time as well as across funds. The average liquidity ratio is 25.30%, with a range from 0.7% to 81.4%. Several funds were issued within the sample period. A fund opening is accompanied by a liquidity ratio of almost 100% because the accumulated capital has not yet been invested. Thus, we first consider newly issued funds after a twenty-four-month period. The liquidity ratios increase significantly from 2012 due to the progressing liquidation of ten funds in the dataset that were forced to sell their entire real estate property portfolios and transfer the earnings to investors. Figure 2.2 illustrates the considerable increase in average liquidity ratios due to property sales beginning in Q3 2012.
The funds show average monthly fund flows of about 0.2% relative to respective fund volume. Newly issued funds show strong capital inflows within the first two years, which could distort the regression results (note again that we only include funds if they are
Mean Std. Dev. Min Max Obs
Closure 0.006 0.08 0 1 2931
fi
Liquidity 0.253 0.122 0.007 0.814 2820
Individual Fund Flows 0.002 0.036 -0.566 0.77 3091
Fund Size 36.118 32.772 0.69 136.896 3226
Age 242.927 173.67 25 599 3121
Sale by Bank 0.392 0.488 0 1 3173
Institutional 0.02 0.048 0 0.319 2144
TER 0.008 0.002 0 0.015 2554
Total Return 0.012 0.078 -0.579 0.489 2485
Leverage 0.222 0.113 0 0.641 2797
Fund Closure 0.195 0.926 0 9 3246
V
Policy Uncertainty 138.466 55.911 47.694 394.635 3246
VIX Europe 24.939 9.920 11.938 60.677 3246
German bond 1Y 0.016 0.015 -0.006 0.047 3087
DAX 30 Dividend Yield 0.03 0.007 0.019 0.053 3246
Individual EPRA TR 0.005 0.052 -0.274 0.387 2899
This table provides an overview of the mean, standard deviation, minimum, maximum, and number of observations for all variables.
0 5 1015 20 2530 35 40
in %
Jan-02 Jan-04 Jan-06 Jan-08 Jan-10 Jan-12 Jan-14 Jan-16
Liquidity
-5 0 5 10
in %
Jan-02 Jan-04 Jan-06 Jan-08 Jan-10 Jan-12 Jan-14 Jan-16
Individual Fund Flows
0 10 20 30 40 50
in EUR 100 million
Jan-02 Jan-04 Jan-06 Jan-08 Jan-10 Jan-12 Jan-14 Jan-16
Fundsize
0 .25 .5 .75 1 1.25 1.5
in %
Jan-02 Jan-04 Jan-06 Jan-08 Jan-10 Jan-12 Jan-14 Jan-16
TER
-15 -10 -5 0 5 10
in %
Jan-02 Jan-04 Jan-06 Jan-08 Jan-10 Jan-12 Jan-14 Jan-16
Total Return
0 5 10 1520 25 3035 40
in %
Jan-02 Jan-04 Jan-06 Jan-08 Jan-10 Jan-12 Jan-14 Jan-16
Leverage
0 1 2 3 4 56
in %
Jan-02 Jan-04 Jan-06 Jan-08 Jan-10 Jan-12 Jan-14 Jan-16
Institutional
0 2 4 6 8 10
no. fund closure
Jan-02 Jan-04 Jan-06 Jan-08 Jan-10 Jan-12 Jan-14 Jan-16
Fund Closure
0 100 200 300 400
Index
Jan-02 Jan-04 Jan-06 Jan-08 Jan-10 Jan-12 Jan-14 Jan-16
Policy Uncertainty Index
10 20 30 40 50 60
Index
Jan-02 Jan-04 Jan-06 Jan-08 Jan-10 Jan-12 Jan-14 Jan-16
VIX Europe
0 1 2 3 4 5 6
in %
Jan-02 Jan-04 Jan-06 Jan-08 Jan-10 Jan-12 Jan-14 Jan-16
German Bond 1Y
0 1 2 3 4 5 6
in %
Jan-02 Jan-04 Jan-06 Jan-08 Jan-10 Jan-12 Jan-14 Jan-16
DAX 30 Dividend Yield
-20 -10 0 10 20
in %
Jan-02 Jan-04 Jan-06 Jan-08 Jan-10 Jan-12 Jan-14 Jan-16
Individual EPRA TR
This figure illustrates the average progression of fund-specific, industrywide spillover effects and macroeconomic control variables from 2002:8 through 2016:6.
at least twenty-five months old). Moreover, several funds within the same fund family merged within the sample period.
For example, the WestInvest 1 fund had monthly capital outflows of 100% (purely arith- metical) in October 2009 due to a fund merge with the WestInvest Interselect fund, which had tremendous capital inflows over the same period. For the same reason, the Inter Im- moprofil fund displayed a 248% capital inflow in November 2010. We control for fund merges by excluding these special events from our dataset (n = 5) in order to avoid distor- tions. Subsequently, the Euro ImmoProfil fund now shows the maximum capital inflows of 77.0% at the beginning of 2005, while the Inter ImmoProfil fund has -56.6% capital outflows in October 2009.
Fund size ranges from EUR 69 million to EUR 13.6 billion, with an average size of EUR 3.6 billion and a median of EUR 2.5 billion. Fund size is measured in EUR 100 million. The Deka Immobilien Europa fund is the largest open-end real estate fund, with an average
of EUR 9.87 billion and a maximum of EUR 13.6 billion. In contrast, distressed funds show a significantly negative trend in fund size. For example, the Morgan Stanley P2 value fund had a minimum of only EUR 69 million as of June 2016, due to advanced fund liquidations. But the remaining funds ultimately boosted their fund volumes due to the increased demand for open-end fund shares in Germany since 2014.
Figure 2.2 shows that average fund size decreased from EUR 4.5 billion in January 2004, due to newly issued funds (i.e., low fund volume), to the lowest levels over the 2006- January 2011 period of about EUR 3 billion. Since then, average fund size has risen, despite the fact that several funds were forced to liquidate. Significant capital inflows into the remaining funds led to an average fund volume of about EUR 3.5 billion as of June 2016.
Several funds were issued after August 2002, but within our sample period. The oldest fund at the beginning of the dataset was the UniImmo global fund at thirty-six years (433 months).
The Sale by Bank variable displays a mean of 0.39. This is because the vast majority of open-end real estate funds never switched from using a distribution network to sell fund shares to a system without a direct selling feature, or vice versa. Since October 2012, the DEGI fund family was the sole fund choosing to use a distribution network. Hence, about 40% of all funds sell shares via a distribution network.
Institutional shareholders on average represent 2% of all fund investors. The UBS 3 Sec- tor Real Estate fund reports an institutional share of up to 31.9%, while DEGI Europa has a 0.00% minimum share and never exceeds 0.30%. According to Figure 2.2, the aver- age share of institutional investors significantly increased to about 6% from August 2002 through Q1 2011. It subsequently decreased dramatically through June 2016. Neverthe- less, the graph may be biased due to the quality of the data provided.
For example, the Morningstar Direct data is not fully available, because they only report data from seventeen of the twenty-four open-end real estate funds. Furthermore, at the end of the dataset, open-end funds with generally larger shares of institutional investors
(such as the UBS 3 Sector Real Estate fund and the TMW Immobilien Welt fund) had provided insufficient information. Therefore, the sharp decline in the average share of institutional investors reported appears excessive.
Closure announcements are clustered in a few months over the sample period. The mean of the counting variable is 0.195. In October 2008, nine funds suspended share redemp- tions, and four funds had been forced to close as of November 2009 and May 2010. All nine funds that closed in October 2008 reopened, but were ultimately forced to close again from November 2009 through October 2010. Hence, the counting variable, which captures every fund closure event, includes some duplicates.
TER denotes annual management costs for each investor as a percent of fund volume.
Funds‘ expense ratios range from 0% to 1.5% of average annual fund volume. The aver- age total expense ratio is 0.8%. Funds’ total expense ratios generally increase over time.
The CS Euroreal fund shows the largest management fees at the beginning of the sample period in 2002, with a 1.5% expense ratio.
Total Return is defined as the annual change in net asset value. Extraordinary payouts to investors, due to the selling off of real estate portfolios, are considered in the calculation of total return for all distressed funds, as well as in the regular dividend payout for both healthy and distressed funds. Average annual total return is 1%. Table 2.2 shows a minimum annual total return of -57.90% for the MS P2 value fund in October 2010, and a maximum of +48.9% for the Inter ImmoProfil fund in January 2016.
Leverage ratios also differ dramatically across funds. Five distressed funds (DEGI Interna- tional, DEGI Europa, TMW Immobilien Welt, MS P2 Value, and UBS 3 Sector Real Estate) report leverage ratios of zero as of the end of the sample period. The Grundbesitz Europa fund exhibited a leverage ratio of 64.1% in Q3 2006 and Q1 2007. The average for all funds is 22.2%. In addition, the KanAM Grundinvest fund, which was forced to close in October 2008, exhibited an average leverage ratio of 38.66%, while the healthy Deka Immobilien global fund had only 18.48%.
Figure 2.2 shows that the average leverage ratio tended to rise through 2012. Afterward,