ATLAS-CONF-2019-036 05/08/2019
ATLAS CONF Note
ATLAS-CONF-2019-036
5th August 2019
Search for a new resonance in the b j µµ final state at a dimuon invariant mass around 28 GeVwith ATLAS p p data collected at √
s = 8 and 13 TeV
The ATLAS Collaboration
A search for a resonance decaying to two muons in the dimuon invariant mass range between 26–30 GeV and produced in association with a b -jet and an additional jet, is presented.
The analysis uses proton-proton collision datasets recorded by the ATLAS detector at the centre-of-mass energies of 8 and 13 TeV, corresponding to integrated luminosities of 20 fb
−1and 139 fb
−1, respectively. The events are categorised into two mutually exclusive search regions – the first one with exactly one central jet and at least one forward jet, and the second with at least two central jets and no forward jets. No significant excess above the Standard Model predictions is observed.
© 2019 CERN for the benefit of the ATLAS Collaboration.
Reproduction of this article or parts of it is allowed as specified in the CC-BY-4.0 license.
1 Introduction
The present experimental limits from ATLAS [1], CMS [2], and LHCb [3] analysing events from proton- proton collisions at the LHC, and from previous experiments at LEP, do not exclude the existence of light (pseudo)scalar bosons, e.g. those predicted in the two Higgs doublet models (2HDM) [4], and the Next-to-Minimal supersymmetric Standard Model (NMSSM) [5]. Recently, the results of a reanalysis of the public archived data recorded at the Z
0resonance by the ALEPH [6] experiment at LEP have been discussed [7]. An excess was reported in the opposite-sign dimuon invariant mass spectra at 30 . 40 ± 0 . 46 GeV in events containing b -quarks with a local significance of 5 standard deviations ( σ ) and a global significance of 2 . 6 σ .
Subsequently, the CMS Collaboration published results of a search for resonances in the mass range of 12-70 GeV decaying to a muon pair and produced in association with a b -jet and a second jet [8]. This search uses two event categories; events in the first category are required to have a b -jet in the central region ( |η| ≤ 2 . 4) and at least one jet in the forward region ( |η| > 2 . 4); events in the second category are required to have two jets in the central region, at least one of which is identified as a b -jet, no jets in the forward region, and low missing transverse momentum. An excess of events above the background near a dimuon invariant mass of 28 GeV is observed in the 8 TeV dataset, corresponding to local significances of 4.2 and 2.9 standard deviations for the first and second event categories, respectively. A similar analysis using the
√ s = 13 TeV dataset results in a mild excess over the background with local significances lower than 2 σ in the first category and a deficit of 1.4 σ in the second category.
This note describes an analysis targeting the same experimental topologies reported in the CMS study [8], analysing the proton-proton collision data recorded with the ATLAS detector at centre-of-mass energies of 8 and 13 TeV during the 2012 and 2015-2018 data taking periods, respectively. Event categories similar to the ones of the CMS analysis were implemented in order to quantify the potential presence of an excess in the ATLAS dataset.
Section 3 describes the analysed event samples (Section 3.1), reconstruction (Section 3.2) and selection (Section 3.3). Finally, Section 4 describes the obtained results.
2 The ATLAS detector
The ATLAS detector [1] at the LHC is a multi-purpose particle detector. It consists of an inner tracking system (ID), encompassed by a superconducting solenoid that provides a 2T magnetic field, electromagnetic and hadronic calorimeters, and a muon spectrometer (MS). The ID provides tracking within the pseudorapidity1 region |η| ≤ 2 . 5. It consists in silicon pixel and microstrip detectors inside of a transition radiation tracker; since the beginning of Run 2, an additional inner detector, the so-called Insertable B-Layer [9], is used.
ATLAS uses a sampling electromagnetic calorimeter made of lead absorbers that uses liquid argon as the active medium and provides energy measurements with high granularity up to a pseudorapidity range of
|η| ≤ 4 . 9. The hadronic calorimeter also covers the pseudorapidity range up to |η| ≤ 4 . 9 and comprises
1ATLAS uses a right-handed coordinate system with its origin at the nominal interaction point (IP) in the centre of the detector and thez-axis along the beam pipe. Thex-axis points from the IP to the centre of the LHC ring, and they-axis points upward.
Cylindrical coordinates(r, φ)are used in the transverse plane,φbeing the azimuthal angle around thez-axis. The pseudorapidity is defined in terms of the polar angleθasη=−ln tan(θ/2). Angular distance is measured in units of∆R≡p
(∆η)2+(∆φ)2.
steel and scintillating tiles in the barrel ( |η| < 1 . 7) and liquid argon technology in the endcap and forward region (1 . 5 < |η| < 4 . 9).
The MS is the outermost subdetector of ATLAS and is based on three air-core toroidal superconducting magnets with eight coils each. It provides a magnetic field with a bending integral of about 2.5 Tm within
|η| ≤ 1 . 05, and up to 6 Tm in the range of 1 . 05 ≤ |η| ≤ 2 . 7.
The trigger system [10] to select events for offline analysis is implemented in multiple levels. The first level (L1) is a hardware trigger using only a subset of the detector information and reducing the event rate to 100 kHz. It is followed by a software-based trigger (HLT) that lowers the rate further to about 1 kHz.
3 Datasets and event selection
3.1 Datasets
The 8 TeV data sample was collected in LHC Run 1 during the 2012 data taking period with a centre-of-mass energy of
√ s = 8 TeV, and corresponds to an integrated luminosity of 20 fb
−1. Events are collected with single-muon triggers with transverse momentum ( p
T) thresholds (i.e. requirement applied by the high-level trigger at the latest stage of the triggering process) at 24 GeV (including a muon candidates isolation requirement) or 36 GeV (without any isolation requirement) or with a dimuon trigger with thresholds on the first muon at 18 GeV and on the second one at 8 GeV.
The 13 TeV dataset was collected in LHC Run 2 during the 2015-2018 data taking period with a centre- of-mass energy of
√ s = 13 TeV, and corresponds to an integrated luminosity of 139 fb
−1. Single muon triggers require the p
Tof the muon to be above 24, 26, or 50 GeV, depending on the data taking period, including an isolation requirement on the muon candidate for the two lower threshold triggers. In addition to the single muon triggers in this dataset no dimuon triggers were used for simplicity. The reconstructed leading muon p
Tthreshold was therefore increased to 27 GeV, which results in a mild loss of efficiency, but remains close to the CMS analysis selection which used a muon p
Tthreshold of 25 GeV.
For muons with tracks reconstructed in both the ID and the MS within |η| ≤ 2 . 5 and in the p
Trange of the analysis, as described in Section 3.3, the trigger efficiency is approximately 80% and roughly uniform in p
T[11] for both the 8 TeV and the 13 TeV datasets.
3.2 Event reconstruction
Interaction vertices from proton–proton collisions are reconstructed from at least two tracks with transverse momentum larger than 0.4 GeV, and are required to be consistent with the beamspot envelope. The primary vertex (PV) is identified as the one with the largest Í
p
2T
of associated tracks [12].
Muon candidates are reconstructed using the information from the ID and the MS [13]. They are required to satisfy basic muon track quality requirements [13] and be matched to the PV. Since the analysis aims to check the CMS excess, the selection follows closely the criteria reported in [8]. The muon candidates are required to have |η | < 2 . 1. Additionally, the muons must satisfy the following criteria: the ratio of the transverse impact parameter d
0to its estimated uncertainty σ
d0, | d
0/σ
d0| , must be less than 3 and the projected longitudinal impact parameter | z
0sin θ| must be less than 1.0 (0.5) mm for 8 (13) TeV datasets.
The selected muons are well isolated from additional activity in the detector by requiring that the scalar
sum of p
Tof additional ID tracks in a cone of size ∆R = 0 . 3 (0.2) around each muon candidate be less than 12% (15%) of the muon p
Tfor respectively the 8 (13) TeV dataset, and that the sum of transverse energy, E
Tof calorimeter topological clusters [14] around the muon in a cone of size ∆R = 0 . 3 represents at most 30% of the muon p
T.
Jets are reconstructed using the anti- k
talgorithm [15] implemented in the FastJet package [16] with a radius parameter R = 0 . 4. Topological clusters of energy deposits in calorimeter cells are used as the input to the reconstruction algoritm in the 8 TeV dataset. In order to approximate as closely as possible the CMS analysis, in the 13 TeV dataset a particle-flow approach [17] was used in which the energy deposited in the calorimeter by all the charged particles is removed. The inputs to the anti- k
talgorithm are then the positive energy topological clusters surviving the energy subtraction step and tracks that are matched to the PV. Jets not originating from the primary interaction (pile-up) are suppressed with the use of tracking information as detailed in Ref. [18]. All selected jets are required to have p
T> 30 GeV, |η| < 4 . 5 and must pass quality requirements defined to minimise the impact of detector effects, beam backgrounds and cosmic rays [19].
Jets consistent with the hadronisation of a b -quark ( b -jets) within the tracking-system acceptance of
|η| < 2 . 4 are identified using multivariate discriminants,“MV1” [20] for the 8 TeV dataset and “MV2c10”
[21] for the 13 TeV one. The analysis uses the 60% b -jet identification efficiency working point for which the probabilities of misidentifying a jet initiated by a charm quark (light quark or gluon) as a b -jet are approximately 12% (0.15%) in the 8 TeV dataset and 4% (0.08%) in the 13 TeV one.
In order to reject non-prompt muons from the decay of hadrons within a jet, an overlap removal algorithm is applied. For the 8 TeV dataset the events with a muon candidate within ∆R < 0 . 3 of a jet are discarded.
For the 13 TeV dataset, if a jet is found within ∆R = 0 . 4 of the muon candidate, the overlap is resolved in the following way: if there are more than two tracks with p
T> 500 MeV associated with the jet then the muon is removed from the event, otherwise the muon is retained and the jet is removed.
The magnitude of the missing transverse energy ( E
Tmiss) is employed in the event categorization described below. This quantity relies on the negative vector sum ( → − p
missT
) of the transverse momenta of all selected and calibrated objects in the event. While the 8 TeV dataset uses an additional calorimeter-based “soft-term”, for the 13 TeV analysis this quantity has been refined by taking into account ID tracks matched to the PV but not associated with any of the calibrated objects [22], in order to achieve a better E
missT
resolution.
3.3 Event selection
The selection applied in this analysis follows as closely as possible the one from CMS [8], the most relevant difference being that the b -tagging working point efficiency is 60% in the ATLAS analysis, whereas in the CMS analysis it was 50%. Events are required to have two muons of opposite-sign (OS) with p
T> 25 GeV and at least two jets with p
T> 30 GeV. The p
Trequirement on the leading muon in the events of the 13 TeV dataset is raised to 27 GeV in order to ensure the maximum-efficiency regime of the single-muon triggers in the data taking period between years 2016 and 2018. The dimuon invariant mass ( m
µµ) is required to be greater than 12 GeV. At least one of the jets in the event is required to be central (i.e. |η| < 2 . 4) and b -tagged. The events are then classified into two signal regions (SR), depending on the number of central and forward jets. SR1 requires exactly one central and at least one forward (2 . 4 < |η| < 4 . 5) jet, while SR2 requires at least two central jets and no forward jets, an additional requirement on E
missT
, and on the angle between the dimuon and dijet systems ∆φ( j j, µµ) in the transverse
plane. All of the applied event selection criteria are detailed in Table 1.
After these selection criteria are applied, the background is dominated by Drell-Yan followed by top processes.
Preselection
2 OS muons with |η | < 2 . 1 and p
T> 25 GeV Leading muon p
T> 27 GeV (13 TeV dataset only)
m
µµ> 12 GeV
≥ 2 jets with p
T> 30 GeV
≥ 1 b -tagged (60%) jet with |η| < 2 . 4
SR1 SR2
Exactly one jet with |η| < 2 . 4 Exactly two jets with |η| < 2 . 4
≥ 1 jet with 2 . 4 < |η| < 4 . 5 No jets with 2 . 4 < |η| < 4 . 5 M ET < 40 GeV
∆ φ (jj, µµ ) > 2 . 5
Table 1: Event selection criteria.4 Results
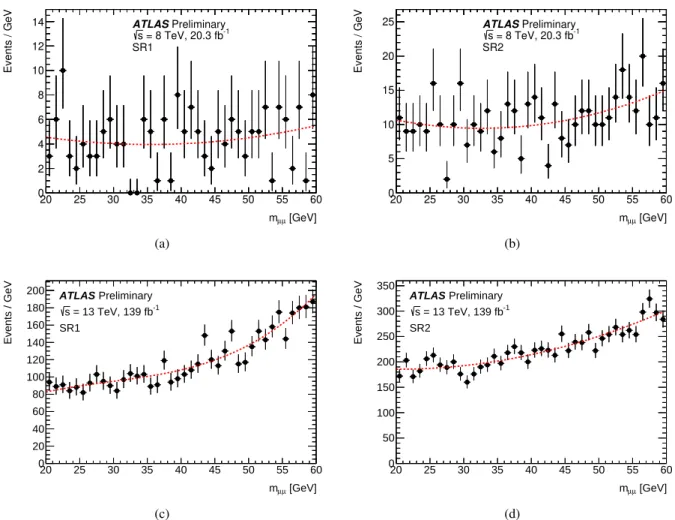
A statistical analysis of the dimuon invariant mass spectra in each signal region (SR1 and SR2) of the two analysed datasets has been carried out in order to search for the presence of a potential resonant signal. Only statistical uncertainties on the data yields were taken into consideration. Various functions to model the background invariant mass spectra in the mass range from 20 to 60 GeV were studied in Monte Carlo simulated events. An exponential, a second-order polynomial (as used by the CMS collaboration), a third-order polynomial, and the sum of an exponential and a second-order polynomial have been exercised on both 8 and 13 TeV datasets in both signal regions and proven to provide good fits to the background shape. The choice of the functions used to fit the data was based on a good description of the background mass shape that should not produce significant spurious signals, and the best statistical sensitivity to a potential signal in the vicinity of 28 GeV. The functions chosen for the 8 TeV dataset are a second-order polynomial for both signal regions, and for the 13 TeV dataset a third-order polynomial for the SR1 and a second-order polynomial for the SR2. For all selected functions the background biases in terms of spurious signals are compatible with zero within the MC statistical uncertainty.
The signal is modeled in the fit procedure using a Gaussian with a standard deviation of 1 GeV, which is compatible with the best fit intrinsic width reported by CMS convoluted with the ATLAS detector dimuon invariant mass resolution at about 28 GeV. The mean of this Gaussian component is varied in order to probe different resonance masses. For further validation of the fitting function, an injection test was carried out to ensure that in case of a signal being present the function would correctly describe it.
The sum of the chosen background function and this signal component is fitted to each dimuon invariant mass
distribution in data separately, binned in 1 GeV-wide bins, using the maximum-likelihood technique [23] in
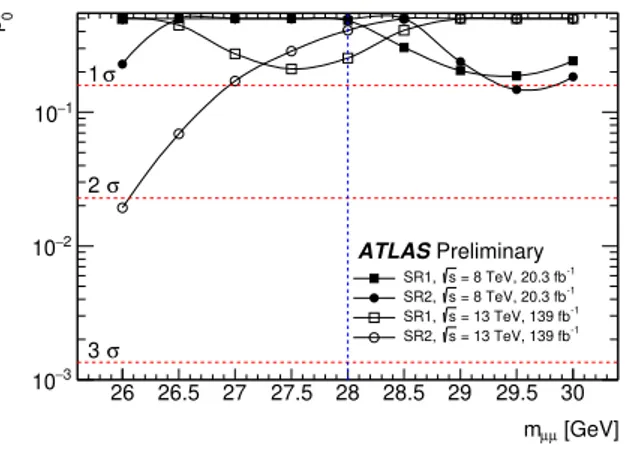
order to quantify deviations from the background-only hypothesis. The local probabilities that fluctuations
of the background model would produce an excess at least as significant as the one observed in each data
spectrum – defined as p
0– have been computed and converted in terms of the local significance in units of
standard deviations, and are shown in Table 2.
8 TeV 13 TeV
Region SR1 SR2 SR1 SR2
Local significance (28 GeV) 0.5 0.5 0.7 0.2
Max. significance 0.9 (29.5 GeV) 1.1 (29.5 GeV) 0.8 (27.5 GeV) 2.1 (26 GeV)
Table 2: Local significance for a dimuon excess at 28 GeV in each signal region and the maximum observed significance in the dimuon invariant mass probed from 26 to 30 GeV in steps of 0.5 GeV are quoted.
Figure 1 shows the dimuon invariant mass distributions in data. Background-only fits using a second-degree polynomial are superimposed for both signal regions for the 8 TeV dataset. Fits using a third-degree polynomial for SR1 and a second-degree polynomial for SR2 are superimposed for the 13 TeV dataset.
The χ
2of the fits divided by the number of degrees of freedom ranges between 0.96 and 1.14.
20 25 30 35 40 45 50 55 60
[GeV]
µ
mµ
0 2 4 6 8 10 12 14
Events / GeV
ATLASPreliminary SR1
= 8 TeV, 20.3 fb-1
s
(a)
20 25 30 35 40 45 50 55 60
[GeV]
µ
mµ
0 5 10 15 20 25
Events / GeV
ATLASPreliminary SR2
= 8 TeV, 20.3 fb-1
s
(b)
20 25 30 35 40 45 50 55 60
[GeV]
µ
mµ
0 20 40 60 80 100 120 140 160 180 200
Events / GeV
ATLAS Preliminary SR1
= 13 TeV, 139 fb-1
s
(c)
20 25 30 35 40 45 50 55 60
[GeV]
µ
mµ
0 50 100 150 200 250 300 350
Events / GeV
ATLAS Preliminary SR2
= 13 TeV, 139 fb-1
s
(d)
Figure 1: Background-only fits to the 8 TeV (top row) and 13 TeV (bottom row) dimuon invariant mass spectra in SR1 (left) and SR2 (right). For the 8 TeV spectra for both SR1 and SR2 a polynomial of second-degree was applied, whereas for the 13 TeV spectra a third-degree (SR1) and a second-degree (SR2) polynomial was used. Error bars on the data points illustrate Poisson uncertainties.
The maximal significances obtained in the dimuon invariant mass range from 26-30 GeV and at a dimuon
invariant mass of 28 GeV are given in Table 2. The number of signal events fitted for the dimuon invariant masses of 27, 28, and 29 GeV are consistent with zero in both signal regions for both data-taking periods.
A local probability scan for the mass range between 26 and 30 GeVin 0.5 GeV steps for both signal regions and datasets is shown in Figure 2.
26 26.5 27 27.5 28 28.5 29 29.5 30 [GeV]
µ
mµ 3
10− 2
10− 1
10−
0 p
ATLASPreliminary
= 8 TeV, 20.3 fb-1
s SR1,
= 8 TeV, 20.3 fb-1
s SR2,
= 13 TeV, 139 fb-1
s SR1,
= 13 TeV, 139 fb-1
s SR2,
1 σ
2 σ
3 σ
Figure 2: The local probability valuesp0are shown for both signal regions and datasets in the mass range between 26 and 30 GeV in steps of 0.5 GeV. The blue line indicates the dimuon invariant mass where the CMS excess was seen.