Genetic Microdissection of Insulin Action on Neurocircuits in Control of Glucose and Energy
Homeostasis
Inaugural-Dissertation zur
Erlangung des Doktorgrades
der Mathematisch-Naturwissenschaftlichen Fakultät der Universität zu Köln
vorgelegt von Anne Christine Könner
aus Köln
Köln 2009
Berichterstatter: Prof. Dr. Jens C. Brüning Prof. Dr. Wilhelm Krone Prof. Dr. Tamas L. Horvath
Tag der mündlichen Prüfung: 23.10.2009
Wenn ein Tier oder Mensch seine ganze Aufmerksamkeit und seinen ganzen Willen auf eine bestimmte Sache richtet, dann erreicht er sie auch. Das ist alles.
Hermann Hesse, Demian
Table of contents
Figure Index... IV Table Index ... VI Abbreviations...VII
1 Introduction...1
1.1 Obesity and Type 2 Diabetes Mellitus...1
1.2 Energy Homeostasis...2
1.3 Insulin...3
1.3.1 History, Structure and Biosynthesis ...3
1.3.2 Metabolic Effects ...3
1.4 The Insulin Receptor...5
1.4.1 Molecular Mechanisms of Insulin Receptor Signaling ...5
1.5 Leptin ...7
1.5.1 Mechanisms of Leptin Receptor Signaling...8
1.6 Central Regulation of Energy Homeostasis ...10
1.6.1 The Hypothalamus ...11
1.6.2 The Central Melanocortin System and Regulation by Peripheral Hormones...12
1.7 The Dopaminergic System of the Brain...16
1.7.1 Peripheral Hormonal Signals in Food Reward ...18
1.8 Objectives...20
2 Materials and Methods ...21
2.1 Chemicals and Biological Material...21
2.2 Molecular Biology ...23
2.2.1 Isolation of Genomic DNA...23
2.2.2 Quantification of Nucleic Acids...24
2.2.3 Polymerase Chain Reaction (PCR) ...24
2.2.4 RNA Extraction, RT PCR and Quantitative Realtime PCR ...25
2.3 Cell Biology ...26
2.3.1 Histological Analysis and Immunohistochemistry ...26
2.3.1.1 Immunohistochemistry ...26
2.3.1.2 Analysis of PIP3 formation in situ ...28
2.3.2 Histomorphology...28
2.3.3 Electrophysiology...29
Table of contents
2.3.4 Electron Microscopy ...29
2.4 Biochemistry...31
2.4.1 Enzyme-linked Immunosorbent Assay (ELISA) ...31
2.4.2 Protein Extraction...31
2.4.3 Western Blot Analysis ...32
2.5 Mouse Experiments ...33
2.5.1 Animal Care ...33
2.5.2 Mice ...33
2.5.3 Collection of Blood Samples and Determination of Blood Glucose Levels ...34
2.5.4 Food Intake and Indirect Calorimetry ...34
2.5.5 Glucose and Insulin Tolerance Test ...34
2.5.6 Insulin Signaling ...35
2.5.7 Analysis of Body Composition ...35
2.5.8 Fertility Assessment ...35
2.5.9 Restraint Stress...35
2.5.10 Euglycemic-Hyperinsulinemic Clamp Studies in Awake Mice...36
2.5.10.1 Catheter Implantation ...36
2.5.10.2 Radioactive Euglycemic-Hyperinsulinemic Clamp Experiment ...36
2.5.10.2.1 Assays ...37
2.5.10.2.2 Calculations...37
2.5.10.3 Long-term euglycemic-hyperinsulinemic clamp experiment ...38
2.6 Computer Analysis ...38
2.6.1 Densitometrical Analysis...38
2.6.2 Statistical Methods ...38
3 Results...39
3.1 Generation of POMC and AgRP neuron-specific insulin receptor knockout mice...39
3.2 Insulin hyperpolarizes AgRP and POMC neurons via K
ATPchannel activation...46
3.3 Normal body weight and energy homeostasis in IR
∆AgRPand IR
∆POMCmice ...50
3.4 IR
∆AgRPmice fail to fully suppress hepatic glucose production ...55
3.5 Reduced hepatic IL-6 expression in IR
∆AgRPmice ...60
3.6 Inactivation of the insulin receptor gene in dopaminergic cells ...64
3.7 Increased adiposity in IR
ΔThmice ...68
3.8 Unaltered glucose homeostasis in IR
ΔThmice ...70
3.9 Unaltered energy expenditure but increased food intake in IR
ΔThmice ...71
Table of contents
3.10 Increased expression of tyrosine hydroxylase and dopamine receptor 2 in the ventral
tegmental area of IR
∆Thmice ...73
3.11 Insulin action decreases excitatory inputs on dopaminergic neurons in the VTA ....74
4 Discussion ...77
4.1 Role of central insulin signaling in regulation of energy homeostasis and glucose metabolism...77
4.2 Inactivation of the insulin receptor gene specifically in POMC and AgRP neurons..78
4.2.1 Role of insulin action on POMC and AgRP neurons in the regulation of energy homeostasis...79
4.2.2 Role of insulin action on POMC and AgRP neurons in the regulation of glucose metabolism ...80
4.3 Inactivation of the insulin receptor gene specifically in dopaminergic cells...84
4.3.1 Role of insulin action on dopaminergic cells in the regulation of energy and glucose homeostasis...85
4.3.2 Role of insulin action on dopaminergic cells in the regulation of gene expression and synaptic plasticity ...86
4.4 Perspectives ...87
5 Summary...89
6 Zusammenfassung...90
7 References...91
8 Acknowledgements...108
9 Erklärung ...109
10 Curriculum vitae ...110
Figure Index
Figure Index
Figure 1: Insulin receptor signal transduction. ...7
Figure 2: Leptin receptor signal transduction. ...9
Figure 3: Schematic anatomical structure of the hypothalamus. ...12
Figure 4: Central regulation of energy homeostasis...15
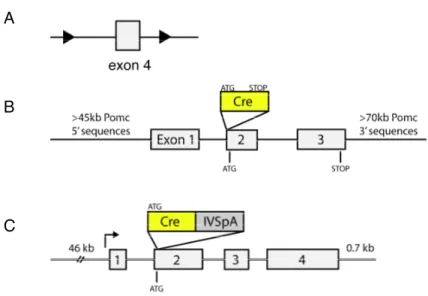
Figure 5: POMC and AgRP neuron-restricted inactivation of the insulin receptor gene. ...39
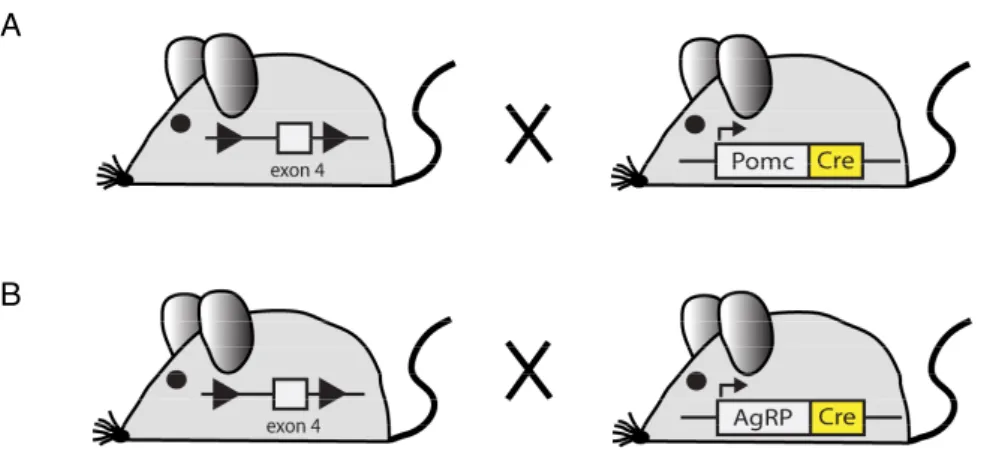
Figure 6: General scheme of mice with POMC (IR
ΔPOMC) and AgRP (IR
ΔAgRP) neuron- restricted inactivation of the insulin receptor gene. ...40
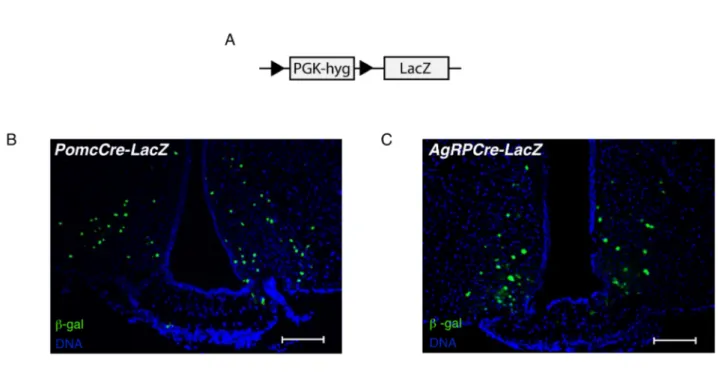
Figure 7: Verification of Cre-mediated recombination in PomcCre and AgRPCre mice. ...41
Figure 8: Western blot analysis of insulin receptor expression. ...42
Figure 9: Insulin signaling in peripheral organs of control, IR
ΔPOMCand IR
ΔAgRPmice. ...42
Figure 10: Regulation of the hypothalamic-pituitary-adrenal axis in IR
ΔPOMCmice. ...43
Figure 11: Fertility of IR
ΔPOMCand IR
ΔAgRPmice. ...44
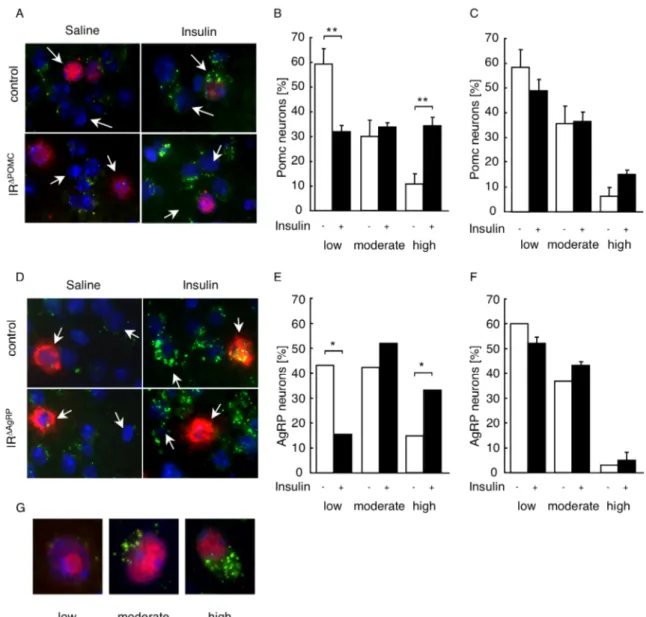
Figure 12: PIP3 formation in hypothalamic neurons of control, IR
∆POMCand IR
∆AgRPreporter mice...45
Figure 13: Z/EG expression construct. ...47
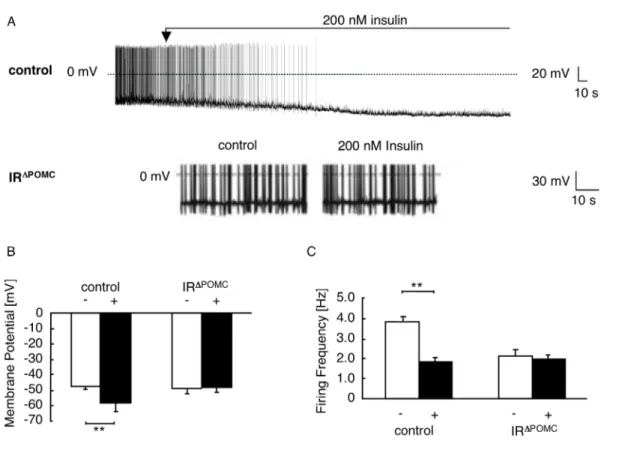
Figure 14: Effects of insulin on electrical activity of control and IR
ΔPOMC-Z/EG neurons. ...48
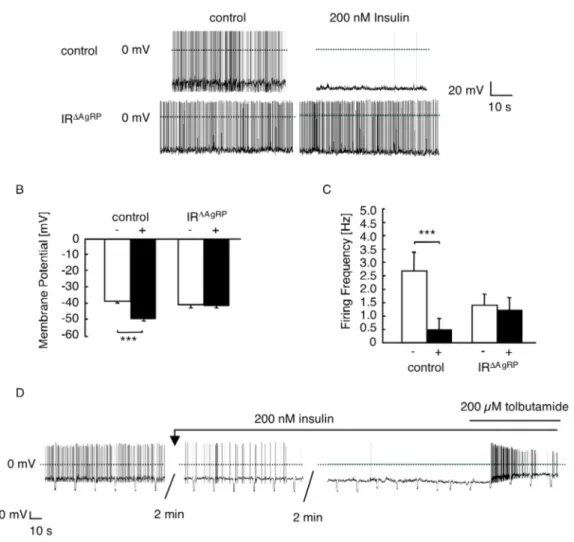
Figure 15: Effects of insulin and tolbutamide on electrical activity of control and IR
ΔAgRP- Z/EG neurons...49
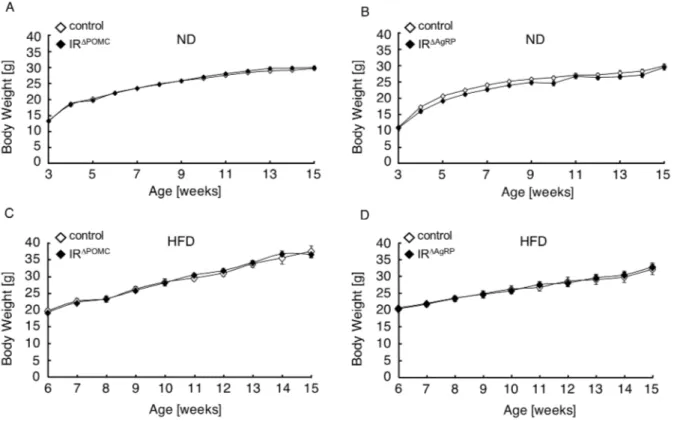
Figure 16: Body weight of IR
ΔPOMCand IR
ΔAgRPmice. ...50
Figure 17: Serum leptin concentrations in IR
ΔPOMCand IR
ΔAgRPmice...51
Figure 18: Daily food intake of IR
ΔPOMCand IR
ΔAgRPmice...51
Figure 19: Body weight, leptin levels and food intake of IR
ΔPOMCand IR
ΔAgRPfemale mice. .52 Figure 20: Epigonadal fat pad weights of female and male IR
ΔPOMCand IR
ΔAgRPmice...53
Figure 21: Hypothalamic neuropeptide expression in IR
ΔPOMCand IR
ΔAgRPmale mice. ...54
Figure 22: Body length of IR
ΔPOMCand IR
ΔAgRPmale mice...55
Figure 23: Fasting blood glucose levels and serum insulin concentrations in IR
ΔPOMCand IR
ΔAgRPmale mice...56
Figure 24: Glucose tolerance in IR
ΔPOMCand IR
ΔAgRPmale mice...57
Figure 25: General scheme of a euglycemic-hyperinsulinemic clamp. ...58
Figure 26: Regulation of glucose homeostasis in IR
ΔPOMCand IR
ΔAgRPmice. ...59
Figure Index
Figure 27: Insulin-stimulated tissue glucose uptake in euglycemic-hyperinsulinemic clamps.
...60
Figure 28: Hepatic interleukin-6 expression under steady state and basal conditions in euglycemic-hyperinsulinemic clamps...61
Figure 29: Hepatic G6Pase-expression under steady state and basal conditions in euglycemic- hyperinsulinemic clamps...62
Figure 30: Hepatic cytokine and chemokine expression at the end of euglycemic- hyperinsulinemic clamps...63
Figure 31: Restricted inactivation of the insulin receptor gene in tyrosine hydroxylase- expressing cells...64
Figure 32: General scheme of mice with restricted inactivation of the insulin receptor gene in tyrosine hydroxylase-expressing cells (IR
ΔTh)...64
Figure 33: Verification of Cre-mediated recombination in ThIRESCre mice. ...65
Figure 34: PIP3 formation in neurons of control and IR
∆Threporter mice. ...66
Figure 35: Fertility of IR
ΔThmice...67
Figure 36: Body weight, fat content and leptin levels of IR
ΔThmice. ...69
Figure 37: Glucose tolerance and insulin sensitivity in IR
∆Thmice...70
Figure 38: Serum insulin concentrations in IR
∆Thmice. ...71
Figure 39: Food intake of IR
∆Thmice...71
Figure 40: Basal metabolic rate and locomotor activity in IR
∆Thmice. ...72
Figure 41: Expression levels of genes critically involved in dopamine signaling in the VTA, NAc, and CPu of IR
∆Thmice. ...73
Figure 42: Long-term euglycemic-hyperinsulinemic clamps in C57BL/6 mice. ...75
Figure 43: Synaptic input on dopaminergic neurons in C57BL/6 mice after long-term euglycemic-hyperinsulinemic clamp studies...76
Figure 44: Model of hepatic-regulation via insulin action on AgRP neurons...83
Table Index
Table Index
Table 1: Chemicals...21
Table 2: Enzymes...23
Table 3: Oligonucleotides used for genotyping. ...25
Table 4: Probes used for Realtime PCR. ...26
Table 5: Primary antibodies used for Western blot analysis. ...32
Abbreviations
Abbreviations
°C degrees Celsius
3’ three prime end of DNA sequences
5’ five prime end of DNA sequences
A adenosine
a.m. ante meridiem
AAAD (Ddc) aromatic L-amino acid decarboxylase
ACTH adrenocorticotrophin
AgRP agouti-related peptide
Akt proteinkinase B
ARC arcuate nucleus
Avertin tribromoethyl alcohol and tert-amyl alcohol
Ba(OH)
2barium hydroxide
BAT brown adipose tissue
BMI body mass index
bp base pairs
C cytosine
c DNA concentration
CaCl
2calcium chloride
cAMP cyclic adenosine monophosphate
Ccl chemoligand (C-C motif)
cDNA complementary DNA
Ci Curie
CNS central nervous system
COMT catechol-O-methyl transferase
CPu caudate putamen
Cre site specific recombinase from phage P1 (causes recombination)
Cxcl chemoligand (C-X-C motif)
d deci
Da Dalton
DAPI 4',6-diamidino-2-phenylindole
DAT dopamine transporter
Abbreviations
ddH
2O double destilled water
DMH dorsomedial hypothalamic nucleus
DMSO dimethylsulfoxide
DNA desoxyribonucleic acid
DNase desoxyribonuclease
dNTP desoxyribonucleotide-triphosphate
dpm disintegrations per minute
DTT 1,4-Dithio-DL-threitol
e.g. exempli gratia
ECL enhanced chemiluminescence
EDTA ethylendiamine tetraacetate
EGFP enhanced green fluorescent protein EGTA ethylene glycol tetraacetic acid
ELISA enzyme-linked immunosorbent assay
EtBr ethidium bromide
EtOH ethanol
floxed / lox loxP flanked
FOXO1 forkhead-O transcription factor 1
g gram
G guanine
G6Pase α glucose-6-phosphatase α
Gab growth factor receptor binding protein associated binder
GABA γ-aminobutyric acid
GFP green fluorescent protein
GLUT-4 glucose transporter 4
Grb2 growth factor receptor binding protein 2
GTT glucose tolerance test
Gusb glucuronidase beta
h hour
H&E hematoxylin/eosin
H
2O
2hydrogen peroxide
HCl hydrochloric acid
HEPES N-2-hydroxyethylpiperazine-N’-2-ethansulfonic acid
HFD high fat diet
Abbreviations
HGP hepatic glucose production
Hprt-1 hypoxanthine guanine phosphoribosyl transferase-1
Hz Hertz
i.e. id est
icv intracerebroventricular
IGF-1 insulin-like growth factor-1
IL-6 interleukin-6
ip intraperitoneal
IR insulin receptor
IRES internal ribosome entry site
IRS insulin receptor substrate
ITT insulin tolerance test
JAK Janus kinase
k kilo
kb kilobase pairs
KCl potassium chloride
kDa kilodalton
KOH potassium hydroxide
l liter
LacZ gene encoding the enzyme β-galactosidase
lepr leptin receptor
LH lateral hypothalamic area
loxP recognition sequence for Cre (locus of x-ing over phage P1)
m milli
M molar
MAOB monoamine oxidase B
MAPK mitogen-activated protein kinase
MCR melanocortin receptor
ME median eminence
MgCl
2magnesium chloride
min minute
mRNA messenger RNA
MSH melanocyte-stimulating hormone
n nano
Abbreviations
n counts
Na
2HPO
4disodium hydrogen phosphate
Na
3O
4V sodium orthovanadate
NAc nucleus accumbens
NaCl sodium chloride
NaF sodium fluoride
NaH
2PO
4monosodium phosphate
NaHCO
3sodium bicarbonate
NaOH sodium hydroxide
ND normal diet
NIRKO neuron-restricted insulin receptor knockout mice
NMR nuclear magnetic resonance
NPY neuropeptide Y
ObRb long isoform of the leptin receptor
OD optical density
P phospho
PAGE polyacrylamid gel electrophoresis
PB phosphate buffer
PBS phosphate buffered saline
PCR polymerase chain reaction
PDK1 phosphoinositide-dependent protein kinase 1
PFA paraformaldehyde
PH pleckstrin homology
PI3 kinase phosphatidylinositol 3 kinase
PIP2 phosphatidylinositol (4,5) bisphosphate PIP3 phosphatidylinositol (3,4,5) trisphosphate
POMC proopiomelanocortin
PTB phosphotyrosine binding
PTEN phosphatase and tensin homolog
PVN paraventricular nucleus
Raf proto-oncogene serine/threonine protein kinase
Ras Ras small GTPase
RNA ribonucleic acid
RNAi RNA interference
Abbreviations
RNase ribonuclease
RT room temperature
SDS sodiumdodecylsulfate
sec second
SEM standard error of the mean
SH src homology
Shp-2 tyrosine phosphatase-2
SIM-1 single minded homolog-1
SN substantia nigra
SOCS suppressor of cytokine signaling
STAT signal transducer and activator of transcription
TAE Tris-acetic acid-EDTA buffer
TBS Tris buffered saline
TE Tris-EDTA buffer
Th tyrosine hydroxylase
TNF-α tumor necrosis factor-α
Tris 2-amino-2-(hydroxymethyl-)1,3-propandiole
Trp tryptophan
TWEEN polyoxethylene-sorbitan-monolaureate
Tyr tyrosine
U units
UV ultraviolet
V Volt
v/v volume per volume
VMH ventromedial nucleus of the hypothalamus
VO
2volume of consumed oxygen
VTA ventral tegmental area
w/v weight per volume
WAT white adipose tissue
WHO World Health Organization
ZnSO4 zinc sulfate
β-gal β-galactosidase
β -me β -mercaptoethanol
µ micro
Introduction
1 Introduction
1.1 Obesity and Type 2 Diabetes Mellitus
As the obesity epidemic shows no signs of abating, concern about this development has heightened during the last years. Obesity has been linked to numerous chronic conditions, including type 2 diabetes mellitus, hypertension, heart disease, stroke, and some forms of cancer. Therefore, increases in the prevalence of obesity carries potentially serious implications for the future health of populations and health care expenditures of countries (1, 2). Although initially most abundant in developed countries, principally in the United States, obesity and overweight are now dramatically on the rise in low- and middle-income countries.
Latest projections from the World Health Organization (WHO) indicated that in 2005 approximately 1.6 billion adults were overweight and at least 400 million adults were obese (3). Furthermore, the WHO estimates that by 2015, approximately 2.3 billion adults will be overweight and more than 700 million will be obese. Moreover, childhood obesity is dramatically on the rise, as in 2005 at least 20 million children under the age of 5 years were considered overweight (3).
The Body Mass Index (BMI), a simple index of weight-for-height, is one of the most commonly recommended and widely used methods for classifying overweight and obesity in adults. It is defined as the weight in kilograms divided by the square of the height in meters (kg/m
2) (4). The WHO defines overweight as a BMI ≥ 25, and obesity as a BMI ≥ 30.
However, while BMI classification provides a useful method for measurement of total adiposity, it needs adjustment for additional factors such as age, gender, and ethnicity. It is estimated that there are more than 300,000 obesity-attributable annual deaths and 80% of these occur among individuals with a BMI of more than 30 kg/m
2(5). Compared to individuals with a normal BMI, there is substantial risk of developing type 2 diabetes mellitus in individuals with a BMI > 35 (6, 7).
A substantial portion of the health complications and costs attributed to obesity is related to type 2 diabetes mellitus; a progressive disease that is primarily defined by the level of hyperglycemia with concomitant hyperinsulinemia and leads to deterioration in multiple organs and systems. In particular, it increases the risk of microvascular damage (i.e.
retinopathy, nephropathy and neuropathy) (8). Furthermore, it is associated with significant
morbidity due to microvascular complications, increased risk of macrovascular complications
(i.e. ischaemic heart disease, stroke and peripheral vascular disease), diminished quality of
life and ultimately reduced life expectancy (1, 8). Estimations indicate that worldwide there
Introduction
were 171 million people with type 2 diabetes mellitus in the year 2000 and this is estimated to increase to 366 million people by 2030 (9). Resistance to the biological effects of the peptide hormone insulin represents one of the hallmarks during the development of type 2 diabetes mellitus (10, 11) and obesity has been strongly associated with insulin resistance in normoglycemic persons and in individuals with type 2 diabetes mellitus (12, 13).
Many studies have indicated that genetic factors account for a substantial portion of variation in human adiposity. A genome-wide search for type 2 diabetes mellitus- susceptibility genes identified a common variant in the FTO (fat mass and obesity associated) gene that predisposes to type 2 diabetes mellitus through an effect on BMI (14). In addition, the importance of leptin, the leptin receptor and the melanocortin system in the control of human body weight has been demonstrated by identification of obese patients with mutations in leptin, the leptin receptor, proopiomelanocortin (POMC) or the melanocortin receptor 4 (15, 16). However, although rare obesity syndromes caused by mutations in single genes have been described, by far the greatest proportion of obesity in humans is not due to mutations in single genes. Thus, the most common forms of human obesity, that account for the obesity epidemic worldwide, are more likely to arise from the interactions of multiple genes, environmental factors and behavior (15, 16).
1.2 Energy Homeostasis
Body mass and composition are ultimately influenced by the long-term balance between energy intake and energy expenditure. With positive energy balance, body mass increases in order to restore energy balance. On the other hand, a state of negative energy balance leads to a decrease in body mass. Thus, understanding the regulation of energy balance is crucial in the development of therapeutical strategies in the treatment of obesity (for review see (17-20)).
Research over the last years suggested a key role for the central nervous system (CNS)
in the control of energy homeostasis. Neuronal systems involved in regulation of energy
intake, energy expenditure, and endogenous glucose production sense and integrate input
from peripheral hormones and nutrient-related signals that convey information about body
energy stores and energy availability (for review see (21)). In response, the brain activates
anabolic pathways (inhibition of energy intake and endogenous glucose production) to restore
energy balance. Conversely, a decreased neuronal input from these afferent signals activates
catabolic responses that promote positive energy balance (increased energy intake and
Introduction
endogenous glucose production). Afferent signals that convey information about body energy stores and energy availability include the pancreatic hormone insulin as well as the adipocyte- derived hormone leptin.
1.3 Insulin
1.3.1 History, Structure and Biosynthesis
In 1889, the physicians Oscar Minkowski and Joseph von Mering first noted that surgical removal of the pancreas led to the development of diabetes mellitus in dogs ((22), for review see (23)). Despite considerable effort, no significant progress was made in the isolation or characterization of the “antidiabetic factor” until 1921, when F. Banting, C. Best, J.J.R. Macleod and J. Collip finally identified a substance in extracts of the pancreas that had the remarkable ability to reduce blood glucose levels in diabetic animals; and by 1923 these pancreas extracts were being used to successfully treat diabetic patients (for review see (24, 25)). In 1923, Banting and Macleod were awarded the Nobel Prize in Medicine for their discovery of insulin.
Insulin, a 51 amino acid anabolic peptide hormone, is synthesized in the β -cells of the pancreatic islets of Langerhans, which are endocrine cells within the primarily exocrine pancreatic tissue. In the β -cells, insulin is cleaved from the inactive precursor proinsulin, which consists of two peptide chains linked by an intervening region called the C-peptide (26). Proinsulin is synthesized in the endoplasmatic reticulum, and then transported to the Golgi apparatus where it is packed into secretory granules and converted to native insulin and the C-peptide by the action of two endopeptidases and one carboxypeptidase (27, 28).
Removal of the C-peptide results in a conformational change of the protein, which enables the interaction with its receptor, the insulin receptor (29). After binding to and activating its receptor, insulin is either released back into the circulation or degraded by the cell via endocytosis of the insulin receptor complex followed by the action of the insulin degrading enzyme (for review see (30)).
1.3.2 Metabolic Effects
Insulin release from the pancreatic β -cells is rapidly triggered in response to increased
blood glucose levels, although insulin release is also stimulated by amino acids from ingested
proteins, acetylcholine, cholecystokinin, glucose-dependent insulinotropic peptide (GIP) and
Introduction
glucagon-like peptide (GLP)-1 (31-35). Moreover, plasma insulin levels are also directly correlated with the degree of body adiposity (36-38). Upon release, binding of insulin to its receptor induces a cascade of intracellular signaling events that regulate key cellular functions, including glucose transport and oxidation, synthesis of glycogen, triglycerides and proteins, and regulation of gene expression. Insulin acts on peripheral tissues, particularly on muscle cells and adipocytes, via translocation of the glucose transporter GLUT-4 into the cell membrane, thereby increasing glucose uptake in these tissues (39-41). Moreover, insulin promotes anabolic processes such as stimulation of amino acid uptake and protein synthesis in muscle, glycogen synthesis in liver and muscle as well as lipogenesis in adipose tissue.
Catabolic processes, on the other hand, such as glycogenolysis, lipolysis and proteolysis are inhibited by insulin (for review see (31)).
In addition, insulin controls hepatic glucose production through regulation of both glycogen metabolism and gluconeogenesis (for review see (42)). Prager et al. expanded the model of insulin’s direct hepatic effects by demonstrating that suppression of hepatic glucose production in obese, nondiabetic humans could also occur after peripheral insulin infusion, even when portal vein insulin concentrations remained unchanged, suggesting that insulin is also able to suppress hepatic glucose production through indirect hepatic actions (43).
Subsequent work in dogs confirmed this notion (44-46), and, in 2002, Obici et al. defined the mediobasal hypothalamus, a region known to be involved in regulation of energy balance, as one important extrahepatic site of insulin action to regulate hepatic glucose production (47).
They demonstrated that hypothalamic insulin signaling is required for insulin’s ability to suppress hepatic glucose production in euglycemic-hyperinsulinemic clamps of rats, a finding that was subsequently also described in mice (47, 48). Further recent work has indicated that hypothalamic insulin signaling is required for blood glucose lowering during insulin treatment of diabetes mellitus in rats (49).
The finding that insulin, when infused into the brain, decreases food intake and body weight led to the proposal by Woods and Porte that insulin serves as an adiposity signal in the brain, where it provides a signal related to the amount of body fat and causes a long-term, net catabolic response, decreasing food intake and increasing energy expenditure (50-53).
Peripheral circulating insulin has access to the brain via a saturable transporter across the
blood-brain barrier and insulin receptors are widely expressed in the brain, with the highest
concentrations in the olfactory bulb, hypothalamus, cerebral cortex, cerebellum and the
hippocampus (54-57). Importantly, mice with a neuron-specific insulin receptor deficiency
Introduction
are obese and display impaired fertility, further supporting a role for insulin receptor signaling in the regulation of fuel metabolism and reproduction (58).
1.4 The Insulin Receptor
The insulin receptor is present in virtually all vertebrate tissues, including classic insulin responsive tissues such as skeletal muscle, liver and adipose tissue, as well as tissues previously thought to be unresponsive to insulin like the CNS, the pancreas, lymphatic cells, endothelial cells or gonadal cells (59-62). The receptor gene is located on the short arm of human chromosome 19, is more than 150 kb in length and contains 22 exons, which encode a 4.2 kb cDNA (63). The receptor, a typical ligand-activated receptor tyrosine kinase of which two different isoforms due to alternative splicing of exon 11 exist, is composed of two α - subunits that are each linked to a β-subunit and to each other by disulfide bonds (64, 65). Both insulin receptor isoforms (IR-A and IR-B) display differences in ligand binding affinity, kinase activity, receptor internalization, recycling as well as intracellular signaling capacity and tissue distribution (66-71). From the two isoforms, IR-B is predominantly expressed in insulin target tissues (64, 66) that are responsible for glucose homeostasis such as liver, skeletal muscle and adipose tissue (72).
Both subunits of the insulin receptor are products of a single gene and are derived from a polypeptide precursor by proteolytic processing (73). The α-subunits are located entirely outside of the cell and contain the insulin binding site(s), whereas the intracellular portion of the β -subunit contains the insulin-regulated tyrosine protein kinase (74). The family of ligand-activated receptor tyrosine kinases contains two other structurally related molecules, the insulin-like growth factor (IGF)-1 receptor and the insulin receptor-related receptor, an orphan receptor for which no ligand has been identified yet (75-77).
The complete amino acid sequences, structural details and framework for the functional domains were determined by the cloning of the human insulin receptor precursor cDNA (73, 78). Subsequent cloning of the mouse and rat insulin receptor revealed a highly conserved sequence to the human insulin receptor gene (79).
1.4.1 Molecular Mechanisms of Insulin Receptor Signaling
Insulin exerts its pleiotropic functions by binding to and activating its membrane-
bound tyrosine kinase receptor. Binding of insulin to the α-subunit induces a conformational
Introduction
change of the receptor, thereby activating the intrinsic tyrosine kinase activity of the β- subunits leading to autophosphorylation of multiple tyrosine residues (Figure 1) (80).
Phosphorylation of these residues creates a binding site for intracellular signaling proteins that are recruited to the receptor via their phosphotyrosine-binding (PTB) domain and subsequently become tyrosine phosphorylated (81-83). In addition, intracellular substrates contain a N-terminal Pleckstrin homology (PH) domain which, through interaction with inositol phosphates in the cell membrane, allows for the localization of the substrate to the membrane (84-86). Intracellular signaling molecules of the insulin receptor are the four closely related insulin receptor substrate (IRS 1 - 4) proteins and the growth factor receptor binding (Grb)2 protein-associated binder (Gab) proteins (87-93). These insulin receptor substrates serve, when tyrosine phosphorylated, as a docking platform for Rous sarcoma virus (Src)-homology 2 (SH2) domain containing signaling proteins, such as the regulatory subunit of the phosphatidylinositol (PI) 3 kinase, Grb2 and the SH2 domain containing phosphatase (Shp)-2, among which the most important and best studied is the PI3 kinase (94-98). Binding to the insulin receptor substrates is then followed by activation of the PI3 kinase and the Ras/Raf Mitogen-activated protein (MAP)-kinase pathway (Figure 1) (for review see (32)).
The most common form of the widely expressed PI3 kinase consists of a 85 kDa regulatory subunit, p85, and a 110 kDa catalytic subunit, p110 (for review see (99)).
Activation occurs when the SH2 domain of the regulatory subunit binds to the phosphorylated
tyrosine residues of the activated IRS molecule. This relieves the inhibition of the catalytic
subunit and serves to localize the catalytic subunit to the cell membrane, where the substrate
of the PI3 kinase is located. PI3 kinase primarily catalyzes the phosphorylation of
phosphatidylinositol (4,5) bisphophate (PIP2) to phosphatidylinositol (3,4,5) trisphosphate
(PIP3) (Figure 1) (100, 101). PIP3, in turn, recruits and activates numerous other downstream
molecules containing PIP3 binding domains (PH domains), including serine-threonine
kinases, tyrosine kinases, and others. One of the key downstream targets is protein kinase B
(PKB, also known as Akt), which upon binding to PIP3 via its PH domain translocates to the
cell membrane and co-localizes with phosphoinositide-dependent protein kinase 1 (PDK1)
(for review see (102)). The subsequent conformational change enables PDK1 to
phosphorylate Akt, and thereby activating the enzyme. Activation of the IRS-PI3 kinase
cascade is crucial for most of insulin’s well-known effects, including glucose transporter
translocation, glycogen synthesis, protein synthesis and the regulation of gene transcription
(Figure 1) (for review see (103)).
Introduction
Figure 1: Insulin receptor signal transduction.
Binding of insulin to the insulin receptor results in activation of the membrane-bound insulin receptor tyrosine kinase, which consists of two α-subunits and two β-subunits forming a α2β2 heterotetramer. Upon insulin binding to the extracellular α-subunits, the receptor undergoes a conformational change, activating the tyrosine kinase activity of the β-subunits, resulting in receptor autophosphorylation and subsequently in the phosphorylation of intracellular insulin receptor substrate (IRS) 1 proteins on tyrosine residues. These phosphorylation sites are located in domains that characterize them as binding sites for src-homology 2 (SH2) domain-containing proteins such as the p85-regulatory subunit of phosphatidylinositol 3 kinase (PI3 kinase) and the growth factor receptor binding protein (Grb) 2. Binding of these proteins to tyrosine-phosphorylated IRS 1 proteins results in their activation, initiating downstream signals such as the activation of the Ras-Raf-MAPK cascade or activation of serine/threonine kinases downstream of PIP3. These signals finally result in the diverse biological effects of insulin signaling. Abbreviations: Akt, protein kinase B; MAPK, mitogen-activated protein kinase; mSOS, son of sevenless; PDK1, protein-dependent kinase 1; p110, catalytic subunit of PI3 kinase; PIP2, phosphatidylinositol (4,5) bisphosphate; PIP3, phosphatidylinositol (3,4,5) trisphosphate; PTEN, phosphatase and tensin homolog; Raf, proto-oncogene serine/threonine protein kinase; Ras, Ras small GTPase.
1.5 Leptin
In 1994, another prototypic adiposity signal was discovered as the ob (obese) gene
product, which encodes the leptin protein (104). Mice carrying a mutation in the ob gene
exhibit dramatic weight gain (ob/ob) (104), and a naturally occurring loss-of-function
mutation of the leptin receptor in both CNS and periphery underlies the phenotype of obese
and diabetic mice (db/db) (105). Leptin (leptos (Greek): thin) is primarily expressed in the
Introduction
adipose tissue and, at lower levels, in gastric epithelium, placenta and testis (104, 106-108).
The 16 kDa protein circulates in rodent and human plasma (109), and plasma leptin levels are highly correlated with adipose tissue mass and decrease in mice and humans after weight loss (110). In particular, the amount of ob gene expression per cell directly correlates with the lipid content and the size of individual adipocytes (111). Thus, plasma leptin levels have been found to be increased in obese humans as well as in multiple genetically induced forms of rodent obesity (110). Peripheral administration of leptin results in a dose-dependent decrease in body weight by reducing food intake and increasing energy expenditure in ob/ob and wild type mice, with weight loss restricted to adipose tissue but not lean mass (109, 112, 113).
As shown by Cohen et al., the neuron-specific deletion of the leptin receptor resembles the phenotype of the db/db mouse (114), indicating that the major role of leptin action to control energy homeostasis is accounted for by its signaling in the CNS. Along this line, administration of leptin in the CNS decreases food intake and body weight in various species, underlining the pivotal role of leptin in the regulation of energy homeostasis in the CNS (for review see (21, 115, 116)). Circulating leptin is transported to the brain across the blood-brain barrier via a saturable process (117).
In humans, rarely occurring loss-of-function mutations of the leptin gene result in morbid obesity, that can be rescued by leptin treatment (118, 119). However, the majority of obese patients develop overweight in the presence of elevated plasma leptin concentrations, indicative of leptin resistance (110, 118). Consistent with this, rats fed a high fat diet as a model of diet-induced obesity developed resistance to leptin’s anorectic effect in the presence of hyperleptinemia (120). However, studies indicate that leptin responsiveness may be restored if applied in combination with other drugs (121).
1.5.1 Mechanisms of Leptin Receptor Signaling
The leptin receptor is a cytokine receptor of which different isoforms exist, all arising
from alternative mRNA splicing and/or proteolytic processing of the single lepr gene (122-
124). Among the different isoforms only the Lepr-B (ObRb) has been shown to activate
intracellular signaling (123). ObRb is highly conserved among species and is critical for leptin
action as observed in db/db mice, which indeed lack only the ObRb (122, 123, 125). Many
effects of leptin on energy homeostasis are attributable to its action in the CNS, especially in
the mediobasal hypothalamus, where ObRb is highest expressed (126).
Introduction
Figure 2: Leptin receptor signal transduction.
Binding of leptin to the long form of the leptin receptor (ObRb) leads to activation of janus kinase (JAK) 2 and subsequently to JAK2-mediated phosphorylation of three different intracellular tyrosine residues of the receptor.
This results in the phosphorylation and activation of signal transducer and activator of transcription (STAT)3 molecules. Activated STAT3 molecules form dimers, which translocate to the nucleus and activate target genes including suppressor of cytokine signaling (SOCS)3, resulting in inhibition of leptin signaling via a negative feedback loop. Additionally, phosphorylated JAK2 directly activates the IRS 1/PI3K signaling pathway, initiating downstream signals such as activation of serine/threonine kinases downstream of PIP3. Abbreviations:
Akt, protein kinase B; IRS 1, insulin receptor substrate 1; PDK 1, protein-dependent kinase 1, PI3K, phosphatidyl inositol 3 kinase, PIP2, phosphatidylinositol (4,5) bisphosphate; PIP3, phosphatidylinositol (3,4,5) trisphosphate.
ObRb consists of a single membrane-spanning domain and hormone binding to the receptor triggers the activation of a member of the janus kinase (JAK) family, JAK2 (127).
Activation of the JAK2 associated tyrosine kinases leads to autophosphorylation of JAK2 on
multiple tyrosine residues and phosphorylation of three tyrosine residues on the intracellular
domain of ObRb to create a binding site for signal transducers and activators of transcription
(STAT) molecules (Figure 2) (123, 127, 128). Activated phosphorylated STAT molecules
dimerize and translocate to the nucleus where they act as a transcription factor to regulate
gene expression via STAT-responsive elements (Figure 1) (127, 129, 130). Here, STAT3
activates expression of the suppressor of cytokine signaling (SOCS)3 (131), thereby providing
an intracellular negative feedback loop to leptin signaling. SOCS3 directly binds to JAK2,
Introduction
thereby reducing phosphorylation of downstream molecules by JAK2 and attenuating leptin- induced tyrosine phosphorylation of JAK2 (Figure 2) (132-135).
Binding of leptin to the leptin receptor not only activates the JAK/STAT-pathway, but also PI3 kinase signaling via tyrosine-phosphorylation of IRS proteins and direct activation of the PI3 kinase by JAK2 (127, 136), thus providing a potential point of convergence and synergism with insulin-stimulated signals (Figure 2) (137). The importance of leptin-mediated activation of the PI3 kinase signaling pathway has been demontrated in IRS 2 deficient mice which develop hyperphagia and decreased energy expenditure in the presence of increased adiposity and circulating leptin concentrations, indicating leptin resistance (138).
1.6 Central Regulation of Energy Homeostasis
Already in the 1940s and 1950s, classic lesion experiments in the rodent hypothalamus could identify the brain as a critical organ in the regulation of body weight and energy homeostasis. In 1940, Hetherington demonstrated that destruction of the ventromedial hypothalamus (VMH) caused hyperphagia, obesity, and diabetes mellitus in rats (139), while lesions of the lateral hypothalamus (LH) carried out by Anand et al. resulted in a failure to eat and drink (140). It was thus concluded that the “satiety center” was located in the VMH and the “feeding center” in the LH. In 1953, Kennedy first proposed that hormonal signals are released into the blood stream in proportion to the body’s energy stores and are able to regulate body weight by influencing energy intake and expenditure (141). Parabiosis studies, in which the circulation of animals was surgically joined, demonstrated that food intake and body weight were drastically decreased in normal rats joined to obese VMH-lesioned rats. In contrast, VMH-lesioned rats continued to overeat and gain weight when parabiosed with VMH-lesioned or non-lesioned rats. These experiments provided direct evidence that an intact hypothalamus is required for the regulating action of hormonal satiety signals produced in obesity and created the link between circulating satiety signals and their hypothalamic target regions (142).
Besides the brain’s ability to integrate peripheral hormonal signals in order to regulate
energy intake and energy expenditure, it has long been suggested that the CNS plays an
essential role in the control of peripheral blood glucose levels. The French physiologist
Claude Bernard demonstrated more than 150 years ago that pricking of the floor of the fourth
ventricle of the brain in rabbits results in glucosuria, and concluded that the CNS plays an
essential role in the control of peripheral blood glucose levels (143).
Introduction
1.6.1 The Hypothalamus
In vertebrates, the hypothalamus is a part of the diencephalon that lies below the thalamus, building up the floor of the third cerebral ventricle. The mammalian hypothalamus consists of more than 40 histologically distinct nuclei and areas, which often can be further divided into subnuclei (144). Lesion and electrical stimulation studies identified distinct hypothalamic nuclei in control of feeding and satiety. Here, the arcuate nucleus (ARC), the paraventricular nucleus (PVN), the VMH, the dorsomedial hypothalamic nucleus (DMH) and LH are the nuclei, which have been shown to be involved in regulation of feeding behavior (Figure 3). Importantly, the hypothalamus is involved in many other behaviors than food intake, such as regulation of drinking behavior, body temperature, stress response, reproduction and the autonomous nervous system (for review see (145)).
The ARC is located in the mediobasal hypothalamus adjacent to the third cerebral
ventricle and the median eminence. Of the circumventricular organs, i.e. areas that lack a
blood-brain barrier, the median eminence and its close relationship with the hypothalamic
ARC plays an important role in controlling the entry of peripheral substances to neurons of
the mediobasal hypothalamus (Figure 3) (146, 147). The PVN is located at the dorsal end of
the third ventricle and represents a point of convergence for neuronal pathways implied in the
regulation of energy balance, including projections from the ARC (144). Lesions of the PVN
as well as the VMH, which is located directly above the ARC, results in hyperphagia and
weight gain (Figure 3). The DMH is located dorsal of the VMH and major projections to this
nucleus are provided by most other hypothalamic nuclei, including the ARC, the VMH, the
PVN and the LH, indicating an integrative role for the DMH (148). The LH, a very large and
heterogenous area, is the most extensively interconnected area of the hypothalamus, thereby
allowing it to modulate different functions, including cognitive and autonomic functions (for
review see (145)).
Introduction
Figure 3: Schematic anatomical structure of the hypothalamus.
Diagram of the mediobasal hypothalamus, showing major hypothalamic regions implicated in regulation of food intake and energy expenditure. Abbreviations: 3V, third ventricle; ARC, arcuate nucleus, DMH, dorsomedial hypothalamic nucleus; LH, lateral hypothalamus; ME, median eminence; VMH, ventromedial nucleus of the hypothalamus; PVN, paraventricular nucleus.
1.6.2 The Central Melanocortin System and Regulation by Peripheral Hormones The melanocortin system has been considered as the most promising model to explain neuronal control in regulation of long-term energy balance (Figure 4) (for review see (21, 149)). The ARC of the mediobasal hypothalamus is critical in this model. Here, two functionally opposing neuronal populations have been studied in great detail: the anorexigenic proopiomelanocortin (POMC)-expressing and the orexigenic agouti related peptide / neuropeptide Y (AgRP/NPY)-expressing neurons (Figure 4). AgRP and NPY are anabolic neuropeptides that stimulate feeding and reduce energy expenditure, while the catabolic neuropeptide POMC suppresses feeding and increases energy expenditure (150-152).
The anorectic POMC neurons express POMC as a precursor protein which, dependent
on the cell type-specific expression pattern of prohormone convertases, is processed to
different bioactive products, including melanocyte-stimulating hormones (α-, β-, and γ-
MSH), adrenocorticotrophin (ACTH) and β -endorphin (153). Besides from the ARC, POMC
is expressed in the pituitary, the nucleus tractus solitarius and in several peripheral tissues
(154-156). Upon fasting, POMC mRNA levels are significantly reduced in the ARC, and
expression is restored with refeeding (157).
Introduction
Among the melanocyte-stimulating hormones, α-MSH reduces food intake and increases energy expenditure both in animals and humans (158-160). α- and β -MSH act on melanocortin receptor (MCR) type 3 and 4, which are G-protein coupled receptors that activate the adenylate cyclase and are expressed in the ARC, PVN, LH, VMH, and DMH (161-163). Recent elegant cell type-specific reconstitution experiments of MC4R on a null background in mice have defined single-minded homolog (SIM)-1-positive PVN neurons as the critical mediators of α-MSH stimulated anorexia (164). However, since energy expenditure remained unaltered in PVN/SIM1-reconstituted MC4R null mice, the nature and location of the energy expenditure controlling α-MSH target neurons remains elusive (164).
The second principal neuronal population in the ARC are the orexigenic AgRP/NPY neurons. The orexigenic neuropeptide NPY is one of the most abundant neurotransmitters that is widely expressed throughout the brain with highest concentration in the ARC (165-167).
NPY is a potent stimulator of food intake, reduces energy expenditure (168, 169), and central NPY administration promotes a state of positive energy balance and increased fat storage (170).
AgRP acts as an inverse agonist of the MC3/4R and prevents the anorectic effect of α - MSH. Accordingly, overexpression of the Agouti protein, an AgRP-like peptide results in the obese, hyperphagic phenotype of the Agouti (A
y) mouse (171). The only peripheral tissue with detectable AgRP expression is the adrenal gland (171).
AgRP mRNA levels in the ARC are increased upon fasting (157), and reduction of
hypothalamic AgRP mRNA results in an increased metabolic rate and reduction of body
weight without affecting food intake (172). The pivotal role of these cells in the acute
regulation of feeding in adult mammals has been further substantiated by toxin-mediated
AgRP neuron ablation: ablation of these neurons in adult mice led to a hypophagic phenotype
(173, 174). However, this phenotype of AgRP neuron-ablated mice conflicts that of
NPY/AgRP single or double knockout mice (175), indicating that either developmental
compensation accounts for the lack of a phenotype in the latter mice, or alternative
neuropeptides or –transmitters are released from these cells. Indeed, AgRP neurons are
GABAergic and thereby account to a large extend for the GABAergic innervation on
neighbouring POMC cells (Figure 4) (176). Strikingly, acute ablation of AgRP neurons in
adult mice causes disinhibition of neurons, as assessed by cFos immunoreactivity, in
numerous brain sites including the ARC, PVN, DMH, medial preoptic area, lateral septum,
and nucleus of the solitary tract (177). Consistent with a role for GABA-signaling in AgRP
neurons, AgRP cell-restricted inactivation of the vesicular GABA transporter results in
Introduction
leanness (178). Very recent studies have demonstrated that GABAergic AgRP neuron projections into the parabrachial nucleus are critical for the maintenance of feeding (179).
Both, POMC and AgRP/NPY neuronal populations express insulin and leptin receptors and are targeted by the respective hormones (57, 58, 115), and large body of evidence has revealed an important role for leptin-activated STAT3 signaling in the CNS and POMC/AgRP neurons specifically in control of energy homeostasis. Neuron-specific disruption of STAT3 results in hyperphagia, obesity, diabetes and infertility (180). Along this line, mice with disruption of STAT3 specifically in leptin receptor-expressing neurons develop profound obesity (181). Further substantiating a role for STAT3 signaling in POMC/AgRP neurons for maintaining normal energy homeostasis, lack of leptin receptor signaling or inactivation of STAT3 specifically in POMC neurons results in obesity and other elements of the metabolic syndrome in rodents (182, 183), and deletion of STAT3 in AgRP/NPY neurons results in modest weight gain accompanied by mild hyperphagia (184).
Interestingly, mice with a constitutive activation of STAT3 signaling specifically in AgRP neurons are lean due to increased locomotor activity (185), assigning AgRP neurons and specifically STAT3 signaling a role in control of locomotor activity. Administration of leptin to the ARC stimulates expression of POMC (115, 186) and inhibits expression of AgRP and NPY (187, 188). Moreover, administration of a MC4R antagonist attenuates the anorexigenic response to leptin (189).
Insulin fails to activate STAT3 signaling and thus alternative intracellular signaling
pathways mediating insulin-evoked anorexia via control of the melanocortin system should
exist. Since intracellular signaling pathways of both insulin and leptin converge at the level of
the PI3 kinase (190), this pathway provided an excellent candidate for convergence of insulin
and leptin action. Indeed, blockade of PI3 kinase activation inhibits both insulin’s and leptin’s
acute anorexigenic effect in rats, indicating an important role for PI3 kinase activation in
mediating the intracellular effects of both hormones (136, 191). Subsequently, it was
demonstrated that insulin and leptin evoked PI3 kinase activation results in Akt-mediated
phosphorylation of the transcription factor forkhead-O transcription factor (FOXO)1, thus
leading to disinhibition of POMC transcription (186, 192). Central administration of insulin
results in increased POMC and decreased NPY expression, without affecting AgRP
expression (187, 193, 194). Besides regulating gene expression, PI3 kinase signaling and
especially its product PIP3 has been shown to regulate cell excitability by binding to the
regulatory subunit of ATP-dependent potassium channels (K
ATPchannels) (195).
Introduction
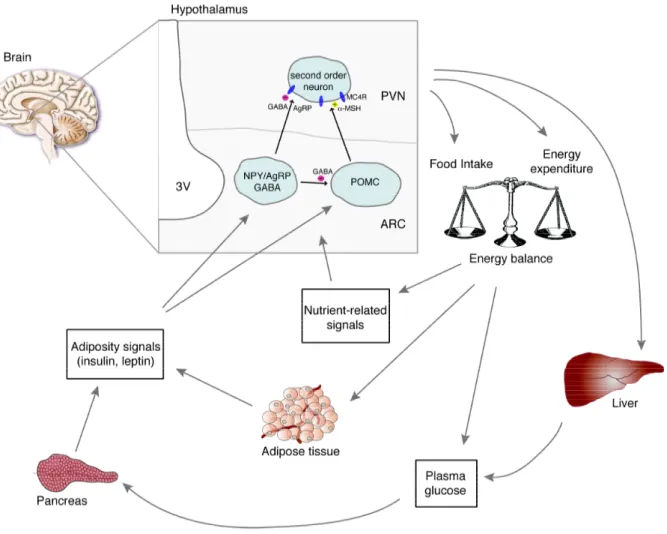
Figure 4: Central regulation of energy homeostasis.
The arcuate nucleus (ARC) contains both NPY/AgRP and POMC neurons, which are located close to the blood- brain barrier, where they have preferential access to peripheral humoral signals such as the pancreas-derived hormone insulin and the adipocyte-secreted hormone leptin as well as nutritional signals such as glucose and free fatty acids. Both neuronal populations exert potent effects on energy balance mediated by their characteristic neuropeptides, which allow modulation of second order neurons. POMC neurons project predominantly to second order neurons in the paraventricular nucleus (PVN) of the hypothalamus, where the POMC cleavage product α-MSH acts on melanocortin (MC) 4 receptors to suppress food intake. AgRP serves as an inverse agonist for the MC4 receptor, thus counteracting the function of α-MSH. In the ARC AgRP/NPY neurons provide inhibitory input onto POMC neurons via synaptic release of the transmitter GABA (γ-aminobutyric acid). AgRP/NPY and POMC neurons sense and integrate peripheral signals related to the amount of body fat such as insulin and leptin to cause a long-term, net catabolic response, decreasing food intake, increasing energy expenditure and regulating hepatic glucose production. Abbreviations: AgRP, agouti-related peptide; NPY, neuropeptide Y; POMC, proopiomelanocortin, α-MSH, α-melanocyte-stimulating hormone. [Adapted from Schwartz MW, Porte D; Diabetes, obesity, and the brain; 2005; (19)]
Introduction
K
ATPchannels were initially identified as metabolic sensors in the pancreas, where they sense elevated glucose levels through changes in ATP concentrations as a result of glucose metabolism in the cytoplasm. Elevated ATP concentrations lead to the closure of K
ATPchannels, thereby opening voltage-dependent calcium channels, increasing intracellular calcium concentration, and thus triggering vesicle release (196).
K
ATPchannels are widely expressed in different cell types of the brain: glia cells and neurons of the hippocampus and the hypothalamus (197-199), including POMC- and AgRP/NPY-expressing neurons. PIP3 modulates K
ATPchannel activity via three different proposed mechanisms: (a) PIP3 increases the probability that K
ATPchannels are open, which indirectly lowers the ability of ATP to inhibit the channels; (b) PIP3 directly decreases ATP binding to the channel (195, 200, 201); and (c) PIP 3 modulates K
ATPchannel activity by degradation of local actin filaments around K
ATPchannels (137).
Recent studies have addressed the role of PIP3 mediated K
ATPchannel modulation in hypothalamic neurons with regard to energy and glucose metabolism. Constitutive activation of PIP3 formation in POMC cells by conditional ablation of the phospholipid phosphatase and tensin homolog (PTEN), a negative regulator of PI3 kinase signaling, results in hyperphagia, diet-sensitive obesity, and leptin resistance (202). Moreover, transgenic expression of a mutant subunit that prevents ATP-mediated closure of K
ATPchannels resulted in impaired whole-body response to a systemic glucose load although with no obvious effect on body weight (203).
However, insulin and leptin receptors are expressed not only in the ARC, but also in the VMH, the LH and other hypothalamic sites, as well as in neurons of the midbrain (ventral tegmental area and substantia nigra) (56, 126, 204). Here, expression of the insulin and the leptin receptor and their functional signaling in dopaminergic neurons of the ventral tegmental area provides an interesting link between the hormonal control of food intake and the reward system (205-208).
1.7 The Dopaminergic System of the Brain
Regarding the functional components and brain substrates of reward, Berridge et al.
proposed a model where they distinct between the components ‘wanting’ (appetite/incentive
behavior) and ‘liking’ (pleasure/palatability) of food (209). Mediation of ‘wanting’ in terms
of food reward involves in part the mesolimbic dopamine system, the nucleus accumbens and
the amygdala (209).
Introduction
Dopamine is a highly conserved catecholaminergic neurotransmitter involved in movement, goal-directed behavior, cognition, attention, and reward (for review see (210, 211)). It is utilized predominantly in the brain, where it controls the function of the basal nuclei and their associated projections. In the peripheral nervous system, it is used as a neurotransmitter in a few peripheral neuronal groups, but primarily serves as the substrate for the synthesis of norepinephrine and epinephrine in sympathetic neurons and the adrenal medulla (211, 212).
Dopamine is synthesized by hydroxylation of the amino acid L-tyrosine to L- dihydroxyphenylalanine (L-DOPA) via the enzyme tyrosine hydroxylase, the rate-limiting enzyme in catecholamine biosynthesis, and subsequent decarboxylation of L-DOPA by aromatic L-amino acid decarboxylase (dopa decarboxylase) (for review see (213)). In neurons, dopamine is stored in vesicles at the presynaptic nerve terminals, and is released into the synapse in response to a presynaptic action potential. Released dopamine activates its postsynaptic receptors, as well as presynaptic dopamine (D) 2 receptors to inhibit further release of the neurotransmitter. Extracellular dopamine is cleared from the synapses via the dopamine transporter (DAT) and inactivated by monoamine oxidase (MAO) and catechol-O- methyl-transferase (COMT) (213, 214).
The first dopamine receptors were identified by their ability to regulate cyclic adenosine monophosphate (cAMP) production and were shown to be the targets of neuroleptic agents (215). This defined two classes of dopamine receptors, D1 and D2, which respectively stimulate and inhibit cAMP production and can be differentiated pharmacologically, biologically, physiologically and by their anatomical distribution (for review see (216)). Subsequent cloning of these receptors demonstrated two D1-like receptors (D1 and D5) and three D2-like receptors (D2, D3, and D4). D1 and D2 are most abundant in the neostriatum, which comprises the caudate nucleus, putamen and nucleus accumbens.
Here, they are enriched in distinct populations of striatal neurons, although there is a certain level of co-expression. All dopamine receptor subtypes are members of a large guanosine triphosphate-binding (G) protein-coupled receptor family, which is characterized by seven transmembrane hydrophobic domains, an extracellular N- and an intracellular C-terminus.
Downstream effects are either inhibitory or stimulatory, depending on the types of G protein
linked to the receptor – dopamine D1 and D5 receptors are linked to inhibitory G proteins,
whereas dopamine receptor D2, D3 and D4 are linked to stimulatory G proteins (for review
see (216)).
Introduction