Insulin regulates Energy Homeostasis and Hypoglycemia in the
Ventromedial Hypothalamus
I n a u g u r a l – D i s s e r t a t i o n
zur Erlangung des Doktorgrades
der Mathematisch-Naturwissenschaftlichen Fakultät der Universität Köln
vorgelegt von
Tim Klöckener
aus Olpe
Köln 2012
Berichterstatter: Prof. Dr. Jens C. Brüning
Priv-Doz. Dr. F. Thomas Wunderlich
Tag der mündlichen Prüfung: 04.12.2012
Contents
Abbreviations x
Abstract xi
Zusammenfassung xii
1 Introduction 1
1.1 Obesity . . . 1
1.2 Regulatory Mechanism of Energy Homeostasis . . . 2
1.3 Neuronal Circuits in the Hypothalamus controlling Energy Homeostasis . 3 1.4 The Melanocortin System . . . 5
1.5 Leptin and Leptin Signaling . . . 8
1.6 Leptin Resistance . . . 11
1.7 Insulin and Insulin Signaling . . . 14
1.8 Insulin Resistance . . . 17
1.9 The Ventromedial Hypothalamus and Steroidogenic factor 1 . . . 20
1.10 Counter-regulatory Response to Hypoglycemia . . . 21
1.11 Objectives . . . 24
2 Materials and Methods 25 2.1 Mouse experiments . . . 25
2.1.1 Animal care . . . 25
2.1.2 Experimental mice . . . 25
2.1.3 Food intake and indirect calorimetry . . . 26
2.1.4 Blood collection and determination of glucose levels . . . 26
2.1.5 Analysis of body composition . . . 27
2.1.6 Glucose and insulin tolerance test . . . 27
2.1.7 Leptin sensitivity . . . 27
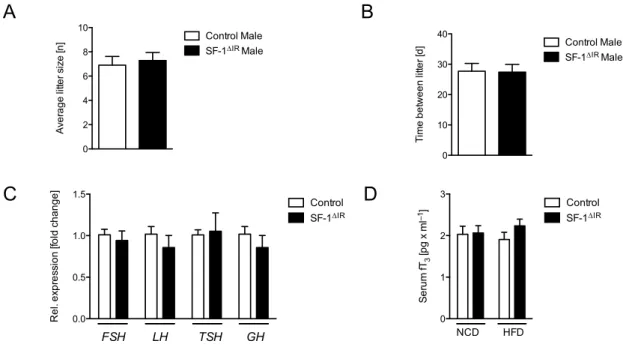
2.1.8 Fertility assesment . . . 27
2.1.9 Hypoglycemic Clamp studies . . . 28
2.2 Molecular biology . . . 29
2.2.1 Isolation of genomic DNA . . . 29
2.2.2 Quantification of nucleic acids . . . 29
2.2.3 Polymerase chain reaction (PCR) . . . 29
2.2.4 RNA extraction, RT-PCR and quantitative real-time PCR . . . 31
2.3 Cell biology . . . 31
2.3.1 Histological analysis and immunohistochemistry . . . 31
2.3.2 Analysis of PiP3accumulationin situ . . . 33
2.3.3 Combinedin situhybridization and immunohistochemistry . . . . 34
2.3.4 Electrophysiology . . . 35
2.3.5 Electron microscopy . . . 35
2.4 Biochemistry . . . 37
2.4.1 Protein extraction . . . 37
2.4.2 Western blot analysis . . . 37
2.4.3 Enzyme-linked immunosorbent assays (ELISA) . . . 38
2.5 Computer analysis . . . 38
2.5.1 Densitometrical analysis . . . 38
2.5.2 Statistical methods . . . 39
2.6 Chemicals and biological material . . . 39
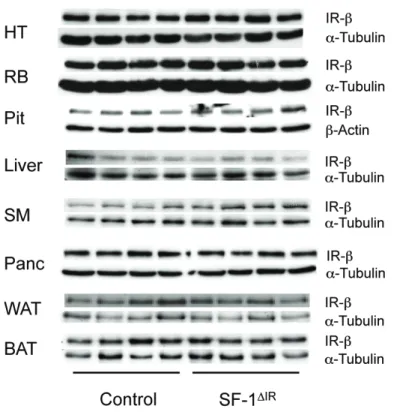
3 Results 42 3.1 Generation of SF-1 specific insulin receptor knockout mice . . . 42
3.2 Insulin silences VMH SF-1 neurons via KATPchannels . . . 49
3.3 Insulin and leptin responsive SF-1 neurons are distinct sub-populations . 50 3.4 Attenuated obesity in SF-1∆IRmice upon high-fat diet feeding . . . 52
3.5 Reduced food intake as consequence of increased leptin sensitivity in young SF-1∆IRmice . . . 54
3.6 Improved glucose metabolism in SF-1∆IRmice upon HFD-feeding . . . 56
3.7 Increased PiP3formation in the VMH promotes weight gain . . . 58
3.8 Increased firing frequency of POMC neurons in SF-1∆IRmales under HFD
conditions . . . 62
3.9 Counterregulatory response to hypoglycemia . . . 66
4 Discussion 69 4.1 Successful generation of SF-1 cell specific insulin receptor knockout mice . 71 4.2 Insulin electrically inhibits SF-1 neurons via KATPchannels . . . 73
4.3 Attenuation of obesity upon SF-1 specific IR deficiency . . . 74
4.4 Improved glucose metabolism in SF-1∆IRmales on HFD . . . 76
4.5 PiP3formation in SF-1 VMH neurons promotes obesity . . . 76
4.6 Unaltered expression of hypothalamic neuropeptides, but increased activ- ity of POMC neurons . . . 78
4.7 Impaired counter-regulatory response to hypoglycemia in SF-1∆IRanimals 82 4.8 Perspectives . . . 84
List of Figures 87
List of Tables 88
Bibliography 89
Danksagung 120
Erklärung 121
Teilpublikationen 122
Curriculum Vitae 123
Abbreviations
◦C degree celcius
3’ three prime end of DNA sequence 5’ five prime end of DNA sequence
A adenosine
aCSF artificial cerebrospinal fluid AgRP agouti-related protein AKT protein kinase B ARC arcuate nucleus
ATP adenosine triphosphate
Avertin tribromoethyl alcohol andtert-amyl alcohol BAT brown adipose tissue
BMI body mass index bp base pairs
C cytosine
CaCl2 calcium cloride
cAMP cyclic adenosine mono-phosphate cDNA complementary DNA
CNS central nervous system
Cre bacteriophage P1 derived site-specific recombinase (causes recombination)
Da Dalton
DAPI 4,6-diamidino-2-phenylindole ddH2O double distilled water
DMH dorsomedial hypothalamic nucleus DMSO dimethylsulfoxide
DNA desoxyribonucleic acid
dNTP desoxyribonucleotide-triphosphate e.g. exempli gratia
ECL enhanced chemoluminiscence EDTA ethylendiamine tetraacetate EGTA ethylene glycol tetraacetic acid EIA enzyme immunoassay
ELISA enzyme-linked immunosorbent assay EtBr ethidium bromide
EtOH ethanol fl loxP flanked
FOXO1 forkhead-O transcription factor 1
g gram
G guanine
GABA γ-aminobutyric acid GDP guanosine bisphosphate GFP green fluorescent protein GLUT2 glucose transporter 2 GLUT4 glucose transporter 4
Grb2 growth factor receptor binding protein 2 GTP guanosine triphosphate
GTT glucose tolerance test Gusb glucuronidase beta
h hour
H&E hematoxylin/eosin H2O2 hydrogen peroxide HCl hydrochloric acid
HEPES N-2-hydroxyethylpiperazine-N-2-ethansulfonic acid
HFD high fat diet
Hprt-1 hypoxanthine guanine phosphoribosyl transferase 1
Hz Hertz
i.e. id est
icv intracerebroventricular IL interleukin
i.p. intraperitoneal IR insulin receptor
IRES internal ribosomal entry site IRS insulin receptor substrate ITT insulin tolerance test JAK janus kinase
k kilo
KCl potassium chloride KOH potassium hydroxide
l liter
lacZ gene encodingβ-galactosidase lepR-b leptin receptor isoform b LH lateral hypothalamic nucleus
loxP recognition site for Cre (locus of x-ing over phage P1)
m milli
M molar
MAPK mitogen-activated protein kinase MC4R melanocortin 4 receptor
MCH melanocyte conentrating hormone ME median eminence
MgCl2 magnesium chloride
min minute
mRNA messenger RNA
α-MSH alpha melanocyte-stimulating hormone Na2HPO4 disodium hydrogen phosphate
NaCl sodium chloride NaF sodium fluoride
NAH2PO4 monosodium phosphate NaHCO3 sodium bicarbonate NaOH sodium hydroxide NCD normal chow diet
NIRKO neuronal insulin receptor knockout mice NMR nuclear magnetic resonance
NPY neuropeptide Y
ORX orexin / hypocretin
p- phospho-
PAGE polyacrylamide gel electrophoresis PBS phosphate buffered saline
PCR polymerase chain reaction
PDK1 phosphoinositide-dependent protein kinase 1
PFA paraformaldehyde
PH pleckstrin homology PI3K phosphoinositide 3-kinase
PiP2 phosphatidylinositol-(4,5)-bisphosphate PiP3 phosphatidylinositol-(3,4,5)-triphosphate POMC proopiomelanocortin
PTB phosphotyrosine binding
PTB1B protein tyrosine phosphatase 1 B PTEN phosphatase and tensin homolog PVN paraventricular nucleus
RNA ribonucleic acid RNase ribonuclease RT room temperature
rtPCR reverse transcription polymerase chain reaction SDS sodiumdodecylsulfate
sec second
SEM standard error of the mean SH src homology
SOCS suppressor of cytokine signaling
STAT signal transducer and activator of transcription T2DM type 2 diabetes mellitus
TAE tris-acetic acid-EDTA buffer TE tris-EDTA buffer
Tris 2-amino-2-(hydroxymethyl)-1,3-propandiole TWEEN polyoxethylene-sorbitan-monolaureate tyr tyrosine
U units
V volt
v/v volume per volume
VCO2 volume of produced carbondioxide
VMH ventromedial nucleus of the hypothalamus VO2 volume of consumed oxygen
w/v weight per volume WAT white adipose tissue WHO world health organization
x-gal 5-bromo-4-chloro-indolyl-β-D-galactopyranoside β-gal β-galactodidase
β-me β-mercaptoethanol
Abstract
Growing evidence from the last decades intimately links obesity with insulin resistance and type 2 diabetes mellitus as a consequence. Thus, the role of the central nervous sys- tem and especially the hypothalamus in the control of energy homeostasis are intensively investigated. The melanocortin system has been identified as a pivotal neurocircuit in this homeostatic process, but many other neuronal populations are similarly involved.
Furthermore, the role of insulin as adiposity signal in the control of energy homeostasis has to be further clarified. In particular, steroidogenic factor 1 (SF-1)-expressing neu- rons of the ventromedial hypothalamus (VMH) control energy homeostasis, but the role of insulin action in these cells remains undefined. This study shows that insulin acti- vates phosphatidylinositol-3-kinase (PI3K) signaling in SF-1 neurons and reduces firing frequency in these cells by the activation of ATP-dependent potassium (KATP) channels.
These effects were abrogated in mice with Cre-mediated insulin receptor deficiency re- stricted to SF-1 neurons (SF-1∆IR mice). Whereas body weight and glucose homeosta- sis remained the same in SF-1∆IR mice as in controls on a normal chow diet, they were protected from diet-induced leptin resistance, weight gain, adiposity and impaired glu- cose tolerance. High-fat feeding activated PI3K signaling in SF-1 neurons of control mice, and this response was attenuated in the VMH of SF-1∆IR mice. Mimicking diet- induced overactivation of PI3K signaling by disruption of the phosphatidylinositol-3,4,5- trisphosphate phosphatase PTEN led to increased body weight and hyperphagia under normal chow diet conditions. Collectively, this study reveals that high-fat diet–induced, insulin-dependent PI3K activation in VMH neurons contributes to obesity development.
Additionally, insulin was identified as a necessary signal in SF-1 VMH neurons in- volved in the induction of the counter-regulatory response to hypoglycemia, one of the major limitations for insulin treatment in diabetic patients.
Zusammenfassung
Zunehmende Erkenntnisse der letzten Jahrzehnte konnten zeigen, dass Übergewicht und Insulin Resistenz, mit Typ 2 Diabetes Mellitus als Folge, stark assoziierte Zustände sind.
Deshalb werden die Rolle des zentralen Nervensystems und speziell des Hypothalamus in der Kontrolle der Energie Homöostase intensiv erforscht. Das Melanokortin System in- nerhalb des Hypothalamus wurde als zentrales neuronales Netzwerk für diesen homöo- statischen Prozess identifiziert. Die Effekte von Insulin als Sättigungssignal innerhalb des Gehirns waren ebenfalls Gegenstand der Forschung der letzten Jahre. Des weit- eren wurden Steroidogenic Factor 1 (SF-1) exprimierende Neuronen innerhalb des ven- tromedialen Hypothalamus (VMH) als beteiligte Neuronenpopulation in der Kontrolle der Energie Homöostase identifiziert, jedoch wurde die Rolle des Insulinsignalwegs in diesen Zellen bisher noch nicht erforscht. Die vorliegende Arbeit konnte zeigen, dass Insulin in SF-1 Neuronen den Phosphatidylinositol-3-kinase (PI3K) Signalweg stimuliert und damit die Aktivität dieser Neurone durch das Steuern von ATP-abhängigen Kalium (KATP) Kanälen herabsetzt. Dieser Effekt war in Mäusen denen der Insulinzezeptor in SF-1 exprimierenden Neuronen fehlt (SF-1∆IR) nicht mehr vorhanden. Diese Defizienz hatte unter normalen Fütterungsbedingungen keine Auswirkungen, wurden die Mäuse jedoch mit einer fettreichen Diät gefüttert, waren SF-1∆IRTiere zum Teil vor Ernährungs- bedingter Gewichtszunahme, Leptinresistenz, Fettleibigkeit und Glukoseintoleranz geschützt.
Die Deletion der PI3K-spezifischen Phosphatidylinositol-3,4,5-trisphosphate Phosphatase PTEN dagegen führte zu Übergewicht und Hyperphagie unter Normal-Futter Bedin- gungen, da die durch fettreiche Ernährung bedingte Überaktivierung der PI3K imitiert wird. Zusammenfassend konnte wurde gezeigt, dass die ernährungs-bedingte Überak- tivierung der PI3K in VMH SF-1 Neuronen zur Entwicklung von Übergewicht beiträgt.
Des Weiteren konnte gezeigt werden, dass der Insulinsignalweg in SF-1 Neuronen für die Aktivierung der Leber-spezifischen Glukoneogenese zur Verhinderung von Hypo- glykämie, welches eine der Hauptkomplikationen der Insulintherapie darstellt, notwendig
1 Introduction
1.1 Obesity
Energy homeostasis in the body is a tightly regulated process. In order to maintain an adequate body weight, energy intake and energy expenditure are kept in balance. Obe- sity, in contrast, is the consequence of a sustained positive energy balance. That means to consume more calories than an organism is spending, resulting in excessive storage of lipids in the expanded adipose tissue.
From an evolutionary perspective, obesity is actually a favorable condition. To store energy in the form of adipose tissue in good and plentiful times in order to survive peri- ods of deprivation or starvation has almost exclusively benefits for the organism. Espe- cially for seasonal active animals these energy depots are mandatory and the only way to survive the winter or other deprivation periods.
Also for humans these facts hold true, but the living conditions have changed dramat- ically in the last centuries. The availability of food has increased due to the industrial revolution and the globalization of our society, resulting in the disappearance of food deprivation (at least in the highly developed countries). Additionally, the energy density of the available food has increased massively over the last decades. In the 1970s in the USA, the average caloric intake per day was 2234 calories. Until 2003 it has raised to 2757 calories per day, an increase of almost 25 percent (Hodan & Buzby, 2005).
Besides, a more sedentary lifestyle in western societies with reduced physical work further contributes to a positive energy balance. As a net effect of the above mentioned factors, the average body mass index (BMI) in Europe and the USA has increased over the last 40 years, resulting in an obesity rate of 40 percent (defined by a BMI of above 30) in the USA and more than 30 percent in Europe (Berghöferet al., 2008). Worldwide, the total number has risen to 1.4 billion overweight (defined as a BMI above 25) and 200 million obese people (WHO, 2012). This sustained obesity is associated with a risk to develop severe metabolic disorders, such as Type 2 Diabetes Mellitus (T2DM) and cardiovascular
1 Introduction
diseases, and it also pre-disposes for other diseases such as cancer, osteoarthritis, non- alcoholic fatty liver disease and obstructive sleep apnea (Dixon, 2010; Mokdad et al. , 2003). The overall health costs caused by obesity-associated disorders already exceeded 10 billion e in 2008 and the World Health Organization estimates that every year 2.8 million adults die as a consequence of being obese or overweight (WHO, 2012). Thus, obesity is already considered a pandemic of the 21st century and is a major health burden in the western civilizations.
1.2 Regulatory Mechanism of Energy Homeostasis
In a healthy subject the caloric intake is adjusted and adapted to the amount of used energy and the current storage status of the body. Vice versa, the expended energy is also adapted to the food availability and nutrient status, assuming a regulatory signal from the body, that reflects its energy status to the brain. This has been proposed more than 40 years ago (Coleman, 1973; Coleman & Hummel, 1969), and research in the last decades verified this hypothesis by the discovery of several peripheral hormones involved in this regulatory process (Batailleet al., 1981; Brüninget al., 2000; Kojimaet al., 1999; Lacquaniti et al., 2011; Orskovet al., 1994; Tatemoto & Mutt, 1980; Zhanget al., 1994).
One of the major regulators in this homeostatic process is the anorectic hormone lep- tin. It is mainly produced by adipocytes in the white adipose tissue (Margeticet al., 2002).
This hormone reflects the amount of stored energy in the form of fat to the brain, which then integrates this information and adjusts food consumption and energy expenditure to the current needs (Friedman, 1998). However, due to the beforehand mentioned changes in modern lifestyle, in millions of humans these regulatory mechanism fail, resulting in overweight and finally in chronic obesity (Considineet al., 1996).
Upon its discovery, leptin was assumed to be the ultimate cure for obesity (Campfield et al., 1996). But just a few years later the disillusioning discovery was made that obese patients actually have massively increased circulating leptin levels compared to lean pa- tients (Considine et al. , 1996), indicating that these obese subjects are leptin resistant (Heymsfieldet al., 1999). Thus, except for a very few people carrying a mutation in their endogenousLeptin gene, leptin alone is not suitable as therapeutic treatment for obese
1 Introduction
humans (Farooqi & O’Rahilly, 2004). But in combination with other peptide hormones, such as Amylin, it is possible to restore leptin sensitivity and hence enable a leptin medi- ated weight loss (Rothet al., 2008). Although leptin resistance was discovered more than a decade ago, it is still unclear which exact mechanisms or signaling pathways lead to the development of leptin resistance. It has become obvious that both the transport across the blood-brain barrier (BBB) to the brain and the intracellular signaling are impaired (El-Haschimiet al., 2000).
In addition to leptin, various other hormones are involved in this regulatory process, such as insulin and ghrelin. The pancreatic hormone insulin exerts many of its effects in the periphery, but also induces satiety when applied to the central nervous system (CNS) (Blüheret al., 2002; Brüninget al., 1998; Michael et al., 2000; Woodset al., 1979). Fur- thermore, insulin signaling in the brain plays a crucial role in maintaining energy home- ostasis as well as reproduction (Brüninget al., 2000; Hallschmidet al., 2004; Havrankova et al., 1978b; Porte & Woods, 1981; Woodset al., 1979). The best characterized hormone stimulating food intake is ghrelin. It is mainly produced by the stomach and the gut upon nutrient deprivation and likewise signals to the brain, leading to an increase in food intake (Kojimaet al., 1999).
Eventually, it is the brain that orchestrates all these different hormonal signals and furthermore draws the appropriate conclusions to adjust feeding and energy expenditure to the current needs.
1.3 Neuronal Circuits in the Hypothalamus controlling Energy Homeostasis
In the beginning of the twentieth century, obesity, as a feature of certain clinical symp- toms, was discussed to result from either defects in the pituitary gland or in the CNS, particularly the hypothalamus. The Fröhlich syndrome, a pituitary tumor, was a disease pattern associated with obesity and hypogonadism, that pointed towards the pituitary gland as main regulator of energy homeostasis (Fröhlich, 1901). The experiments of Het- herington and Ranson finally ended this debate when they electrolytically lesioned the hypothalamus of rats stereotactically without affecting the pituitary gland, resulting in
1 Introduction
morbidly obese animals (Hetherington & Ranson, 1940). These findings were further de- fined by other groups in the following decades, using refined lesioning techniques for their experiments. The Ventromedial Nucleus of the Hypothalamus (VMH) was spec- ified as a satiety center, together with the Paraventricular Nucleus (PVN) (Gold, 1973;
Stevensonet al. , 1950). The VMH-derived signals were believed to be transmitted via the abdominal vagus nerve by sympathetic and parasympathetic innervations to the in- testinal tract, verified by the lesioning of the VMH with a simultaneous vagotomy of the abdominal vagus nerve below the diaphragm. The subdiaphragmal vagotomy pre- vented the effects of the VMH lesioning and the rats stayed lean and normophagic (Inoue
& Bray, 1977; Opsahl & Powley, 1974). In contrast, lesions in the Lateral Hypothalamus (LH) led to hypophagia (Anand & Brobeck, 1951).
The role of the LH as feeding center was refined by lesion experiments with kainic acid, but the exact role of certain neuronal populations remained elusive until the 1990s (Grossmanet al., 1978; Strickeret al., 1978). With the discovery of the LH specific hor- mones orexin (ORX) and melanocyte concentrating hormone (MCH), the first neuropep- tides were identified that increased their mRNA levels upon fasting (Bittencourtet al., 1992; de Leceaet al., 1998; Sakuraiet al., 1998). Injection of these peptides into the brain induced food intake and a knockout of MCH resulted in lean mice when compared to controls, hence establishing the LH as phagic center in the hypothalamus (Quet al., 1996;
Sakuraiet al., 1998).
As mentioned earlier, the PVN, the VMH and the adjacent arcuate nucleus (ARC) were defined as possible satiety centers. By systemic injections of toxic glucose analogs, the ARC and the VMH were destroyed, resulting in hyperphagic and obese animals (Debons et al., 1962; Olney & Sharpe, 1969). Due to their location at the median eminence (ME), which serves as the "window" of the BBB that can be passed by larger proteins (Broadwell
& Brightman, 1976), neurons in these areas are able to sense hormones and nutrients from the periphery. Furthermore, the ARC and the VMH are in direct proximity of the third ventricle, which exposes them to neuropeptides from the cerebrospinal fluid. The discovery of leptin brought further insights into the hypothalamic regulation of energy homeostasis, as intensive c-Fos immunoreactivity could be observed in the ARC after a
1 Introduction
peripheral injection of leptin (Elmquistet al., 1997, 1998b; Van Dijket al., 1996; Woods &
Stock, 1996). Together with the targeted deletion of the melanocortin 4 receptor (MC4R), the discovery of mutations in the MC4R in obese patients, the identification of its ligand α-melanocyte stimulating hormone (α-MSH) and its antagonist agouti-related peptide (AgRP) the ARC was established as primary center in the CNS-mediated regulation of energy homeostasis (Fanet al., 1997; Huszaret al., 1997; Vaisseet al., 1998).
LH DMH
PVN
3V
ME
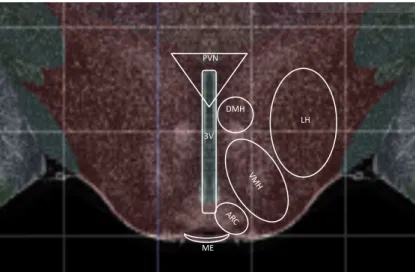
Figure 1.1:Schematic overview of hypothalamic nuclei.
Image taken from Allen mouse brain atlas (Allen institute for brain science, Seattle, USA). De- picted are hypothalamic nuclei that are involved in the regulation of food intake, energy expen- diture and substrate utilization. 3V, third ventricle; ARC, arcuate nucleus; DMH, dorsomedial hypothalamic nucleus; LH, lateral hypothalamus; ME, median eminence; PVN, paraventricular nucleus; VMH, ventromedial nucleus of the hypothalamus.
1.4 The Melanocortin System
The melanocortin system is a neurocircuitry that regulates energy balance. Of great im- portance are neurons that are located in the ARC of the mediobasal hypothalamus (Fan et al., 1997). This region shows a high expression of receptors for various hormones in- cluding leptin and insulin and lies in the direct proximity of the third ventricle and the
1 Introduction
median eminence, hence exposing it to signals from the cerebrospinal fluid (CSF) and the circulation (Baskinet al., 1993; Broadwell & Brightman, 1976; Elmquistet al., 1998a;
Merceret al. , 1996a,b; Obiciet al., 2002b; Wang et al. , 2002). Access to the latter one is of critical importance for the aforementioned signals from the periphery. Two func- tionally opposing neuronal populations are located in the ARC, which are the catabolic anorexigenic Pro-opiomelanocortin (POMC) expressing neurons and the anabolic orexi- genic Agouti-related Peptide (AgRP) expressing neurons (for review see Butler (2006)).
These two neuronal populations are first order neurons. They are able to sense hormones such as leptin, insulin and ghrelin, but are also sensitive to changes in the level of blood glucose and other metabolites and process these signals to other brain areas, leading to an adaptation of thermoregulation, feeding and energy expenditure (Belgardtet al., 2008;
Cowleyet al., 2001, 2003; Hillet al., 2010; Kimet al., 2000c; Mounienet al., 2010; Nakazato et al., 2001).
POMC is translated as a precursor peptide, which gets cleaved in several steps by cell type-specific pro-hormone convertases into the biologically active alpha-Melanocyte Stimulating Hormone (α-MSH) and other neuropeptides (β-endorphin, β-MSH,γ-MSH and ACTH) (Collet al., 2004; Millington, 2006). α-MSH can bind to MC4Rs, which are G-protein coupled receptors, and thereby activate the adenylate cyclase, leading to an increase of intracellular cyclic Adenosine Mono-Phosphate (cAMP) (Carusoet al., 2012).
The release ofα-MSH into the target areas of POMC neurons, such as the paraventricular nucleus (PVN), and the binding to MC4Rs leads to a decreased food intake and an in- creased energy expenditure (Giraudoet al., 1998; Kimet al., 2000a,b; Wirthet al., 2001).
Although the further downstream mechanisms are still under investigation, most likely thyrotropin releasing hormone (TRH) and corticotropin releasing hormone (CRH) pro- ducing neurons in the PVN and in the dorsomedial hypothalamus (DMH) play a role in the signal processing and further signal transduction (Kublaouiet al., 2006; Luet al., 2003; Sarkaret al., 2002). These are brain areas in the direct proximity of the ARC, show a high expression of MC4Rs and have been shown to be projection sites of POMC neu- rons (Kimet al., 2000a,b). Furthermore, mutations of the MC4R or POMC in humans is highly associated with the development of morbid obesity, highlighting the pivotal role
1 Introduction
of POMC neurons and MC4Rs in the regulation of energy homeostasis (Collet al., 2004;
Farooqiet al., 2000; Yeoet al., 1998).
The opposing neuron populations in the ARC are the orexigenic AgRP expressing neurons, that co-express neuropeptide Y (NPY). They inhibit POMC neurons in two dif- ferent ways. On the one hand, by a direct inhibition of POMC neuron firing activity via inhibitory GABAergic projections on POMC neurons, and on the other hand by an inhi- bition of MC4Rs on their target neurons by the release of AgRP, which acts as a MC4R an- tagonist (Aponteet al., 2011; Atasoyet al., 2012; Kimet al., 2000b; Tang-Christensenet al.
, 2004). The latter mechanism seems to be the more important one, since a mutation in the agoutigene, that results in an overexpression, leads to hyperphagic and obese mice (Ay) (Ollmann, 1997). Latest electrophysiological and optogenetics experiments confirmed these findings (Atasoyet al. , 2012). In contrast, NPY is expressed abundantly in the brain. It is a potent stimulator of feeding, but its action does not seem to be limited to the ARC and the melanocortin system (Sahuet al., 1988; Stanleyet al., 1986).
The important role of POMC and AgRP neurons in the regulation of energy homeosta- sis has been demonstrated by ablation experiments, where mice, carrying a transgenic Diphtheria Toxin A (DTA)-receptor exclusively on AgRP or POMC neurons, were in- jected with DTA to ablate these neurons. AgRP neuron ablated mice reduced their food intake dramatically, leading eventually to death by starvation if not rescued by force- feeding (Luquetet al. , 2005). In contrast, ablation of POMC neurons results in hyper- phagia (Groppet al., 2005). Other experiments could show that AgRP neurons influence locomotor behavior, e.g. by a constant activation of the Stat3 signaling pathway in AgRP neurons of mice. These mice were leaner due to an increased locomotor activity in the night phase (Mesaroset al., 2008).
Besides the mere physiological effects on feeding and locomotor behavior, recent ev- idence suggests that the melanocortin system is also connected to higher brain func- tions, such as reward and addiction related behavior by direct and indirect connections to dopaminergic neurons in the midbrain (Dietrichet al., 2012).
Collectively, the melanocortin system has a pivotal role in the regulation of energy
1 Introduction
homeostasis, although higher brain functions, especially in humans, might be able to overrule these signals (figure 1.2).
POMC AgRP
2nd order neurons
White adipose tissue Pancreas Leptin Insulin
GABA
α-MSH AgRP
GABA
Hepatic glucose
production Food intake
MC4R
Energy expenditure
Blood glucose Hypothalamus
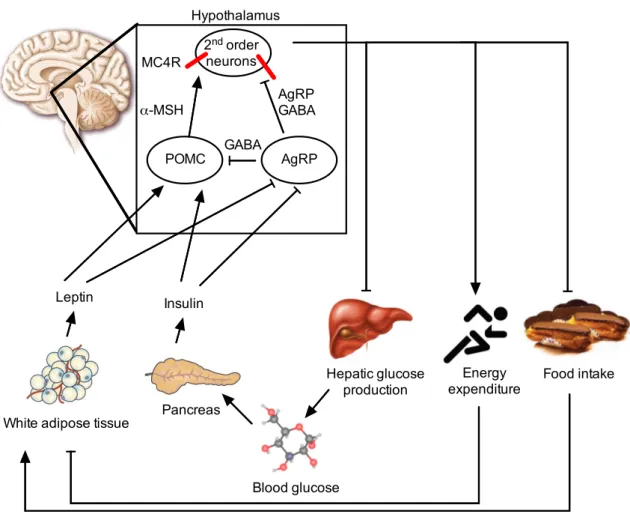
Figure 1.2:Schematic overview of the hypothalamic melanocortin system.
Adiposity signals, such as leptin and insulin are secreted in the periphery and transported across the BBB to first order neurons in the hypothalamus, anorexigenic POMC and orexigenic AgRP neurons. Both insulin and leptin on the one hand increase POMC transcription and firing rate of POMC neurons and on the other hand inhibit AgRP transcription and activity of these neurons.
POMC neurons release their neurotransmitterα-MSH, that binds to MC4R on second order neu- rons (e.g. in the PVN), and thereby stimulates energy expenditure and inhibits food intake and hepatic glucose production. AgRP inhibits POMC neurons in two ways: by direct inhibition of POMC neurons via GABAergic synapses and by GABA and AgRP, a MC4R antagonist, release to second order neurons, leading to increased food intake, elevated hepatic glucose production and reduced energy expenditure.
α-MSH, alpha-melanocyte stimulating hormone; AgRP, agouti-related peptide;
GABA,γ-aminobutyric acid; MC4R, melanocortin 4 receptor; POMC, pro-opiomelanocortin.
1.5 Leptin and Leptin Signaling
Leptin is a 16 kDa peptide hormone, mainly produced in the adipose tissue of mammals and secreted into the circulation in proportion to the body fat content (Frederichet al.,
1 Introduction
1995; Maffeiet al., 1995). Minimal expression was also reported in the placenta, skeletal muscle, pancreas and some areas of the brain (Badoet al., 1998; Masuzakiet al., 1997).
It was discovered and cloned in 1994 as product of theobesegene (Zhanget al., 1994).
A homozygous mutation in theobesegene leads to severe and morbid obesity amongst the affected animals (Ingallset al., 1950). In parabiosis experiments, researchers were able to curtail the mutation to a circulating hormone (Coleman, 1973; Coleman & Hummel, 1969; Harris, 1999). When anob/obmouse was parabiosed to a wildtype mouse, theob/ob mouse lost weight and eventually became lean as the wildtype mouse. The positional cloning led to the discovery of the affected gene and its product leptin (greek: leptos= lean) (Zhanget al., 1994).
Leptin signals via its receptor, the leptin receptor (LepR), which belongs to the family of class I cytokine receptors (Chuaet al., 1997). As with its ligand, the LepR was also discovered by a spontaneous mutation in mice (Chenet al. , 1996; Tartagliaet al., 1995).
Mice carrying the mutation were severely diabetic and obese, thus the gene was named diabetes. Whendb/dbmice were parabiosed to wildtype mice, the wildtype mice starved to death due to the high circulating leptin concentrations derived from the massive amount of adipose tissue in thedb/dbmouse (Coleman, 1973; Coleman & Hummel, 1969; Harris, 1999).
LepRs exist in different isoforms produced by alternative mRNA splicing, but only its long form (LepRb) is able to induce an intracellular signaling cascade (Chenet al. , 1996; Chuaet al., 1997; Tartaglia, 1997; Tartagliaet al., 1995). As shown in a transgenic complementation experiment, only the LepRb is able to rescue the phenotype of thedb/db mouse (Kowalskiet al., 2001). The role of the other isoforms is still under debate, but they might play a role in the saturable transport across the BBB or in the clearance of leptin from the circulation as soluble receptors (Hilemanet al., 2002; Uotaniet al., 1999).
When leptin binds to the LepRb, it induces an intracellular signaling cascade via the JAK-STAT pathway (figure 1.3). Upon ligand binding, the receptor associated Janus Ki- nase (JAK) 2 auto-phosphorylates itself and also phosphorylates the intracellular domain of the receptor at multiple tyrosine residues (p-Tyr), which serve as binding sites for sig- nal transducer and activator of transcription (STAT) proteins (in case of leptin: STAT3)
1 Introduction
(Tartaglia, 1997; Whiteet al., 1997). The STAT proteins are thereby phosphorylated, lead- ing to their homo-dimerization, the exposure of a nuclear-localization domain and conse- quently to the nuclear import, where STAT proteins can bind to the promotor of various genes and exert their function (either repression or activation of transcription) (Banks et al., 2000; Boulton et al. , 1995; Lüttickenet al. , 1994; Stahl & Yancopoulos, 1994). In POMC neurons, leptin induced binding of STAT3 to the promotor of POMC is necessary to activate transcription of the POMC gene and the deletion of STAT3 in POMC neurons results in modest obesity and reduced POMC expression levels (Gaoet al., 2004; Xuet al.
, 2007).
Leptin exerts most, but not all, of its functions in the brain. The deletion of LepRs in the brain leads to severe obesity, but does not reflect the complete phenotype ofob/ob ordb/dbmice (Cohenet al., 2001). The transgenic re-expression of LepRb in the brain is sufficient, though, to partially or completely restore fat mass, food intake, reproductivity and glucose tolerance indb/db mice, depending on the promotor that was used for the transgene (de Luca et al., 2005; Kowalski et al. , 2001). Together with the discovery of the melanocortin system, POMC and AgRP neurons were thought to be the main target for leptin, due to their role as first order neurons. But the deletion of the LepR in POMC neurons resulted only in modest obesity (Balthasaret al., 2004), and the same holds true for the AgRP neuron specific LeprR deficiency (van de Wallet al., 2008). Hence, there must be other neuronal populations that mediate leptin’s effect on food intake and energy expenditure, e.g. neurotensin expressing neurons in the LH and dopaminergic neurons in the ventral tegmental area (VTA) (Domingoset al., 2011; Leinningeret al., 2011).
Another gene that is regulated by leptin induced STAT3 signaling is the suppressor of cytokine signaling (SOCS)-3. Its transcription is also induced by the binding of STAT3 to its promotor, but it acts as a negative regulator of JAK-STAT signaling by a competitive binding to the phosphorylated tyrosine residues of JAK2 (Bjorbaeket al., 1998; Endoet al.
, 1997; Howardet al., 2004). Thus, haploinsufficiency for SOCS-3 or the deletion of SOCS- 3 in POMC neurons results in enhanced leptin sensitivity, whereas the overexpression and constitutive activation of STAT3 leads to a constant increase in SOCS-3 expression
1 Introduction
and consequently to impaired leptin signaling (Ernstet al. , 2009; Howardet al. , 2004;
Kievitet al., 2006; Munzberget al., 2004).
In contrast to its action in anorexigenic POMC neurons, leptin signaling in AgRP neu- rons inhibits the transcription of AgRP mRNA but a lack of LepRs in AgRP neurons does not induce any changes in body weight and other metabolic parameters (Mizuno &
Mobbs, 1999; Van De Wallet al., 2008).
Leptin binding to its receptor is also able to induce other signaling cascades. Activated JAK2 is also able to phosphorylate insulin receptor substrate (IRS) proteins and therefore induce the PI3K pathway (Hillet al., 2008; Metlakuntaet al., 2011; Xuet al., 2005).
Besides changes on the transcriptional level, leptin is able to induce changes in the electrophysiological activity of neurons via non-specific cation-channels (Cowleyet al., 2001). However, this seems to be restricted to specific neuron populations, e.g. the POMC expressing neurons, but also neurons in the VMH (Dhillonet al., 2006).
Taken together, leptin signaling in the brain is mandatory for the maintenance of en- ergy homeostasis, although the exact neuronal populations for leptin’s anorectic action still need to be further defined.
1.6 Leptin Resistance
As mentioned before, leptin’s ability to reduce food intake and stimulate energy expen- diture is heavily impaired in obese subjects (Enrioriet al., 2007). Although obese rodents and humans display massively elevated leptin levels in the bloodstream, leptin is not able to induce an intracellular signaling cascade and hence fails to prevent further intake of calories or to induce energy expenditure (Heymsfieldet al., 1999). The molecular basis for the development of leptin resistance is still under investigation, but one important factor seems to be the negative regulator of leptin signaling, SOCS-3. Leptin induces the expression of SOCS-3 as a negative feedback loop (Endo et al., 1997; Naka et al. , 1997). As demonstrated by Ernst and colleagues, constant activation of STAT3 in POMC neurons leads to a massive increase in SOCS-3 mRNA levels, resulting in impaired lep- tin signaling in the affected neurons (Ernstet al., 2009). The deletion or knockdown of SOCS-3 and haploinsufficiency results in lean mice, that are resistant to diet-induced obe-
1 Introduction
Leptin
pY
STAT3 pY
pY pY pY
STAT 3 pY STAT3
pY NLS NLS NLS
STAT 3 pY STAT3
pY NLS NLS
LepR-b
SOCS-3
nucleus
p85
PIP2
PIP3 PDK1
AKT
SOCS-3
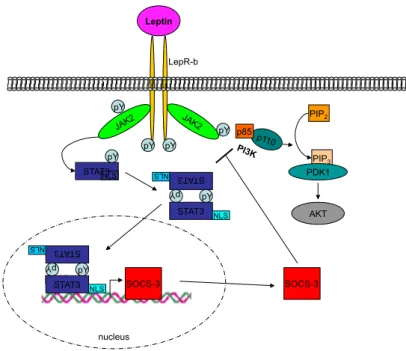
Figure 1.3:Leptin signaling pathway.
Upon leptin binding to LepRb, the associated JAK2 auto-phosphorylates itself and the LepRb at three tyrosine residues. This phospho-tyrosines act as binding site for signal transducer and ac- tivator of transcription STAT3, that is also phosphorylated by JAK2 (p-STAT3). p-STAT3 able to dimerize, thereby the NLS gets exposed and the homo-dimers translocate to the nucleus. When bound to its consensus sequence, p-STAT3 is able to induce the transcription of SOCS-3 to inhibit further signaling of LepRb. Activated JAK2 is also able to phosphorylate the PI3K and thereby activates the PI3K-pathway.
AKT, protein kinase B; IRS, insulin receptor substrate; JAK2, janus kinase 2; LepRb, leptin receptor isoform b; NLS, nuclear localization signal; PDK1, phosphoinositide dependent ki- nase 1; PI3K, phosphatidyl inositol 3 kinase; PiP2, phosphatidylinositol-(4,5)-bisphosphate; PiP3, phosphatidylinositol-(3,4,5)-triphosphate, STAT3, signal transducer and activator of transcription 3; SOCS-3, suppressor of cytokine signaling 3.
sity (DIO) (Björnholmet al., 2007; Howardet al., 2004; Liuet al., 2011). Due to the fact that leptin exerts most of its functions in the brain, a neuron specific SOCS-3 knockout already improves the effects of DIO and leads to enhanced leptin sensitivity (Moriet al.
, 2004). Therefore, it is possible that leptin itself is one of the main contributors to the development of obesity and leptin resistance by its own negative feedback loop.
Another molecule involved in the development of leptin resistance is protein tyrosine phosphatase (PTP)1B, a phosphatase that negatively regulates multiple signaling path- ways that are using receptor tyrosine kinases (Hajet al., 2002). PTP1B de-phosphorylates
1 Introduction
JAK2 and consequently shuts down further downstream signaling via STAT3. Similar to SOCS-3, neuronal inactivation of PTP1B decreases adiposity and improves leptin sensi- tivity in mice (Bannoet al., 2010; Benceet al., 2006).
The endoplasmatic reticulum (ER) is the main source for newly synthesized proteins, as the folding into the tertiary and quaternary structure is facilitated in this organelle. In states of obesity, a lot of proteins are mis-folded in the ER, leading to an activation of ER stress pathways in order to either re-fold these proteins or to convey them to proteasomal degradation (Blond-Elguindiet al., 1993; Chenet al., 2002). The induction of the unfolded protein response (UPR) activates several kinases as PERK and Ire1, leading to the tran- scriptional activation of chaperones and the general inhibition of translation (Bernales et al., 2006). If these ER stress pathways are impaired, obesity and leptin resistance are ameliorated (Ogimotoet al., 2006; Ozcanet al., 2009, 2004; Zhanget al., 2008b).
Besides these cell intrinsic mechanisms, the obesity associated activation of immune cells and inflammatory pathways also participate in the attenuation of leptin signaling.
Several pro-inflammatory cytokines, such as tumor necrosis factor (Tnf)α and multiple interleukins, have been shown to negatively regulate leptin signaling (Arrudaet al., 2011;
De Taeyeet al. , 2007; Deniset al. , 2010; Esposito et al. , 2003; Kern et al. , 2001). The activated kinases c-jun n-terminal kinase (JNK) and inhibitor of nuclear factor kappa-B kinase (IKK) seem to interfere with leptin’s ability to decrease food intake, as the global deletion of JNK1 ameliorates obesity (Hirosumiet al., 2002; Velloso et al., 2008; Zhang et al., 2008b). But also nutrients like saturated free fatty acids (FFA) are able to induce inflammatory signaling cascades via toll-like receptors (TLR)2 and 4 (Reynaet al., 2008;
Shiet al., 2006; Tsukumoet al., 2007). Kleinridders and colleagues could demonstrate that mice deficient for MyD88, an adaptor molecule used by all TLR isoforms, show improved leptin sensitivity when exposed to high-fat diet (HFD) (Kleinridderset al., 2009).
Although all these factors might contribute to the development of a systemic leptin resistance observed in obese patients and rodents, nutrient derived FFAs are a key factor in the initiation of diet-induced obesity associated inflammation (Cintraet al., 2012).
1 Introduction
1.7 Insulin and Insulin Signaling
Beside leptin, insulin is the best characterized hormone in the control of energy home- ostasis. Although it was discovered decades before leptin, insulin’s action was believed to be limited to the periphery, where its effects were intensively studied. However, to- wards the end of the seventies, studies indicated that insulin receptors are expressed and that signaling is functional in the brain (Havrankovaet al., 1978a,b, 1979).
Insulin was discovered by Banting and Best as a pancreatic extract for the treatment of diabetes (Bantinget al., 1922). It is produced by pancreaticβ-cells in the Langerhans islets as pre-proinsulin (Steineret al., 1967). Pre-proinsulin gets processed in two subsequent steps in the ER into the bioactive insulin, as which it is stored in cytoplasmatic secretory vesicles (Davidsonet al., 1988; Docherty & Hutton, 1983; Massagliaet al., 1968). To exert its functions in its target organs, insulin is secreted in a tightly controlled process. Upon meal ingestion blood glucose levels rise, leading to a nonspecific import into theβ-cells via glucose transporter (GLUT)2. Glucose gets metabolized into ATP via glycolysis and the citric acid-cycle, subsequently leading to the closure of ATP-dependent potassium (KATP) channels (Ashcroft, 2005). The resulting increase in potassium ions in the cytosol depolarizes the membrane potential and thereby activates voltage-gated calcium chan- nels. This triggers the fusion of secretory insulin vesicles with the plasma membrane (Ashcroft, 2006). Via the blood circulation, insulin is able to reach it target organs; mainly the liver, muscle and adipose tissue, but also the CNS. In the muscle and in adipocytes, insulin leads to the induction of an intracellular signaling cascade, enabling the translo- cation of an insulin dependent glucose transporter (GLUT4) to the plasma membrane and consequently to an uptake of glucose from the circulation, and further storage in the form of glycogen or fat (Blüheret al., 2002; Brüning et al., 1998; Shepherd & Kahn, 1999). In adipocytes, insulin prevents lipolysis by the transcriptional inhibition of lipases and simultaneously increases lipogenesis (Claycombeet al., 1998; Jaworski et al., 2007;
Kershawet al., 2006; Semenkovichet al., 1989). The major effect of insulin in the liver is to inhibit gluconeogenesis and glycogenolysis to prevent an additional rise in circulating glucose (Crosset al., 1995; Puigserveret al., 2003).
The insulin receptor (IR) is a tetrameric receptor tyrosine kinase that consists of two
1 Introduction
α- and twoβ-subunits, both synthesized by a single gene with 22 exons by proteolytic processing (Kasugaet al., 1982; Ullrichet al., 1985). It exists in two isoforms, IR-A and IR-B, which are generated by alternative splicing of exon 11, from which IR-B is mainly expressed in insulin target tissues (Beneckeet al., 1992; Molleret al., 1989; Seino & Bell, 1989).
Upon binding of insulin to the extracellularα-chain of the receptor, the receptor un- dergoes conformational changes and is thus able to auto-trans-phosphorylate itself at the intracellularβ-chains at various tyrosine residues (Kahnet al., 1978). These phosphoryla- tion sites then act as a docking platform for insulin receptor substrate (IRS) proteins that can bind via their phosphotyrosine binding (PTB) domains and in turn become phos- phorylated themselves (Ecket al., 1996; Miralpeixet al., 1992; Whiteet al., 1988). Ad- ditionally, IRS proteins contain a pleckstrin homology (PH) domain, that interacts with phospholipids and thereby targets IRS proteins to the plasma membrane (Burkset al., 1997, 1998; Jacobset al., 2001). Of the five known IRS isoforms, IRS 1 and 2 seem to be the most important ones in the transmission of the insulin signaling cascade (Lavanet al.
, 1997a,b; Sunet al., 1991, 1995).
Activated IRS proteins are able to induce several downstream signaling pathways, but the best characterized in respect to energy homeostasis is the phosphoinositide-3- kinase (PI3K) pathway. The PI3K can bind to the phosphorylated tyrosine residues of the IRS proteins with its rous sarcoma virus (Src)-homology (SH) 2 domain (Lavanet al.
, 1992), leading to a de-inhibition of the regulatory subunit p85 and thereby an activa- tion of the catalytic subunit p110 (Lavan & Lienhard, 1993; Myerset al., 1992, 1994a).
The activated PI3K is able convert phosphaditylinositol-(3,4)-bisphosphate (PiP2) into phosphaditylinositol-(3,4,5)-triphosphate (PiP3), which acts as a second messenger at the plasma membrane (Myerset al., 1993; Skolniket al., 1991; Whitmanet al., 1988). This is counteracted by the negative regulator of the PI3K pathway, the phosphatase and tensin homolog (PTEN). PTEN de-phosphorylates PiP3 back to PiP2, thereby negatively regu- lating the signaling pathway (Maehama & Dixon, 1998). PiP3recruits of the phosphadi- tyinositol dependent kinase 1 (PDK1) to the plasma membrane, which induces further downstream signaling, consequently leading to the phosphorylation and activation of
1 Introduction
the proteinkinase B (AKT). AKT is then able to phosphorylate, among others, the tran- scription factor forkhead box protein O1 (FOXO1) (Alessiet al., 1997a,b; Andersonet al., 1998; Casamayoret al., 1999; Currieet al., 1999; Pullenet al., 1998). FOXO1 is a transcrip- tion factor that is exported from the nucleus upon phosphorylation, gets ubiquitylated in the cytoplasm and finally degraded by the 26S proteasome (Huang & Tindall, 2007;
Linet al., 1997; Ogget al., 1997). In POMC neurons, FOXO1 and STAT3 have overlap- ping binding sites at the POMC promotor where FOXO1 inhibits, and STAT3 activates, transcription of the POMC gene. Therefore both insulin and leptin signaling in POMC neurons is necessary to fully activate transcription of POMC (Belgardtet al., 2008). In AgRP neurons FOXO1 and STAT3 have opposite effects. FOXO1 acts as activator and STAT3 as suppressor of the transcription of AgRP (Kitamuraet al., 2006).
The PI3K pathway serves as a convergence point of both leptin and insulin signaling.
Therefore it is difficult to curtail the effects of the PI3K pathway to either leptin or insulin.
Current results indicate that different isoforms of the PI3K might be responsible for either leptin’s or insulin’s effect on the downstream signaling (Hillet al., 2008, 2009), whereas for certain functions, especially in the brain, both are necessary to fully induce the PI3K pathway (Kochet al., 2010).
Beside the PI3K pathway, insulin is also able to activate the MAPK pathway. Phospho- tyrosine residues on IRS proteins act as a binding platform for the growth factor receptor- bound protein (Grb), that thereby activates the MAPK pathway (Myers et al. , 1994b;
Skolniket al., 1993). In contrast to the PI3K pathway, the MAPK pathway is considered to be more important in cell survival, proliferation and growth (figure 1.4) (Skolniket al.
, 1993; Wadaet al., 1998).
The importance of insulin signaling in the control of energy homeostasis is highlighted by multiple publications over the last decades. The specific deletion of IRs in the skeletal muscles reflects the symptoms of T2DM, showing that most of the glucose uptake is in- sulin dependent (Brüninget al., 1998). A similar phenotype was reported in mice lacking IRs in hepatocytes. These mice displayed severe hyperglycemia and systematic insulin resistance (Michaelet al., 2000). On the contrary, the adipose tissue specific knockout of the IR is protected against the development of obesity and consequently against T2DM,
1 Introduction
showing that insulin is a critical factor in the differentiation and expansion of adipocytes (Blüheret al., 2002; Kershawet al., 2006).
Besides these effects in peripheral tissues, insulin action in the brain is of great impor- tance in the control of energy homeostasis and reproduction. The neuron specific insulin receptor knockout (NIRKO) mouse is slightly obese and shows hypothalamic hypogo- nadism (Brüninget al. , 2000). Furthermore, insulin signaling in the brain has critical functions in the control of adipogenesis (Koch et al. , 2008; Scherer et al. , 2011). Fur- ther experiments allowed a deeper look into insulin’s action in the brain. By knocking out the IR in hypothalamic neuron populations, Könner and colleagues could show that insulin signaling in AgRP, but not in POMC neurons is necessary to suppress hepatic glu- cose production (Könneret al., 2007). In POMC neurons, insulin signaling is needed to fully activate the transcription of POMC, shown by the deletion of PDK1 (Belgardtet al.
, 2008). On the other hand, hyperactivation of the insulin pathway by a deletion of the phosphatase PTEN also results in overweight mice, leading to the hypothesis that insulin is able to silence POMC neurons via KATPchannels (Plumet al., 2006).
1.8 Insulin Resistance
The association of obesity with T2DM has been recognized over the last decades and resistance to the hormone insulin is one of the hallmarks in the progression of T2DM (Brüninget al. , 1997; Kahn, 1994a; Reaven, 1995). In initial and mild states of insulin resistance, the pancreatic β-cells are able to compensate the increased demand for in- sulin by an increased production and secretion of insulin. But insulin resistance is, if not treated, a progressing disorder leading to further demands of insulin to maintain eug- lycemia (Martinet al., 1992). This results in hyperplasia and increased secretion activity of the insulin producingβ-cells, that eventually collapse (Parsonset al., 1992; Pipeleers, 1992). Subsequently, insulin fails to suppress hepatic glucose production and to induce glucose uptake into muscle tissue and adipocytes, hence resulting in severely elevated blood glucose levels and finally in T2DM (Kahn, 1994b). Furthermore, T2DM predis- poses for associated diseases such as diabetic retinopathy, hypertension, angiopathy and
1 Introduction
Insulin
SOS Grb2
pY pY
pY pY
PO4
IRS 1-4
p85 pY
Ras GTP Ras GDP
GDP GTP
PIP2
PIP3 PO4
PTEN
PDK1
pY growth AKT
mitosis MAPK pathway
InsR
FOXO1 pY
FOXO1 Degradation
transcription metabolism proliferation
nucleus
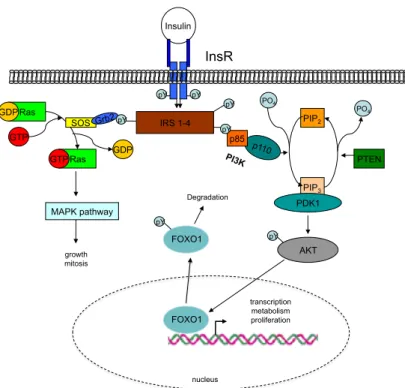
Figure 1.4:Insulin signaling pathway.
Binding of insulin leads to a conformational change of the IR, ending in activation of the intrin- sic kinase ability. After auto-phosphorylation of the IR, IRS proteins bind to the phosphorylated residues by their SH2 domains, and are themselves phosphorylated by the IR. Grb binds via its SH2 domain, eliciting activation of the Ras-Raf-MAPK signalling pathway, which mediates some of insulin’s effects on growth. Phosphorylation of IRS proteins allows binding of p85, the regula- tory subunit of the PI3K complex. This de-inhibits p110, the catalytic subunit of PI3K, which sub- sequently phosphorylates the membrane lipid PiP2to generate PiP3. PiP3accumulation in turn will recruit and allow binding of both PDK1 and AKT via their PH domains. After co-localisation induced by PiP3binding, PDK1 phosphorylates and thereby activates AKT, which mediates most of insulin’s effect on glucose and glycogen metabolism, as well as activating protein translation and gene transcription.
AKT, protein kinase B; FOXO1, forkhead-O transcription factor 1; Grb, growth factor recep- tor bound; IR, insulin receptor; IRS, insulin receptor substrate; MAPK, mitogen-activated pro- tein kinase; PDK1, phosphoinositide dependent kinase 1; PI3K, phosphoinositide 3-kinase; PiP2, phosphatidylinositol-(4,5)-bisphosphate; PiP3, phosphatidylinositol-(3,4,5)-triphosphate, STAT3, signal transducer and activator of transcription 3; Ras, Rat sarcoma protein; Sos, son of sevenless
neuropathy (Gastaldelliet al., 2000; Reaven, 1995; Semenkovich, 2006; van Leidenet al., 2002).
The full clinical manifestation of insulin resistance occurs only in rare monogenic dis- orders, such as Donohue or Rabson-Mendenhall syndrome. In these syndromes insulin resistance is caused by mutations or polymorphisms in insulin signaling molecules, such as AKT, PI3K or IRS proteins that impair the signaling downstream of the IR (Sempleet al.
1 Introduction
, 2011). But in the vast majority of patients, the exact molecular mechanisms underlying insulin resistance are not fully understood.
Obesity is associated with a chronic low-grade inflammatory state, indicated by ele- vated levels of pro-inflammatory cytokines such as Tnf-αand IL-6 in the blood circulation and in the white adipose tissue (WAT) (Hotamisligilet al., 1993; Wellen & Hotamisligil, 2005). These inflammatory cytokines induce intracellular stress-signaling cascades that lead to the activation of effector kinases such as JNK and IKK, that are able to inhibit insulin signaling by an inhibitory phosphorylation at serine residues of IRS proteins (Cai et al., 2005; Hirosumiet al. , 2002; Hotamisligilet al., 1996; Shoelsonet al. , 2003). Ser- ine phosphorylation of the IRS protein inhibits downstream signaling as it prevents the binding of IRS proteins to the IR by their PTB domain (Aguirreet al. , 2000, 2002; Paz et al., 1997). Consequently, the inhibition of inflammation or the deletion of the effector kinases improves insulin sensitivity (Belgardt et al., 2010; Hirosumi et al. , 2002; Sabio et al., 2008, 2009, 2010). But not only inflammatory cytokines are able to activate stress- signaling cascades. It has been shown that ER stress, beside impairing leptin’s action, is also able to induce insulin resistance via the unfolded-protein response (Bailly-Maitre et al. , 2010; Ozcanet al. , 2009, 2004; Zhang et al. , 2008b). Futhermore, FFAs, that are elevated in the circulation upon HFD-feeding, have been shown to induce intracellular JNK signaling via toll-like receptors (TLR) 2 and 4. Hence, deletion of TLR4 improves insulin sensitivity in muscle tissue of diet-induced obese mice (Daviset al., 2009; Radin et al., 2008; Shiet al., 2006). But FFAs are also able to activate via diacylglycerols pro- tein kinase C (PKC) isoforms that have been shown to interfere with insulin signaling by serine phosphorylation of IRS proteins (Bandyopadhyayet al., 2005; Benoitet al., 2009).
Another mechanism of FFA-induced insulin resistance is the activation of protein phos- phatase 2A (PP2A), that is able to de-phosphorylate AKT (Galboet al., 2011). Also the aforementioned unspecific phosphatase PTP1B is activated by FFAs and inflammation and impairs insulin signaling by de-phosphorylation of IRS proteins (Galboet al., 2011).
Consistently, PTP1B knockout mice are protected against diet-induced insulin resistance (Elcheblyet al., 1999).
Beside FFA, ceramides, a class of sphingolipids, are also implicated in the develop-
1 Introduction
ment of insulin resistance, possibly again by activating JNK and IKK (Chavez & Sum- mers, 2012).
1.9 The Ventromedial Hypothalamus and Steroidogenic factor 1
The Ventromedial Hypothalamus (VMH) was for a long time considered to be the most important satiety center in the brain. By either lesion experiments, leading to increased food intake and obesity, or by electrical stimulation, leading to anorexia, the importance of this nucleus in the regulation of energy homeostasis was demonstrated (Aravich &
Sclafani, 1983; Boyle, P. C. & Keesey, 1975; Hetherington & Ranson, 1940; Leibowitzet al.
, 1981; Olney & Sharpe, 1969; Stevensonet al., 1950). Researchers used the model of hy- pothalamic obesity for their investigations, which resulted from a lesioned VMH (Anand
& Brobeck, 1951; Brobeck, 1946).
Upon the discovery of the melanocortin system, the VMH was neglected by most researchers. Imprecise techniques and a lack of knowledge about the neurons in the ARC were considered to be the reason of the phenotype in hypothalamic obesity (probably the ARC was also lesioned in addition to the VMH). The VMH was then believed to be a possible projection target for POMC or AgRP neurons in the regulatory metabolic neurocircuitry that further process the melanocortin derived neuroendocrine signals (Fu
& van den Pol, 2008).
This view changed when the orphan receptorSteroidogenic Factor 1(SF-1) was discov- ered to be expressed in the VMH (Ikedaet al., 1994). Initial experiments revealed a lethal phenotype in mice with a whole body knockout due to a failure in the development of the adrenal glands (Sadovskyet al., 1995). But when these mice were rescued by a transplan- tation of adrenal glands, they developed severe obesity due to an absent VMH (Majdic et al., 2002). These results established SF-1 as a marker for the VMH.
In initial studies by Dhillon and colleagues in 2006, a transgenic mouse with the Cre recombinase under the control of the SF-1 promotor was created. They could show that the Cre is expressed predominantly in the VMH with minor expression in the adrenal gland, testis and pituitary gland. Using this transgenic mouse to delete the leptin re- ceptor specifically in VMH neurons revealed a direct role for leptin to regulate the elec-
1 Introduction
trophysiological activity of these neurons. Interestingly, the authors were able to show that the effect of leptin signaling in the VMH is independent of leptin action on POMC neurons. Whereas the single deletion of LepRs on POMC and SF-1 neurons led to only modest obesity, the deletion of LepRs on both neuron populations caused severe obesity, reflecting the sum of the weight gain observed in the individual deletion of the receptor in the respective neurons (Binghamet al., 2008; Dhillonet al., 2006).
Furthermore, the same group could show that glutamatergic output of SF-1 express- ing neurons was mandatory for normal body weight regulation. Mice lacking the gluta- mate transporterVGLUT2in SF-1 neurons, leading to an impaired glutamate release, also showed an increase in body weight and modest hyperphagia (Tonget al., 2007b). These findings correspond with the results of Sternson and colleagues, who were able to show, by a combination of uncaging experiments in the VMH together with electrophysiologi- cal recordings of ARC POMC and AgRP neurons, that unidentified VMH neurons build excitatory hotspots on POMC neurons (Sternsonet al., 2005). This further highlights the role of SF-1 expressing neurons in the homeostatic mechanism of melanocortin regulated body weight control.
1.10 Counter-regulatory Response to Hypoglycemia
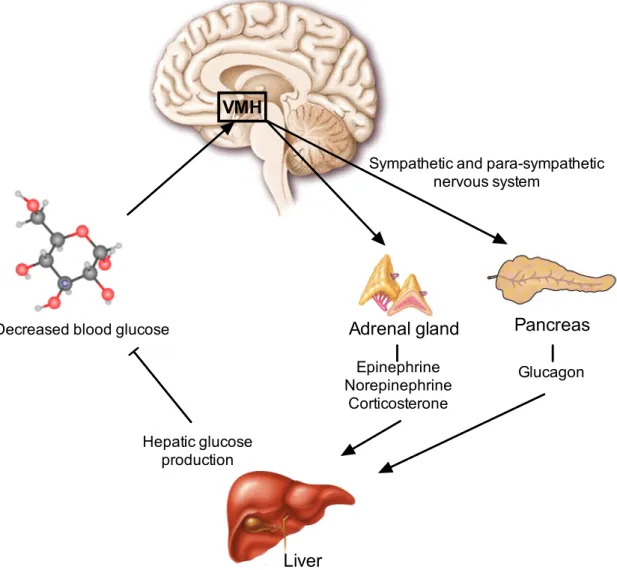
Apart from being involved in the regulation of energy homeostasis, VMH neurons also play a role in the detection and counter-regulation of hypoglycemia, one of the major limitations in the treatment of type 1 and 2 diabetes patients with insulin (Borget al. , 1994; Cryeret al., 2003).
Due to the fact that the brain uses glucose as the major (and almost exclusive) fuel, it is very sensitive to a drastic fall of blood glucose concentrations (Cryeret al., 2003). There- fore, powerful neuroendocrine and autonomic counter-regulatory mechanisms protect the brain against severe hypoglycemia (Cryer, 2008). This is achieved by the release of epinephrine, norepinephrine, corticosterone and glucagon into the circulation, leading to an increase of hepatic glucose production and an inhibition of peripheral glucose uptake (figure 1.5) (Cryeret al., 2003; Dagogo-Jacket al., 1993; Heller & Cryer, 1991). But the
1 Introduction
mechanism how the brain senses hypoglycemia and how the appropriate release of the aforementioned hormones is facilitated is still under investigation.
The first evidence pointing towards the involvement of the VMH in the counter- regulatory response to hypoglycemia (CRR) came from VMH-lesioned rats that showed an impaired CRR (Borget al., 1994). This was verified by either glucose infusion into the VMH or the induction of local glucopenia in the VMH (Borget al., 1997, 1999, 1995). Fur- thermore, both glucose excited (GE) but also glucose inhibited (GI) neurons were found within the VMH (Songet al., 2001). Thus, glucose sensing in the VMH has a pivotal role in the induction of CRR (Kanget al., 2006; Levinet al., 2004). Several factors are involved in VMH’s glucose sensing and hence the induction of CRR. AMP-activated protein ki- nase (AMPK) plays a central role since activation of AMPK with 5-aminoimidazole-4- carboxamide (AICAR) amplifies the hormonal CRR (McCrimmonet al., 2006). Similarly, the KATPchannels, that are key mediators of glucose stimulated insulin release from pan- creaticβ-cells, are implicated in the mechanism of glucose sensing. Mice deficient for the regulatory subunit of KATP channels, Kir6.2, show an impaired CRR (Mikiet al., 2001).
But also nitric oxide (NO) is necessary for glucose sensing and the induction of CRR.
AMPK is able to phosphorylate and thereby activate the neuronal nitric oxide synthase (nNOS), leading to the production of NO that can signal via soluble guanylyl cyclase (sGC). Blockade of any of these steps leads to a loss of glucose sensing ability (Canabal et al., 2007; Murphyet al., 2009).
Insights into insulin’s role in the induction of CRR is derived from experiments in neuronal insulin receptor knockout (NIRKO) mice. These mice displayed an impaired CRR when exposed to insulin induced hypoglycemia, caused by an impaired glucagon release fromα-cells in the pancreas (Fisheret al., 2005).
Further evidence for the involvement of VMH and especially SF-1 neurons was pro- vided by Tong and colleagues who could show that glutamate release from SF-1 neurons is necessary for the induction of the CRR. Both insulin induced hypoglycemia and fast- ing, but also local glycopenia mediated CRRs were blunted in mice lacking VGLUT2 in SF-1 neurons, again caused by an impaired release of glucagon and epinephrine into the circulation (Tonget al., 2007a).
1 Introduction
Finally it could been shown that a lack of IRs in the brain leads to a reduced expres- sion of the glucose transporter GLUT4 in the brain, particularly in the VMH, leading to a defect in glucose sensing of those neurons. This resulted again in reduced levels of epinephrine secreted from the adrenal gland and thus to an impaired CRR (Diggs- Andrewset al., 2010).
Although both insulin signaling and VMH neurons are key factors in the CRR, it is still unclear whether SF-1 neurons represent the central glucose sensing neurons in the VMH, mediating insulin’s effect in the counter-regulation against hypoglycemia.
Decreased blood glucose
VMH
Sympathetic and para-sympathetic nervous system
Adrenal gland Pancreas
Epinephrine Norepinephrine
Corticosterone
Glucagon
Hepatic glucose production
Liver
Figure 1.5:Schematic overview of the counter-regulatory response to hypoglycemia.
The brain, especially the ventromedial hypothalamus (VMH), senses decreasing blood glucose concentrations and triggers the release of epinephrine, norepinephrine and corticosterone from the adrenal glands and the secretion of glucagon from pancreaticα-cells via the sympathetic and para-sympathetic nervous system These hormones increase the hepatic glucose production to counter-regulate the hypoglycemia.
1 Introduction
1.11 Objectives
The role of the VMH as important hypothalamic nucleus in the control of energy home- ostasis is well established. Likewise, insulin’s action in distinct neuronal populations as a regulator of peripheral glucose production has been intensively studied, e.g. in POMC and AgRP neurons (Könneret al., 2007), further refining the results of Brüning and colleagues (Brüninget al., 2000). Additionally, the NIRKO mouse used in the latter publication has been further studied with respect to the counter-regulatory response to hypoglycemia (CRR), establishing insulin as key factor in the induction of the CRR. The identification of steroidogenic factor 1 (SF-1) as a marker for the VMH and the subse- quent creation of a mouse line, using the SF-1 promotor to drive the expression of the Cre recombinase, allowed further insight into the role of leptin signaling in the VMH in control of energy homeostasis (Dhillonet al., 2006; Zhanget al., 2008a), but also into the role of SF-1 expressing neurons in the induction of CRR (Tonget al., 2007a). Hence, the SF-1 Cre mouse line is a new tool that enables a detailed investigation of insulin signaling in the VMH.
Due to the importance of the VMH in the regulation of body weight maintenance, as shown in lesion experiments, SF-1 neurons might be a target for insulin in the CNS. Thus, the aim of this study was to create mice that specifically lack the insulin receptor (IR) in SF-1 neurons (SF-1∆IR) and to investigate the effect of lacking insulin signaling on SF-1 neurons in terms of energy homeostasis and glucose metabolism. To over-activate the in- sulin signaling pathway, mice were generated lacking the phosphatase PTEN (SF-1∆PTEN; by Dr. Bengt F. Belgardt) and both PTEN and IR simultaneously (SF-1∆IR:PTEN). More- over, the role of insulin signaling in SF-1 neurons in the CRR was analyzed by exposing the mice to hypoglycemic-hyperinsulinemic clamp studies.