• Keine Ergebnisse gefunden

Identification of in vivo interactions of insulin receptor substrate 1 in murine liver

N/A
N/A
Protected

Academic year: 2021

Aktie "Identification of in vivo interactions of insulin receptor substrate 1 in murine liver"

Copied!
132
0
0

Wird geladen.... (Jetzt Volltext ansehen)

Volltext

(1)

Identification of in vivo interactions of insulin receptor substrate 1 in murine liver

I n a u g u r a l - D i s s e r t a t i o n zur

Erlangung des Doktorgrades

der Mathematisch-Naturwissenschaftlichen Fakultät der Universität zu Köln

vorgelegt von

Nina Vanessa Wegner aus Köln

Köln

2011

(2)

Berichterstatter: Prof. Dr. Jens Brüning Prof. Dr. Günter Schwarz

Tag der mündlichen Prüfung: 24. Oktober 2011

(3)

“Causarum enim cognitio cognitionem eventorum facit.”

Die Kenntnis der Ursachen bewirkt die Erkenntnis der Ergebnisse.

M

Maarrccuuss TTuulllliiuuss C Ciicceerroo ((110066--4433 B BC C)) iinn TTooppiiccaa

(4)

(5)

Contents

C

Coonntteennttss

!

Contents ... 5 !

Figure index ... 9 !

Table index ... 11 !

Abstract ... 12 !

Zusammenfassung ... 13 !

1 ! Introduction ... 15 !

1.1 ! Obesity ... 15 !

1.2 ! Type 2 diabetes mellitus ... 17 !

1.3 ! Insulin signaling ... 18 !

1.3.1 ! Systemic effects of insulin ... 18 !

1.3.2 ! Molecular features of insulin signal transduction ... 20 !

1.3.3 ! Role of insulin receptor substrates in insulin signaling ... 22 !

1.3.4 ! Molecular basis of insulin resistance ... 24 !

1.4 ! Proteomic studies in the context of insulin signaling ... 30 !

1.5 ! Objectives ... 32 !

2 ! Materials and methods ... 34 !

2.1 ! Molecular biology techniques ... 34 !

2.1.1 ! General considerations ... 34 !

2.1.2 ! Cloning PCR ... 34 !

2.1.3 ! DNA sequencing ... 35 !

2.1.4 ! Gel extraction ... 36 !

2.1.5 ! Red E/T Recombination ... 36 !

2.1.6 ! Transformation of competent bacteria ... 36 !

2.1.7 ! Purification of plasmid DNA ... 36 !

2.1.8 ! TOPO TA cloning ... 37 !

2.1.9 ! Ligation ... 37 !

2.1.10 ! Linearization ... 37 !

2.1.11 ! Phenol chloroform extraction ... 37 !

(6)

2.1.14 ! Southern blot ... 38 !

2.1.15 ! Isolation of genomic mammalian DNA ... 39 !

2.1.16 ! Genotyping PCR ... 39 !

2.2 ! Cell Culture Techniques ... 40 !

2.2.1 ! ES cell culture ... 40 !

2.2.2 ! ES cell transfection ... 40 !

2.2.3 ! Microinjection into blastocysts ... 41 !

2.2.4 ! In-vitro cre recombination ... 41 !

2.2.5 ! Fluorescence Microscopy ... 42 !

2.2.6 ! siRNA transfection ... 42 !

2.2.7 ! In-vitro insulin signaling ... 42 !

2.3 ! Animal Experiments ... 43 !

2.3.1 ! Animal care ... 43 !

2.3.2 ! Mouse models ... 43 !

2.3.3 ! Measurement of body weight and liver weight ... 43 !

2.3.4 ! Analysis of body composition ... 43 !

2.3.5 ! Collection of blood samples ... 43 !

2.3.6 ! Glucose tolerance test ... 44 !

2.3.7 ! Insulin tolerance test ... 44 !

2.3.8 ! Extraction of sample material ... 44 !

2.3.9 ! In-vivo insulin signaling ... 44 !

2.4 ! Protein Analysis ... 45 !

2.4.1 ! Organ lysis ... 45 !

2.4.2 ! Streptavidin affinity purification ... 45 !

2.4.3 ! Protein gel electrophoresis ... 46 !

2.4.4 ! Western Blot ... 46 !

2.4.5 ! In-gel trypsin digest ... 48 !

2.4.6 ! Desalting ... 48 !

2.4.7 ! Nano-LC-ESI-MS/MS mass spectrometry ... 49 !

2.5 ! Data Analysis ... 49 !

2.5.1 ! Label-free quantitative analysis ... 49 !

2.5.2 ! General calculations and analysis ... 49 !

2.5.3 ! Statistical methods ... 49

(7)

Contents

3 ! Results ... 50 !

3.1 ! Generation of the targeting vector ... 50 !

3.2 ! Generation of ROSA-CAGS-IRS1-TapTag mice ... 52 !

3.2.1 ! ES cell targeting ... 52 !

3.2.2 ! Transgenic mice ... 53 !

3.2.3 ! Physiological verification ... 54 !

3.3 ! Phenotypic analysis of ROSA-CAGS-IRS1-TapTag mice ... 55 !

3.3.1 ! Body weight ... 55 !

3.3.2 ! Body composition ... 56 !

3.3.3 ! Epigonadal fat pad weight ... 56 !

3.3.4 ! Blood glucose levels ... 57 !

3.3.5 ! Glucose tolerance ... 59 !

3.3.6 ! Insulin tolerance ... 60 !

3.3.7 ! Influence of IRS1 on metabolic phenotype ... 61 !

3.4 ! Proteomic analysis of IRS1 interactions ... 62 !

3.4.1 ! Sample generation ... 62 !

3.4.2 ! Verification of insulin signaling ... 63 !

3.4.3 ! Streptavidin affinity purification ... 63 !

3.4.4 ! Mass spectrometry and label-free quantification ... 65 !

3.4.5 ! Immunodetection of putative IRS1 interaction partners ... 77 !

3.5 ! Role of 14-3-3 ! interaction with IRS1 ... 79 !

4 ! Discussion ... 81 !

4.1 ! Implications of transgenic expression of IRS1-TapTag on the metabolic phenotype ... 81 !

4.2 ! IRS1 interactions ... 82 !

4.2.1 ! Phosphatidylinositol-3 kinase interaction ... 83 !

4.2.2 ! 14-3-3 protein interaction ... 84 !

4.2.3 ! Novel mechanism for the modulation of IRS1 serine phosphorylation ... 85 !

4.2.4 ! Lyn protein interaction ... 86 !

4.2.5 ! Nuclear protein interactions ... 87 !

4.2.6 ! Mitochondrial protein interactions ... 87 !

4.2.7 ! Metabolic protein interactions ... 88 !

(8)

4.3 ! Affinity purifications and their limitations ... 89 !

4.4 ! Implications for insulin resistance ... 90 !

5 ! Perspectives ... 92 !

6 ! Supplemental Data ... 93 !

7 ! References ... 114 !

Acknowledgements ... 131 !

Statement / Erklärung ... 132 !

(9)

Figure index

FFiigguurree iinnddeexx

Figure 1: ! Development of age-standardized mean BMI (black line) and 95% uncertainty intervals (shaded area) between 1980 and 2008; rearranged from (1). ... 16 ! Figure 2: ! The insulin signal transduction pathway. ... 21 ! Figure 3: ! Comparison of protein structures of mouse insulin receptor substrates; from (85). ... 23 ! Figure 4: ! Known serine phosphorylation sites on IRS1 and IRS2 and the respective kinases inducing the phosphorylation; from (99). ... 27 ! Figure 5: ! Scheme of the pCTAPneokana construct, containing the TapTag sequence

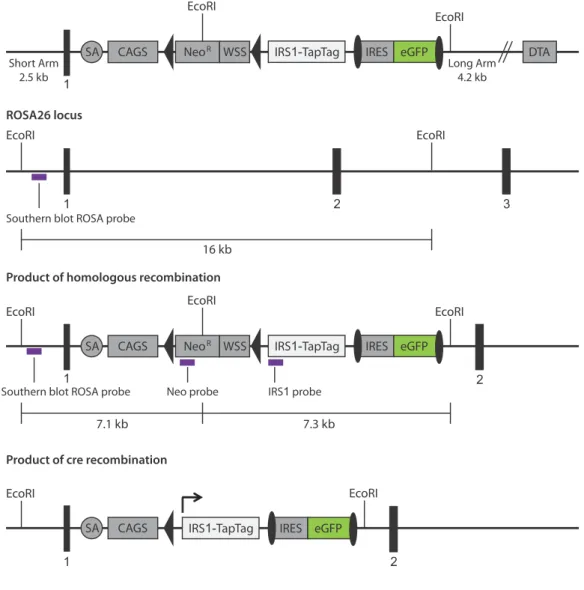
and a FRT (ellipses) flanked resistance cassette under the control of prokaryotic Pgb2 and eukaryotic PGK promoters. ... 50 ! Figure 6: ! Gene Targeting strategy for the homologous recombination of the ROSA-

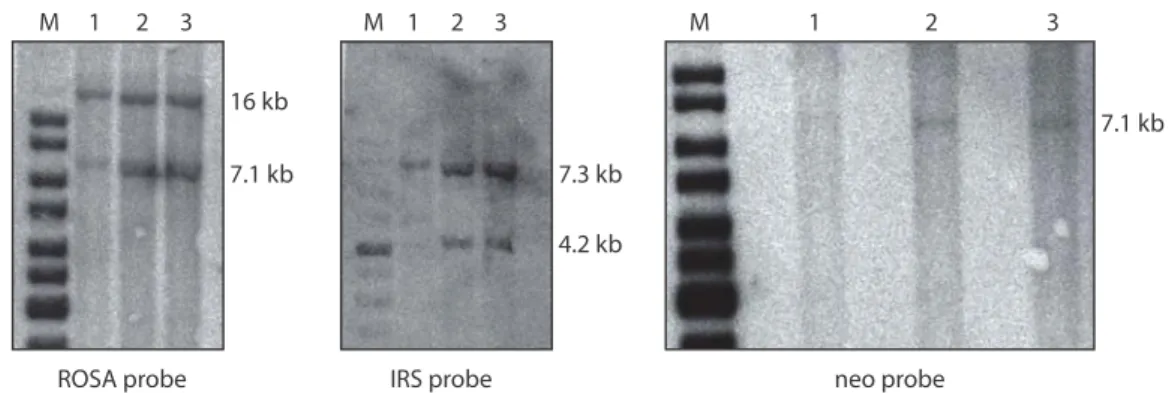
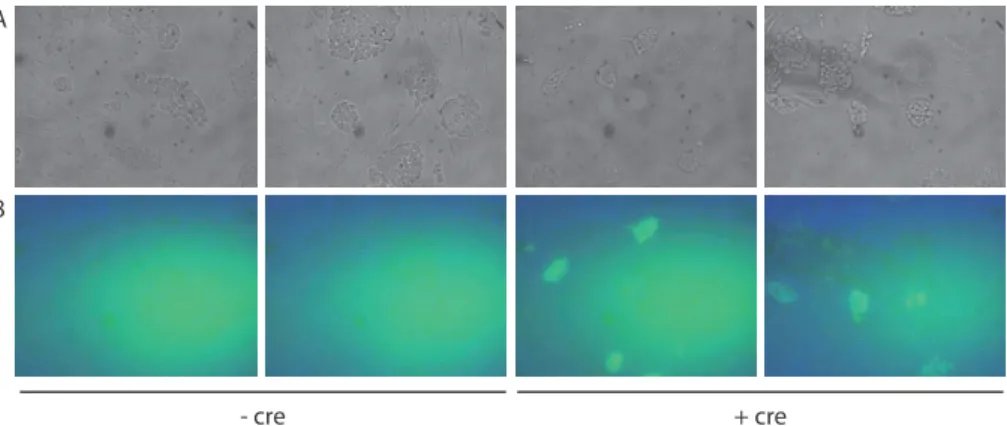
CAGS-IRS1-TapTag targeting vector into the ROSA26 locus and modified locus after cre-mediated excision of the loxP flanked stop signal. ... 51 ! Figure 7: ! Southern Blot results for three individual ES cell clones. ... 52 ! Figure 8: Verification of functional integration of the ROSA-CAGS-IRS1-TapTag construct in transfected ES cells. ... 53 ! Figure 9: ! Chimeric mouse with an estimated 95% chimerism. ... 53 ! Figure 10: ! Western blot of hepatic endogenous IRS1 and the elongated IRS1-TapTag in a mouse heterozygous for IRS1-TapTag. ... 54 ! Figure 11: ! Western blot of IRS1 expression in selected issues. ... 54 ! Figure 12: ! Average body weight of female IRS1-TapTag mice and controls over the

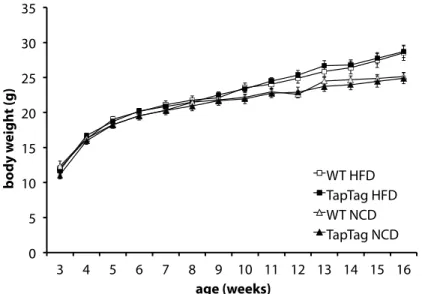
course of 13 weeks. ... 55 ! Figure 13: ! Average body weight of male IRS1-TapTag mice and controls over the course of 13 weeks. ... 56 ! Figure 14: ! Average body fat content of IRS1-TapTag mice and controls at the age of 20 weeks. ... 56 ! Figure 15: ! Average epigonadal fat pad weight of IRS1-TapTag mice and controls at the age of 16 weeks. ... 57 ! Figure 16: ! Average blood glucose of female mice with ad libitum access to the

respective diet. ... 57 !

Figure 17: ! Average blood glucose of male mice with ad libitum access to the respective

(10)

Figure 19: ! Blood glucose levels of female mice in response to a bolus injection of glucose in a glucose tolerance test. ... 59 ! Figure 20: ! Blood glucose levels of male mice in response to a bolus injection of glucose in a glucose tolerance test. ... 60 ! Figure 21: ! Blood glucose levels of female mice in response to a bolus injection of insulin in an insulin tolerance test. ... 61 ! Figure 22: ! Blood glucose levels of male mice in response to a bolus injection of insulin in an insulin tolerance test. ... 61 ! Figure 23: ! Scheme of different conditions applied for a set of 24 mice. ... 62 ! Figure 24: ! Western blot analysis of protein lysates used for affinity purifications and

subsequent mass spectrometry analysis. ... 63 ! Figure 25: ! Representative Western blot of input, unbound protein fraction, wash

fractions and biotin eluate of a streptavidin affinity purification. ... 64 ! Figure 26: ! Western blot analysis of biotin eluates of affinity purification. ... 64 ! Figure 27: ! Coomassie gradient gels with all 24 biotin eluates prepared for subsequent mass spectrometry analysis. ... 65 ! Figure 28: ! Scatter plot of identified interacting proteins after NaCl and insulin treatment. . ... 66 ! Figure 29: ! Scatter plot of identified interacting proteins for NCD- and HFD-fed mice. ... 67 ! Figure 30: ! Scatter plot of IRS1 interacting proteins, significantly changed between NCD and HFD. ... 68 ! Figure 31: ! Scatter plot of IRS1 interacting proteins, significantly changed between NaCl and insulin treatment. ... 71 ! Figure 32: ! Label-free quantification of bait protein IRS1 (A) and identified subunits of the known interacting protein phosphatidylinositol 3-kinase. ... 75 ! Figure 33: ! Label-free quantification of members of the 14-3-3 protein family. ... 76 ! Figure 34: ! Label-free quantification of tyrosine-protein kinase Lyn. ... 77 ! Figure 35: ! Western blot analysis of putative IRS1 interaction partners in IRS1-TapTag liver lysates and eluates after streptavidin purification. ... 78 ! Figure 36: ! Western blot analysis of Hepa 1-6 cells. Content of the indicated proteins in control cells and after 14-3-3! siRNA knockdown. ... 80 ! Figure 37: ! Role of 14-3-3 ! and possible role of 14-3-3 "/# in the modulation of

serine/threonine kinases PKC and QSK. ... 86 !

(11)

Table Index

TTaabbllee iinnddeexx

Table 1: ! Primers used for cloning PCRs. Sequences in 5’-3’ direction. ... 34 ! Table 2: ! Sequencing primers used for verification of insert IRS1-TapTag DNA. ... 35 ! Table 3: ! Primers used for genotyping PCRs. ... 40 ! Table 4: ! Antibodies used for immunodetection of proteins, with dilution applied and

the ordering information. ... 47 ! Table 5: ! Amino acid sequence of the components of the TapTag, streptavidin binding peptide (SBP) (172) and calmodulin binding peptide (CBP) (173). ... 50 ! Table 6: ! IRS1 interacting proteins identified in biotin eluates of affinity purifications,

which significantly varied between NaCl controls and insulin-treated mice… 68 ! Table 7: ! IRS1 interacting proteins identified in biotin eluates of affinity purifications,

which significantly varied between NCD controls and mice fed HFD. ... 71 !

Table 8-S: ! List of proteins potentially interacting with IRS1, which were identified in biotin

eluates derived from TapTag liver lysates of affinity purifications. ... 93 !

(12)

A

Abbssttrraacctt

The development of obesity, insulin resistance and type 2 diabetes is highly interlinked. In the past, differential phosphorylation and protein interaction of the insulin receptor substrates (IRS) have been identified in the regulation of insulin signaling. However, the exact molecular changes on the IRS protein network that occur upon insulin resistance have yet to be determined completely.

In this study, a transgenic mouse model was generated featuring a streptavidin binding peptide tag allowing for IRS1 affinity purification in the liver and the assessment of in vivo interactions of IRS1 in diet-induced obesity and insulin signaling. To this end, affinity purification of hepatic streptavidin binding peptide-tagged IRS1 was performed and subsequent mass spectrometry and label-free quantification of the results led to the identification of 809 putative IRS1 interactions. Of the interacting proteins, association of 53 was reduced on HFD in the non-insulin stimulated state. Comparing the different diets upon insulin signaling, IRS1 association of 31 proteins was increased in NCD-fed mice, while in HFD-fed mice only 18 proteins were increasingly associated with IRS1.

Notably, the association of p110" and # with the IRS1-p85 complex was increased upon insulin treatment in NCD-fed mice. However, this effect was blunted on HFD, indicating a reduced insulin signaling capacity in HFD-fed mice and a contribution to the development of insulin resistance.

A tendency towards increased Lyn association with IRS1 upon HFD may likely lead to the development of insulin resistance, as for Fyn, a kinase related to Lyn, a regulation of energy expenditure and fatty acid oxidation has been described previously.

Moreover, 14-3-3 proteins !, "/#, $, % and &/' increasingly interacted with IRS1 upon insulin signaling in NCD conditions, however on HFD interaction was reduced to levels seen in the non-insulin stimulated state. In this context, 14-3-3 proteins seem to serve as adaptor proteins regulating the association of kinases with IRS1, a mechanism that may affect the signaling functionality of IRS1 and thereby contribute to insulin resistance upon diet-induced obesity.

IRS1 interaction with two serine/threonine kinases, protein kinase C (PKC) and salt inducible kinase 3 (QSK) was identified in this study. IRS1-PKC interaction has been described previously in connection with 14-3-3 interaction. QSK, however, is a novel interacting protein of IRS1, which has been shown to also interact with 14-3-3 proteins.

These findings strongly suggest that not only PKC-, but also QSK-mediated regulation of

insulin signaling at the level of IRS1 may contribute to insulin resistance.

(13)

Zusammenfassung

ZZuussaam mm meennffaassssuunngg

Die Grundlagen zur Entstehung von Adipositas, Insulinresistenz und Typ 2 Diabetes sind stark verzahnt. Bisher wurde unter anderem das differenzielle Auftreten von Insulin Rezeptor Substrat (IRS)-spezifischen Phosphorylierungen und Proteininteraktionen für die Regulierung der Insulin Signaltransduktion verantwortlich gemacht. Jedoch sind die zugrundeliegenden molekularen Veränderungen des IRS Proteinnetzwerkes während einer Insulinresistenz noch weitgehend unbekannt.

In dieser Arbeit wurde ein transgenes Mausmodell generiert, welches es erlaubt, IRS1 spezifisch per fusioniertem Streptavidinbindepeptid aufzureinigen und in vivo Interaktionen von IRS1 zu charakterisieren. Speziell wurde der veränderte Zustand bei ernährungsinduzierter Adipositas und Insulinbehandlung in der Leber untersucht. Dazu wurde die Streptavidin-Affinitäts-Aufreinigung von hepatischem IRS1 in Kombination mit Massenspektrometrie durchgeführt. Eine anschließende markierungsfreie Quantifizierung der Ergebnisse führte zur Identifizierung von 809 putativen Interaktionspartnern von IRS1.

Basal war die Assoziation von 53 dieser Proteine bei fettreicher Diät (FD) reduziert.

Vergleiche zwischen normaler Diät (ND) und FD ergaben zudem, dass die Assoziation von 31 Proteinen mit IRS1 nach Insulingabe bei ND erhöht war, während nach Insulingabe bei FD nur 18 Proteine verstärkt mit IRS1 assoziiert waren.

Insbesondere war die Interaktion von p110" und # mit IRS1 nach Insulingabe bei ND erhöht. Jedoch blieb dieser Effekt bei FD aus, was auf eine reduzierte Insulinsignaltransduktion bei FD hinweist und darauf schließen lässt, dass die Regulation von p110 einen Beitrag zur Entstehung von Insulinresistenz leistet.

Für die Tyrosin-Proteinkinase Lyn wurde eine Tendenz zu verstärkter Assoziation mit IRS1 bei FD festgestellt, was möglicherweise zur Entstehung von Insulinresistenz beitragen kann. Fyn, eine verwandte Kinase von Lyn, ist dafür bekannt, Energieaufwand und Fettsäureoxidation zu regulieren.

Darüber hinaus interagieren die 14-3-3 Proteine ! , " / # , $ , % und & / ' nach Insulingabe bei ND verstärkt mit IRS1. Allerdings war diese Interaktion bei FD reduziert. In diesem Zusammenhang scheinen die 14-3-3 Proteine als Adapterproteine zu fungieren, die die Assoziation von Kinasen mit IRS1 regulieren, und so schließlich sowohl die Funktionalität von IRS1, als auch adipositasinduzierte Insulinresistenz beeinflussen.

Zwei Serin/Threoninkinasen, Proteinkinase C (PKC) und salt inducible kinase 3 (QSK)

wurden in dieser Arbeit als IRS1-Interaktionspartner identifiziert. Die Interaktion von IRS1

und PKC in Verbindung mit 14-3-3 wurde bereits in der Literatur beschrieben. QSK ist

(14)

Diese Ergebnisse weisen stark auf einen ähnlichen Mechanismus von PKC- und

QSK-vermittelter Regulation der Insulinsignaltransduktion auf der Ebene von IRS1 hin,

welche schließlich zur Entstehung der Insulinresistenz beitragen kann.

(15)

1 Introduction

11 IInnttrroodduuccttiioonn

11..11 O Obbeessiittyy

Among the variety of non-communicable pathologies, obesity and associated health syndromes play an increasingly important role in society.

According to the World Health Organization (WHO), worldwide, obesity has increased more than 2 fold since 1980 and today affects as many as 200 million men and nearly 300 million women (1). Additionally, 1.5 billion adults over the age of 20 were overweight in 2008 and approximately 43 million children under the age of five were overweight in 2010 (2).

In Germany, 70% of all men and 50% of all women are overweight. Alarmingly, although in Germany the percentage of overweight people has remained stable over the last 20 years, an increasing number of obese patients has been recorded during this period (3).

Although rather a surrogate characteristic, the body-mass index (BMI) is widely used and accepted as a measure of adiposity. The BMI is calculated by the ratio of body weight in kilograms to square of height in meters. Per WHO definition, a BMI above 25 kg/m

2

indicates overweight, while a BMI above 30 kg/m

2

demarcates obesity (2).

Besides the BMI, waist-to-hip ratio (WHR) may be used to estimate pathological levels of body fat. The WHR leads to a more accurate approximation of risk related to cardiovascular disease than BMI, as here, not only the amount of fat but also its distribution throughout the body plays a determining role (4).

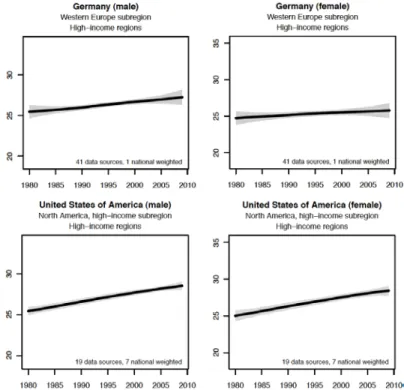
Recently, extensive comparative analysis of long-term developments of body mass index in 199 countries with over 9 million participants has revealed a worldwide increase of BMI by 0.4 kg/m! per decade for men and 0.5 kg/m! per decade for women since 1980 (1).

The highest BMI among high-income countries was detected in the United States of

America with comparable increases of male and female BMI. Analysis of BMI in Germany

also revealed a modest constant increase since 1980, which was more pronounced in

men than in women (Figure 1). These data suggest that increasing BMI and obesity will

further affect societies around the world for the next decades.

(16)

Figure 1: Development of age-standardized mean BMI (black line) and 95% uncertainty intervals (shaded area) between 1980 and 2008. Results shown for males and females in Germany and the United States of America; rearranged from (1).

Despite this, at the same time obesity is one of the most neglected risk factors for various diseases. In addition to the obvious overall reduced quality of life related to obesity, numerous studies support the finding that obesity, but also overweight, lead to the development of various comorbid diseases. For example, the development of insulin resistance and resulting type 2 diabetes mellitus is largely based on overweight and obesity (5). Yet, also cardiovascular disease, myocardial infarction and cerebral infarction are known to coincide with increased body weight (4, 6, 7). Furthermore, obesity related cancers, osteoarthritis and psychological disturbance are found with increased incidence among obese patients (8). Taken together, several studies conclude drastic decreases in life expectancy and increases in early mortality due to obesity and overweight (9-11).

Major causes of overweight and obesity include a trend towards a sedentary lifestyle with

an overall decrease in physical activity, and excess intake of food rich in macronutrients

(12). These environmental factors, together with polygenic variations, steer society

towards an increased BMI attributing to the majority of all cases of obesity. In contrast,

monogenic mutations, like leptin deficiencies, leptin receptor deficiencies (13) or

melanocortin receptor mutations cause less than 5% of all cases of severe obesity

(14, 15).

(17)

1 Introduction

11..22 TTyyppee 22 ddiiaabbeetteess m meelllliittuuss

Diabetes mellitus is one of the most common metabolic disorders (16). In Germany, diabetes occurs in almost 6% of men and almost 5% of women, however the prevalence remained stable between 1990 and 2005 (17).

Worldwide, more than 220 million people suffer from diabetes and similar to estimates for obesity, the WHO predicts a dramatic rise in diabetic patients and in diabetes related deaths over the next two decades (18). Prevalence of diabetes rises with increasing age, increasing body mass index, increasing sedentary behavior and decreasing education (17).

Most data sources do not distinguish between type 1 and type 2 diabetes mellitus (19), however, WHO estimates attribute more than 95% of all diabetes cases to type 2 diabetes mellitus (20).

While type 1 diabetes is an early-onset autoimmune disease by which insulin-producing

#-cells in the islets of Langerhans are destroyed (21), generally type 2 diabetes occurs later in life (22) and while type 1 diabetes is characterized by an absolute deficiency in the hormone insulin (21), type 2 diabetes leads to relative insulin deficiency. However, both type 1 and type 2 diabetes result in severe hyperglycemia. Depending on the fasting state, human normoglycemic blood glucose levels in whole blood range from 60 to 140 mg/dL (3.3 mmol/L to 7.8 mmol/L). In contrast, in uncontrolled diabetic patients hyperglycemia can reach more than 270-360 mg/dL (15-20 mmol/L). General recommendations refer to maximum values of 126 mg/dL (7 mmol/L) for fasting blood glucose, while after a meal a short-term maximum of 180 mg/dL (10 mmol/L) is tolerated.

The development of insulin resistance as a major characteristic of type 2 diabetes (16, 23) is mainly influenced by increased body weight (17), but also progressive #-cell dysfunction begins before onset of the disease and plays a determining role for the progression of type 2 diabetes (24). Insulin resistance is initially compensated by an increased insulin secretion and proliferation in the pancreatic #-cells, however, this eventually leads to

#-cell failure (25, 26).

Further, type 2 diabetes may include impaired glucose tolerance, leading to either normal

or increased insulin response in mild cases of glucose intolerance, or decreased insulin

response in severe cases of glucose intolerance (27). Fatal complications including kidney

failure, neuropathy, retinopathy, dermopathy, increased risk of atherosclerosis and stroke

(18)

The most obvious strategies for treatment and possibly even prevention of type 2 diabetes include extensive changes in lifestyle, i.e. a healthier diet (29) and regular physical activity (30). Indeed, nutrition and exercise seem to regulate insulin receptor expression (31), increasing insulin functionality.

Nonetheless, medicinal treatment is available. Besides the administration of insulin also sulfonylurea, thiazolidinedione and the biguanid metformin, which improve insulin release, insulin sensitivity and glucose uptake, respectively, are used to ameliorate the effects of diabetes (32-34).

11..33 IInnssuulliinn ssiiggnnaalliinngg

1.3.1 Systemic effects of insulin

Following a meal, blood glucose levels are elevated, and more glucose enters pancreatic

#-cells through insulin-independent glucose transporters 2 (GLUT2) (35). Upon increasing intracellular glucose, adenosine triphosphate (ATP) is produced, which leads to the closure of ATP-sensitive K

ATP

channels, shutting down potassium exchange through the membrane and resulting in its depolarization. In turn, opening voltage-gated calcium channels facilitate Ca

2+

influx, which triggers exocytosis of secretory granules containing insulin. Finally, secretion into the circulation occurs (36). These granules are preformed and reside at the cell membrane, enabling an immediate response to the acute insulin demand after meals.

Through the bloodstream, insulin targets its various metabolic target tissues like skeletal muscle, white adipose tissue and the liver through the insulin receptor. Among those major targets, adipocytes show the highest expression of insulin receptor, while in comparison, expression in hepatocytes and skeletal muscle cells is approximately 30% and 10%, respectively (37, 38). Nevertheless, only a small fraction of glucose clearance from the blood can be attributed to white adipose tissue, whereas skeletal muscle takes up the largest amount of blood glucose of approximately 70% (38-40).

The insulin receptor is furthermore expressed in brain, heart, kidney, pulmonary alveoli, pancreas, placenta, various blood cells, and fibroblasts (41).

As a result of anabolic insulin signaling, uptake of glucose is increased in peripheral organs, like white adipose tissue and skeletal muscle, where it can be utilized or stored (42).

Except for the intestine and kidney, where glucose uptake is also facilitated via

(19)

1 Introduction tissues mainly utilize glucose transporters, which carry glucose along the concentration gradient. This second class of glucose transporters comprises five known transporter proteins, i.e. glucose transporters 1-5 (38).

Among those, GLUT4 is the only insulin-dependent glucose transporter and expression is localized to insulin responsive tissues, like skeletal muscle, cardiac muscle and adipose tissue, whereas GLUT1, GLUT2, GLUT3 and GLUT5 are independent of insulin and differ in their kinetic properties as well as distribution (38).

Neurons and the placenta are organs with high glucose demand, which explains the presence of GLUT3, exhibiting the highest affinity for glucose among the glucose transporters. GLUT2 has only low affinity to glucose and is localized in hepatocytes and pancreatic #-cells, but also kidney and small intestinal epithelium take up glucose via GLUT2. GLUT1 on the other hand, is expressed on various cell types, with high expression in brain, erythrocytes, and endothelial cells. GLUT5 has the lowest glucose affinity and a higher affinity for fructose. GLUT5 can be found on small intestinal cells, sperm, kidney, brain, adipose tissue cells and muscle (38).

In white adipose tissue, where energy is stored in the form of newly synthesized lipids, glycolysis is increased upon insulin signaling, leading to increased formation of glycerol-3-phosphate used for triglyceride synthesis (44). To support this effect, anti-catabolic actions of insulin reduce lipolysis (45), thus reducing the amount of non-esterified fatty acids circulating to the liver (46). In addition, insulin signaling increases glucose uptake into adipocytes via an intensified expression and translocation of GLUT4 and also GLUT1 expression is regulated by insulin (38, 45).

As in adipose tissue, in skeletal muscle, insulin signaling likewise leads to an increased expression and translocation of GLUT4 (38). Furthermore, insulin stimulates the synthesis of hexokinase II and pyruvate kinase, increasing glycolysis and formation of ATP (47).

Generation of glycogen storage from glucose is a key feature in skeletal muscle, which is also elevated upon insulin signaling contributing to the regulation of blood glucose levels (48, 49).

Moreover, in the liver glycolysis and the formation of ATP are increased upon insulin signal

transduction, whereas glycogenolysis and gluconeogenesis are blocked

(50, 51). Further, insulin facilitates glycogen synthesis and increases biosynthesis of

hexokinase IV, which enhances glycolysis in response (52). Overall, the liver contributes

substantially to the control of blood glucose by the regulation of hepatic glucose

(20)

The secretion of glucagon by pancreatic "-cells leads to an increase in blood glucose and thus is inhibited by insulin and elevated blood glucose levels (53). As up to 75% of hepatic glucose production is determined by glucagon in order to counteract decreasing amounts of blood glucose (54), the inhibition of glucagon secretion by insulin indirectly reduces hepatic glucose production in the liver (55).

In summary, utilization of stored energy is inhibited upon insulin action, and glucose, lipid and protein release from tissues is decreased (42). By action of insulin, less gluconeogenic amino acids are released from fat and muscle and therefore less of those precursors are available for glucose production in the liver (56).

In addition to insulin’s effects on peripheral organs, insulin signaling also affects the central nervous tissue. However, rather than influencing metabolic pathways, insulin here seems to act on numerous regulatory pathways, for example regulating appetite or affecting the reward centers of the brain (57).

1.3.2 Molecular features of insulin signal transduction

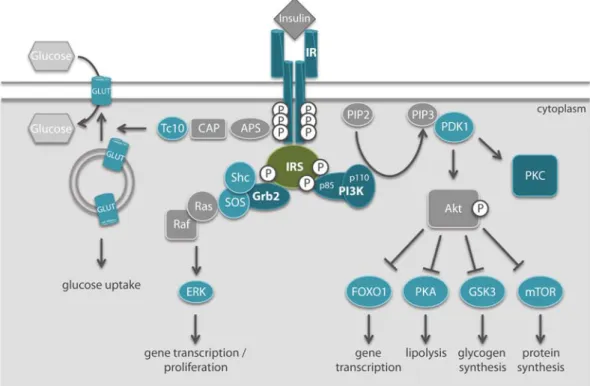
The peptide hormone insulin binds to the membrane-bound insulin receptor via its two extracellular "-subunits and thereby triggers a conformational change on the two intracellular #-subunits of the receptor (58). In turn, this conformational change facilitates the autophosphorylation of the insulin receptor on a maximum of seven tyrosine residues thereby activating its tyrosine kinase abilities (59, 60). Proteins containing phosphotyrosine binding (PTB) domains then interact with the receptor (61-64) and are phosphorylated on tyrosine residues, while being localized to the plasma membrane through pleckstrin homology (PH) domains (63, 64). Among those proteins, the insulin receptor substrates (IRS) play a prominent role, as proteins like the p85 subunit of phosphatidylinositol-3 kinase (PI3K) or growth factor receptor bound protein 2 (Grb2) interact with the phosphorylated IRS proteins via their src homology 2 (SH2) domains (65, 66).

Further downstream, signaling branches off at the level of the IRS proteins into the PI3K-pathway (67) and the Ras/Raf mitogen-activated protein kinase (MAPK)-pathway (68, 69), related to metabolic and proliferative regulation, respectively (Figure 2).

The metabolic PI3K-pathway is initiated by binding of the regulatory p85 subunit of the

PI3K to IRS proteins (66, 70). The catalytic p110 subunit of PI3K then transforms

phosphatidylinositol-4,5-bisphosphate (PIP2) into phosphatidylinositol-3,4,5-trisphosphate

(PIP3), which activates phosphoinositide dependent kinase 1 (PDK1) (71). Subsequently,

(21)

1 Introduction (72) and the PI3K-pathway diverges into several branches leading to the repression of lipolysis, the de-repression of glycogen synthesis, and protein synthesis (73). Furthermore, PDK1 activates protein kinase C (PKC), a serine/threonine kinase, which is able to modulate insulin signaling by phosphorylation of a serine residue of IRS1 (74, 75).

Together with son of sevenless (SOS) and SH2 containing protein (Shc), the activation of Ras and Raf is mediated through the binding of growth factor receptor binding protein 2 (Grb2) to IRS (76, 77). Finally, this cascade leads to estrogen receptor kinase (ERK) and thus to mitogen-activated protein kinase signaling (78, 79) influencing the proliferative state of the cell.

Figure 2: The insulin signal transduction pathway. Insulin binds to the insulin receptor on the

cell surface, facilitating conformational change and thus autophosphorylation on

intracellular domains. Further downstream signaling is directed by the insulin

receptor substrates finally leading to insulin’s effects like gene transcription,

proliferation, lipolysis, glycogen synthesis and protein synthesis. Proteins

interacting with IRS1 are in bold print. IR: insulin receptor, APS: adapter protein with

a PH and SH2 domain, CAP: cbl-associated protein, Tc10: Ras-like protein Tc10,

GLUT: glucose transporter, IRS1: insulin receptor substrate 1, Grb2: growth factor

receptor binding protein 2, Shc: SH2 containing protein, SOS: son of sevenless,

Ras: rat sarcoma, Raf: v-raf-leukemia viral oncogene, ERK: extracellular signal-

regulated kinase, PI3K: phosphatidylinositol-3 kinase (subunits p85 and p110),

PIP2: phosphatidylinositol-4,5-bisphosphate, PIP3: phosphatidylinositol-3,4,5-

trisphosphate, PDK1: phosphoinositide dependent kinase 1, Akt: protein kinase B,

FOXO1: forkhead transcription factor 1, PKA: protein kinase A, GSK3: glycogen

synthase kinase 3, mTOR: mammalian target of rapamycin, PKC: protein kinase C.

(22)

Another pathway, bypassing the IRS proteins, leads to insulin-dependent translocation of GLUT4 to the plasma membrane facilitating glucose uptake into the cell (80, 81). Via insulin receptor activation of a signaling cascade including adapter protein with a PH and SH2 domain (APS), casitas B-lineage lymphoma (Cbl) and Ras-like protein Tc10, initial fusion of GLUT4 containing vesicles with the plasma membrane is initiated (42, 81).

In addition to the IRS proteins and APS, there are further proteins known to interact with the insulin receptor, like Grb2-associated binding protein 1 (Gab-1), p60

dok

, and Cbl all of which exert distinct functions in downstream signaling (42).

1.3.3 Role of insulin receptor substrates in insulin signaling

The family of insulin receptor substrates consists of four known members and two putative new members, which were recently identified (82-84). So far, IRS1 and IRS2 have been most extensively studied. However, also research on IRS3 and IRS4 is more and more adding to the overall understanding of the differential signaling capabilities of insulin receptor substrates. In contrast, the function of IRS5 (DOK4) and IRS6 (DOK5) is still vague (82).

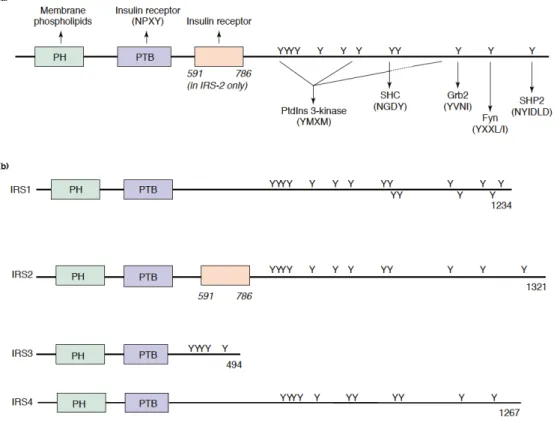
Detailed structural data are available, comparing the properties of protein domains and phosphorylation sites of insulin receptor substrates 1-4 (Figure 3) (85).

The phosphotyrosine binding domains facilitating interaction with the insulin receptor and

pleckstrin homology domains facilitating localization to the plasma membrane are

conserved between IRS1-4, suggesting similar insulin receptor binding characteristics of

the different isoforms. Moreover, on a structural level, about 20 tyrosine residues are

conserved between IRS1 and IRS2 concerning their approximate location and

surrounding binding motif, while the overall comparison suggests a rather distinct

C-terminus, and a 75% conserved N-terminus (85). Furthermore, IRS2 binds to the insulin

receptor not only via the PTB domain but has an additional binding loop (Figure 3),

providing a possible explanation for the different binding kinetics (86).

(23)

1 Introduction

Figure 3: Comparison of protein structures of mouse insulin receptor substrates; from (85).

PH domain of IRS proteins located at the N-terminus, PTB domain and tyrosine phosphorylation sites; known interacting proteins with the respective interaction motif indicated by arrows (a). Different structural features of isoforms 1-4 (b). PH:

pleckstrin homology domain, PTB: phosphotyrosine-binding domain, Y: tyrosine phosphorylation sites. Numbers display amino acid count.

Functional characterization of the different insulin receptor substrate proteins was achieved by the analysis of knockout mice. IRS1 knockout studies revealed that integrity of insulin signaling is largely depending on functional IRS1, as IRS1 knockout mice are insulin resistant with increased insulin serum levels, glucose intolerant and further exhibit growth retardation (87, 88). However, these mice failed to develop diabetes and thus, an alternative substrate compensating for IRS1 was identified and named IRS2 (88).

In comparison, a knockout of IRS2 also led to insulin resistance, but additionally mice developed type 2 diabetes and had impaired #-cell function (89, 90).

Furthermore, differential dephosphorylation kinetics were observed for IRS1 and 2, where total IRS1 tyrosine phosphorylation was detected up to 60 minutes after stimulation with insulin, while total IRS2 tyrosine phosphorylation lasted for only 3-10 minutes (91).

In parallel, PI3K activation times correlated with the duration of tyrosine phosphorylations.

(24)

liver (85). In liver of whole-body IRS1 knockout mice, IRS2 is able to compensate for IRS1-mediated activation of PI3K and thus ameliorates the loss of regulation of blood glucose levels (87). In addition, knockout of IRS2 leads to a declined suppression of hepatic glucose production and reduces glycogen synthesis in the liver. Furthermore, these mice show a dysregulated lipid metabolism (92).

Knockdown of IRS1 specifically in liver, performed by adenoviral RNA interference, increases gluconeogenesis and reduces glucokinase expression, whereas knockdown of IRS2 in liver increases the expression of lipogenic enzymes like fatty acid synthase and hepatic lipid accumulation (93).

Overall, these findings suggest that in liver IRS1 and IRS2 have overlapping roles in the control of metabolism, while IRS1 seems to regulate glucose homeostasis and IRS2 seems to play a role in lipid metabolism (92, 93).

It is known for tissues where glucose uptake is insulin-dependent and facilitated via GLUT4, that primarily IRS1 and IRS3 are expressed, and only little amounts of IRS2 (94).

Thus, in muscle tissue of IRS1 knockout mice, PI3K activation is decreased and not compensated for by IRS2. Moreover, muscle and adipose tissues of these mice exhibit reduced insulin-induced glucose transport (87).

In summary, IRS1 and IRS2 regulate a variety of insulin’s major effects in the tissues involved in glucose and lipid metabolism, whereas IRS3 expression so far has only been shown in rodents and might not play an important role in humans (95). Also IRS4 seems to have only a limited influence on the metabolic effects of insulin, although it is expressed in brain, liver, kidney and muscle (96).

The insulin receptor substrates are also involved in insulin-like growth factor (IGF) 1 signaling and it is known that they interact with the IGF-1 receptor via their PTB domain upon activation of the receptor by IGF-1 (97). The liver, when stimulated by growth hormone, produces IGF-1, but also numerous other tissues are a source of IGF-1.

Circulating IGF-1 then stimulates growth by its anabolic effects on almost every cell-type (98).

1.3.4 Molecular basis of insulin resistance

Since the insulin signaling pathway is comprised of a complex network of several

interlinked downstream cascades, it is prone to disturbances when one or more of the

components are dysregulated. Such dysregulation, which may originate from a certain

genetic or environmental background, can lead to insulin resistance.

(25)

1 Introduction Over the last decades, research dedicated to the elucidation of mechanisms involved in insulin resistance has accumulated a variety of involved pathways and regulation machineries. Insulin resistance thus was found to have multifaceted molecular causes and is possibly further complicated by combinations of different resistance mechanisms.

On the one hand numerous kinases convey the modulation of insulin signaling on protein level, providing a well-balanced signaling network, which may easily be disturbed.

Because of their central role in insulin signaling, IRS proteins are of major research interest and as the insulin signal branches off into the different pathways at this level, these proteins form a level of extensive regulation. Numerous kinases and phosphatases are known, which modulate IRS activity by the addition or removal of phosphate residues (99-101). Further, phosphorylations involving different functional domains of IRS proteins indicate interference on different levels of IRS function, like impaired association with the insulin receptor, or with downstream signaling components (100, 101).

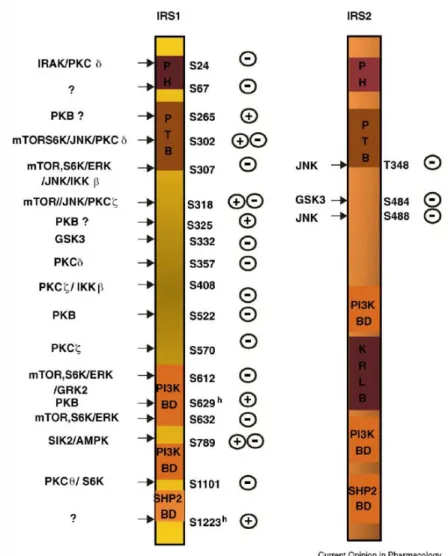
Generally, tyrosine phosphorylations are considered to have an activating effect on IRS proteins, whereas serine phosphorylations are considered to be inhibitory. While this assumption holds true for tyrosine phosphorylations, phosphorylation of some serine residues can as well amplify the insulin signal (Figure 4). In the physiological state, activating serine phosphorylations by Akt (PKB) or PKC & appear first, allowing for correct tyrosine phosphorylations and protect from inhibitory serine phosphorylations (102, 103), and later in a time-controlled manner, inhibitory serine phosphorylations are added by

PKC & or mTOR decreasing tyrosine phosphorylations and presumably turning off the

signaling (99, 104). In pathophysiology, kinases known to be activated by several inflammatory stimuli can cause inhibitory phosphorylation of serine residues in an uncontrolled manner. Kinases contributing to these inhibitory phosphorylations and thereby leading to insulin resistance are I(B kinase # (IKK#), c-jun N-terminal kinase (JNK), extracellular signal-regulated kinase (ERK) or protein kinase S6K (99).

Indeed, a link between metabolism and the immune system was established, laying grounds for the finding that obesity corresponds to a state of low-level inflammation (105).

This condition is especially true for the adipose tissue, where in lean individuals insulin

reduces the secretion of free fatty acids (106). It is known that in obesity and

type 2 diabetes, serum levels of free fatty acids are elevated, imposing inhibitory effects

on insulin sensitivity in vitro and in vivo (106, 107). Interestingly, these effects could in part

be reversed, when soluble tumor necrosis factor- " (TNF- " ) receptor was administered to

(26)

TNF-" signals through the formation of TNF-" receptor complex and TRAF2, ultimately resulting in the activation of downstream serine/threonine kinases JNK and IKK (108-110). In response to TNF-" signaling, these serine/threonine kinases are able to disrupt insulin signaling through the phosphorylation of murine IRS1 on Ser307 close to the PTB domain (corresponding to Ser312 in humans) (111, 112). Furthermore, the mutation of Ser307 to alanine in case of JNK (111), and alternatively the deletion of IKK resulted in a partial rescue of the insulin resistant phenotype (112).

Direct phosphorylation of IRS proteins by JNK and IKK certainly is one of the central mechanisms by which insulin signaling may be disturbed, however, also secondary effects on the phosphorylation state of insulin receptor and IRS1 have been described (113). Driven by IKK#, the protein-tyrosine phosphatase 1B facilitates the removal of tyrosine phosphorylations on both the insulin receptor (114, 115) and IRS1 (116, 117), thereby leading to reduced insulin sensitivity.

According to the observations regarding TNF-", an increase of several other inflammation-associated markers, for example interleukin (IL)-6 (118-120), IL-1 receptor antagonist (IL-1Ra) (121), IL-8 (120, 122), C-reactive protein (119), and MCP-1 (119, 123), is known for adipose tissue or plasma levels of obese mice and humans, suggesting similar outcomes for the disturbance of insulin signaling through the activation of JNK and IKK.

In addition, the phosphorylation state of the IRS proteins has been studied extensively during the last years and a variety of other kinases involved in the modulation of insulin signaling has been identified. Among those, mammalian target of rapamycin (mTOR) is capable of phosphorylating Ser307 on IRS1 upon insulin signaling (124). Studies on mTOR and mitogen-activated protein (MAP) kinases have revealed additional phosphorylation target sites, like Ser612 and Ser632 (125). Also Ser24 in the PH domain of IRS1 seems to be the target for several serine/threonine kinases, as at least PKC and pelle-like kinase (PLK) a homolog of human IL-1 receptor-associated kinase (IRAK) have been shown to catalyze this phosphorylation reaction (126, 127).

For IRS2 considerably less interventions by serine/threonine kinases have been detected

so far, but JNK and GSK3 phosphorylate IRS2 and thus negatively regulate insulin

signaling by disruption of the association with the insulin receptor or constraining tyrosine

phosphorylations (Figure 4) (99, 128, 129).

(27)

1 Introduction

Figure 4: Known serine phosphorylation sites on IRS1 and IRS2 and the respective kinases inducing the phosphorylation. PH: Pleckstrin homology domain, PTB:

phosphotyrosine binding domain, KRLB: kinase regulatory-loop binding domain, BD: binding sites, h: numbering according to human IRS1 protein sequence; from (99).

Several groups recently concentrated on the mass spectrometric assessment of IRS interaction partners (130), IRS phosphopeptides (131, 132), and specifically of phosphopeptide-mediated interactions (133), aiming at a better understanding of the IRS binding network with the identification of novel interactions.

Although the main research interest concentrates on phosphorylations mediating insulin

resistance, other posttranslational modifications of serine/threonine residues are known to

interfere with proper signal transduction. For example, O-linked N-acetylglucosamine

(O-GlcNAc) modifications close to phosphorylation sites may have a regulatory function

on the respective protein (134-136). The production of O-GlcNAc from

(28)

increased during hyperglycemia due to the abundance of glucose and was shown to induce insulin resistance as well (137, 138).

Also ubiquitinations have been studied in the relation to pathological consequences. The ATP-dependent ubiquitin-proteasome system primarily serves as cellular proteolytic machinery, degrading proteins in a regulated manner. Importantly, insulin is not only able to increase protein synthesis, but also inhibits the proteasomal degradation of proteins (139, 140). Indeed, prolonged exposure of cells to insulin leads to proteasomal degradation of IRS1 after ubiquitin modification of the N-terminus (141, 142) and thus to the development of insulin resistance (143).

Further research indicated that suppressor of cytokine signaling (SOCS) 1 and SOCS3 specifically serve as adapter proteins bringing together IRS1 or IRS2 with elongin BC ubiquitin ligase, thereby targeting the IRS proteins for proteasomal degradation and inhibiting insulin action for example in mouse liver (144, 145).

Also dysregulated transcriptional components may negatively influence insulin signaling.

Expression of the insulin receptor, for example, is mediated by the forkhead family transcription factor FOXO1, acting as transcription factor in a feedback mechanism (146).

FOXO1 activity is regulated by insulin signaling itself via phosphorylation through Akt, ultimately leading to its nuclear export (147-149). Nuclear export upon phosphorylation leads to the inhibition of gene expression of genes originally activated by FOXO1, but also to activation of gene expression of genes originally repressed by FOXO1 (150, 151).

The nutritional state of cells, as shown for C2C12 cells, mediates phosphorylation of FOXO1 and thereby FOXO1 serves as an insulin sensor. When cells are starved, FOXO1 is unphosphorylated and thus resides in the nucleus, where it induces expression of the insulin receptor gene upon binding to the promoter. When insulin is added to the cells, insulin signaling promotes FOXO1 phosphorylation through Akt, which ultimately reduces insulin receptor expression (152). This mechanism allows for rapid transmission of the insulin signal when nutrient levels are high. As in the pathophysiology of obesity, insulin levels are constantly increased, also FOXO1 phosphorylation is elevated, in turn reducing the amount of transcribed insulin receptor mRNA and thus also reducing the amount of insulin receptor (152).

Posttranscriptional gene silencing mediated by miRNA species has been identified to be a

potent regulator in the control of protein expression. miRNA-143 is overexpressed in the

liver of obese mice and was identified to cause a reduction of Akt activation, thus leading

to impaired insulin signaling (153). Furthermore, in mice overexpressing miRNA-143,

(29)

1 Introduction glucose homeostasis was compromised, whereas in mice with miRNA-143 deletion, protection from obesity-induced insulin resistance was detected (153).

On the other hand, insulin resistance may already start with mutations at the genomic level, disturbing functional expression of signaling components. Almost two decades ago, a missense mutation in the insulin receptor gene was detected in individuals suffering from hereditary insulin resistance, exchanging the amino acid alanine (Ala1134) to threonine and thereby affecting the tyrosine kinase domain of the receptor (154). Thus, in spite of regular binding of insulin to the receptor, impaired induction of autophosphorylation of the intracellular domains prevented functional downstream signaling. In line with these findings, insulin receptor knockout mice display hyperglycemia and hyperinsulinemia, however also leading to fatal ketoacidosis shortly after birth (155, 156).

Further downstream, a polymorphism is known featuring a glycine to arginine (G972R) mutation of IRS1, which is associated twice as often with type 2 diabetes mellitus patients than healthy individuals (157). The polymorphism is located close to two tyrosine phosphorylation sites in the p85-binding domain of IRS1 and leads both to reduced tyrosine phosphorylation and increased IRS1 binding to the insulin receptor inhibiting its autophosphorylation, ultimately reducing systemic insulin sensitivity (158).

IRS1 deletion accordingly revealed a similar outcome with mild insulin resistance in mice (87, 88) and even simultaneous heterozygous deletion of insulin receptor and IRS1 causes severe insulin resistance with the development of diabetes, more closely resembling the situation seen in human patients (159).

Downstream of insulin receptor and the IRS proteins, function of protein kinase B # (Akt2), a mediator in the insulin signaling pathway, can be disturbed by a polymorphism in the human Akt2 gene (160). As expected, expression of mutant Akt2 carrying the polymorphism leads to disruption of insulin sensitivity in cell culture. Further also co-expressed wildtype Akt2 function is inhibited (160). In mice, the deletion of Akt2 impairs the regulation of blood glucose and leads to a diabetes-like syndrome (161).

Glucokinase is a key enzyme in homeostasis of blood glucose, and its genetic alteration can cause early onset type 2 diabetes mellitus (162), by a variety of different mutations (163).

Although these single gene mutations served as an explanation for the basis of insulin

resistance in the respective patients, overall monogenic alterations only rarely account for

(30)

11..44 P Prrootteeoom miicc ssttuuddiieess iinn tthhee ccoonntteexxtt ooff iinnssuulliinn ssiiggnnaalliinngg

As the development of type 2 diabetes is inextricably connected with obesity and insulin resistance, numerous studies have been conducted trying to elucidate the development of insulin resistance and to find the underlying mechanisms causing the disease (87, 88, 92, 165). In the course of time, various mediators of insulin resistance have been identified, like the serine/threonine kinases JNK and IKK (111, 112). However, so far the known mechanisms only give an incomplete view on the insulin resistant state. Moreover, research specifically defining key mediators involved in insulin resistance mechanisms was further complicated by the lack of suitable methods to tackle this complex protein network.

In recent years however, holistic and quantitative proteomic studies were made possible by the development of high-performance mass spectrometry with high sensitivity suited for the analysis of complex protein networks.

Originally, mass spectrometry evolved from the studies of Eugen Goldstein and Wilhelm Wien in the late 19

th

century, before in 1918 the first mass spectrometer was developed. Further improvements led to increasing mass accuracies and adaptations were made for the use with amino acids and peptides in 1958 (166). The principle of mass spectrometry is based on the analysis of mass-to-charge ratios of ionized and thus charged compounds or their fragments. In 2002 the Nobel Prize in chemistry was awarded to John B. Fenn and Koichi Tanaka for the development of electrospray ionization and soft laser desorption, which made biological macromolecules a more feasible source for mass spectrometry. Matrix-assisted laser desorption/ionization time- of-flight (MALDI/TOF) tandem mass spectrometry and liquid chromatography-coupled electrospray ionization (LC-ESI) mass spectrometry as standard tools for protein identification have been established for peptide mass fingerprinting and peptide sequencing (167, 168).

Based on those powerful tools to examine the components of protein networks, recently several proteomic studies have emanated dealing with the insulin signaling pathway.

Via peptide immunoprecipitation with an antibody directed against phospho-tyrosine

residues, tyrosine phosphorylation sites of components of the insulin signaling cascade

were characterized in a time-dependent setting in 3T3-L1 adipocytes. In a total of

89 different proteins changing their phosphorylation state, the study found 122 tyrosine

phosphorylation sites, of which again 89 increased at least 1.3 fold upon insulin

(31)

1 Introduction treatment. A total of 69 novel phosphorylation sites were identified in the adipocyte proteome (169).

Another study that combined a similar immunoprecipitation approach with high-resolution mass spectrometry and stable isotope labeling of amino acids in cell culture (SILAC) in differentiated brown adipocytes found 40 insulin-induced tyrosine phosphorylations on proteins involved in insulin signaling. Among those, 7 were described for the first time, for example SDR, PKC' binding protein, LRP-6 and PISP/PDZK11 (132).

Further research has led to the identification of IRS1-specific phosphorylations and based upon these, also protein interactions. In myotubes derived from C2C12 cells, 52 interacting proteins were identified specifically interacting with 109 phosphorylation sites in the insulin receptor, the IGF-1 receptor and IRS1 and IRS2 (133). A SILAC approach was combined with pulldowns of synthetic peptides, which were either phosphorylated or unphosphorylated. Although this procedure is based on an artificial approach, several proteins were found in pulldowns of IRS1 specific peptides, which have been previously described, like Grb2 or the p85 subunit of PI3K (133).

A new mass spectrometry-related method has been used in a study, dealing with insulin- stimulated IRS1 interactions. To this end, endogenous IRS1 was co-immunoprecipitated with interacting proteins and subsequently these protein complexes were subjected to mass spectrometry analysis. The results were quantified with a label-free method relating the site-specific abundance of phosphorylations to the respective precursor ions, finally leading to the identification of 11 novel insulin-stimulated IRS1 interactions in L6 myotubes (130). An earlier related study of the same group concentrated on the quantification of serine phosphorylations in human IRS1 after insulin treatment in vitro using a similar technique (131).

In addition to the classical approach using co-immunoprecipitations as a means of characterizing protein interactions, a method combining affinity purifications with mass spectrometry-based interactomics was developed, with the aim to analyze protein interactions and their implications on a larger scale. Direct assessment of protein interactions was made practicable by the development of numerous protein tagging strategies, which have added to the understanding of protein interactions, like myc-tag, His-tag or FLAG-tag (170).

Further, using the affinity of streptavidin to biotin produces considerable advantages over

antibody-driven purifications due to high affinity with a dissociation constant of 10

-15

M

(32)

experiments with superior purities compared to the His-tag or maltose-binding protein-tag (172).

From these one-step purifications using single tags, a number of tandem affinity purification (TAP) techniques evolved, driven by the need to further reduce the possibility of false-positive identifications originating from unspecific binding.

The first tag of this kind, composed of calmodulin binding peptide (CBP), a TEV cleavage site, and protein A, was used in yeast (173). Subsequently, the same tag was also adapted for mammalian cell culture (174) and interestingly, even used with IRS1 as bait protein (175). The study identified 35 interacting proteins specifically induced upon IGF-1 signaling, of which 5 were verified by co-immunoprecipitations (175).

Later, also a different TAP tag, the Strep II-FLAG-tag was developed (176). Recently, even a triple tag combining the streptavidin and calmodulin binding peptide tags with a His-tag was developed and successfully used on Bruton’s tyrosine kinase in HEK-293 cells (177).

One disadvantage of the so far developed tandem affinity purification methods is insufficient yield. In all tags, which require a time-consuming TEV cleavage step, low yield is mostly due to insufficient cleavage, so most of the material is lost after the first purification step. For higher efficiency, therefore SBP and CBP tags were combined in order to facilitate a purification of the bait protein in native buffer conditions with the possibility for specific elution.

11..55 O Obbjjeeccttiivveess

As described in literature, obesity and insulin resistance, as well as type 2 diabetes as a result of different risk factors, are becoming a progressing problem in society. However, the exact molecular changes that occur during development of the disease have yet to be determined completely.

Among all major insulin-responsive organs, the liver plays an important role in glucose,

protein, and lipid homeostasis. But still, the basis of the molecular derailment in the

development of hepatic insulin resistance and type 2 diabetes mellitus is not fully

understood. Thus, the influence of inhibitory pathways impinging on insulin signaling has

been one of the most intensively studied topics related to insulin resistance. IRS proteins

have been identified as a central target in the modulation of insulin signaling by various

kinases, but a complete picture of the cooperation of different kinase pathways was so far

out of reach.

(33)

1 Introduction In this study, in order to facilitate purification of IRS1-associated protein complexes, a novel mouse model was established, featuring an affinity tagged IRS1 protein, which can be expressed specifically in liver.

Further, proteomic state-of-the-art techniques were applied, enabling the extensive

quantitative analysis of in vivo protein interactions in the liver. To assess IRS1 interactions

related to diet-induced obesity and insulin resistance, IRS1 interaction profiles in different

nutritional conditions were examined as well as in basal and insulin-stimulated states.

(34)

22 M Maatteerriiaallss aanndd m meetthhooddss

22..11 M Moolleeccuullaarr bbiioollooggyy tteecchhnniiqquueess 2.1.1 General considerations

All molecular biology techniques were performed according to standard protocols by Sambrook et al. (178) unless otherwise mentioned. For the display of DNA sequences of vectors and genes, the Gene Construction Kit Software was used (Textco Biosoftware, version 2.5).

2.1.2 Cloning PCR

Polymerase chain reaction (PCR) was employed for the amplification of specific DNA fragments for cloning purposes like the creation of insert DNA or the generation of Southern blot probes. Primers used to this end were custom made by Eurogentec (Table 1).

Table 1: Primers used for cloning PCRs. Sequences in 5’-3’ direction.

Primer name Primer Sequence

IRS1pCTAP1 TAA GCA ACT ATG CCA GCA TCA GCT TCC AGA AGC AGC CAG AGG ATC GTC AAG ACG AGA AG ACC ACC GGC TGG IRS1pCTAP2 TCT TCT GAC TTT GCC ACC ATA AAA ACG CAC CTG CTG

TGA TGT CCA GTT ACG CGA TCG CCT AGG GGT AAC C IRS1TTori1 CCA TTT TGA TAA GAT TCT TGC TAC AGG CTC TGC TTG

TTG AAG TAA ATT TGG TCT TAG ACG TCA GGT GGC ACT

IRS1TTori2 TGG GGG CGC TGG GGC GGA GGG GAC GCG GGT GAC

CTG CTA GCT CTC ACC CAA ACC GGT GCG TCA GCA GAA TAT

IRS1TTAcsI1 GGC GCG CCA CCA TGG CGA GCC CTC CGG IRS1TTAscI2 GGC GCG CCT CTA AAG TGC CCC GGA GGA Neoprobe1 GCC GCC AAG CTC TTC AGC AAT AT

Neoprobe2 TGA ATG AAC TGC AGG ACG AGG CA

IRSprobe1 GGC GCG CCA CCA TGG CGA GCC CTC CGG ATA CC

IRSprobe2 GTC TGG CAG GTT ATC CTG AAA

(35)

2 Materials and methods For general cloning PCRs, a total volume of 25 µL per reaction was used, consisting of 25 pmol of the respective primers, 25 µmol dNTP mixture (Genaxxon, #M3015.4100), 0.5U DreamTaq Green DNA Polymerase (Fermentas, #EP0714) and DreamTaq Green Buffer. PCR reactions were performed in a DNA Engine Dyad Peltier Thermal Cycler (bio-rad) and standard cycling protocols were used.

For the generation of insert DNA for BAC cloning or TOPO TA cloning, High Fidelity PCR Master (Roche, #12 140 314 001) with proofreading function was used. Reactions of a total volume of 50 µL were set up as suggested by the manufacturer and 50 pmol of the primers (IRS1pCTAP1 and 2, IRS1TTori1 and 2, or IRS1TTAcsI1 and 2, Table 1) were added. The cycling program was adapted from the user instructions.

PCR reactions were analyzed on 1% (w/v) agarose gels substituted with 0.5 mg/mL ethidium bromide run in TAE buffer (40 mM Tris base, 1 mM EDTA, 20 mM glacial acetic acid).

2.1.3 DNA sequencing

Big Dye terminator v3.1 cycle sequencing kit (Applied Biosystems, #4337455) was used for DNA Sequencing based on the sequencing method developed by Sanger et al. (179).

Concerning DNA amounts and reaction conditions the manufacturer’s instructions were followed. Analysis of the sequencing reaction was done at the Cologne Center for Genomics at the University of Cologne. Verification of the final insert IRS1-TapTag sequence was performed with the primers listed below (Table 2).

Table 2: Sequencing primers used for verification of insert IRS1-TapTag DNA.

Primer name Primer Sequence

Seq1 TTT CAG GAT AAC CTG CCA GAC

Seq2 TGA TGC TGG ACG GGA CAT GGT

Seq3 CTT TCG AAA CCG GTT ATC CAG

Seq4 ACT ACC ACT GGG TGA CAT CAT

Seq5 TGT GAG GCT TGA CTC TGG CCT

Seq6 CAT GTA GTC ACC ACG GCT ATT

Seq7 ACA CAC TGG AGC CGA CTC CTT

Seq8 AAGGAGTCGGCTCCAGTGTGT

Seq9 TACATAGACCTGGATTTGGC

(36)

2.1.4 Gel extraction

DNA fragments were excised manually from agarose gels under UV light and purified using E.Z.N.A. gel extraction kit (Omega Bio-Tek, # D2501-01) as described in the manufacturer’s instructions.

2.1.5 Red E/T Recombination

The IRS1 BAC (bacterial artificial chromosome, BACPAC Resources Center, Children’s Hospital Oakland Research Institute, #RP23-430H22) was modified by Red E/T Recombination (180, 181) as outlined in the technical protocol for the Counter- Selection BAC Modification Kit (Gene Bridges, #K002). In brief, an overnight culture of the BAC containing bacteria was transformed with the red E/T recombination vector by electroporation. Then, the transformed bacteria were grown at 30°C until an OD600 of 0.3, when 50 µL of 10% L-Arabinose (Sigma, #A-3256) were added to a total amount of 1.4 mL of BAC culture. After 60 minutes at 30°C and another 60 minutes at 37°C transformation by electroporation was carried out with 600 ng of pCTAPneokana insert DNA containing homology arms produced with IRS1pCTAP1 and 2 primers (Table 1).

Cultures were incubated another 70 minutes at 37°C to allow for recombination and finally spread on agar plates.

Another BAC recombination step was performed on the resulting IRS1-TapTag BAC with the origin of replication of the pACYC177 plasmid (NEB, #E4151S) (182). For the amplification of the origin of replication with homology arms, primers IRS1TTori1 and 2 (Table 1) were used in a proofreading PCR.

2.1.6 Transformation of competent bacteria

Plasmids containing DNA constructs of interest were transformed into chemically competent TOP10 bacterial cells (Invitrogen, part of #K4500-01) by exposure to 42°C for 45 seconds, followed by 2 minutes on ice. Subsequently, cultures were grown in LB-medium for 1 hour at 37°C and spread on agar plates.

2.1.7 Purification of plasmid DNA

Bacteria containing plasmids of interest were grown overnight at 37°C in LB medium (AppliChem, AppliChem, #A0954) with 100 µg/mL Ampicillin (AppliChem, #A0839).

Depending on further use of purified vector DNA either a miniprep or maxiprep was

performed with QIAGEN Plasmid Mini or Maxi Kit (QIAGEN) following the manufacturer’s

(37)

2 Materials and methods instructions. Minipreps of BAC DNA were prepared omitting the usage of supplied columns.

2.1.8 TOPO TA cloning

TOPO TA cloning (Invitrogen, #K4500-01) was used to insert the construct into the pCR2.1-TOPO vector according to the instructions manual. Next, the final vector was transformed into chemically competent TOP10 bacterial cells and the fusion construct was cut from the pCR2.1-TOPO vector by AscI restriction digest (Fermentas, #ER1892) following the product instructions.

2.1.9 Ligation

Ligation of vector and insert was performed overnight at 16°C with T4 DNA Ligase (NEB, #M0202S).

2.1.10 Linearization

For further ligation DNA vectors were linearized by digestion with AscI (Fermentas, #ER1892) and overhangs were dephosphorylated by shrimp alkaline phosphatase (Fermentas, #EF0511) for one hour at 37°C. The vector was then purified by sodium acetate precipitation.

An amount of 50 µg of the gene targeting vector was linearized with 30 units of the restriction enzyme AsiSI (Fermentas, #ER2091) and in buffer conditions recommended by the manufacturer overnight at 37°C.

2.1.11 Phenol chloroform extraction

DNA for transfection was purified by phenol chloroform extraction. One volume of phenol : chloroform : isoamyl alcohol 25:24:1 (AppliChem, # A0944) was vigorously mixed with the DNA solution and spun down at 17,000 x g for 15 minutes. Subsequently the upper phase was vigorously mixed with one volume chloroform. Another centrifugation step of 10 minutes followed and the upper phase was subjected to isopropanol precipitation with an equal volume. DNA was pelleted and washed with 70% ethanol.

Finally, the DNA pellet was dried for ES cell transfection or stored at -20°C in 70%

ethanol.

Abbildung

Figure 1:  Development of age-standardized  mean BMI (black line) and 95%  uncertainty  intervals (shaded area) between 1980 and 2008
Figure 2:  The insulin signal transduction pathway. Insulin binds to the insulin receptor on the  cell surface,  facilitating  conformational change and thus autophosphorylation on  intracellular domains
Figure 3:  Comparison of protein structures of mouse insulin receptor substrates; from (85)
Figure 4:  Known serine phosphorylation  sites on IRS1 and IRS2 and the respective kinases  inducing the phosphorylation
+7

Referenzen

ÄHNLICHE DOKUMENTE

Activation of the JNK Pathway Is Implicated in IRS-1 mRNA Expression—To study the involvement of JNK in the synthesis of IRS-1 mRNA, FAK ⫺/⫺ cells were treated with anisomycin

Der zerebralen Ischämie im Allgemeinen konnten verschiedene ätiopathogenetische Grundlagen zugeordnet werden. Eine grobe Einteilung lässt sich durch die Differenzierung in

Insulin-like growth factor (IGF) binding protein-2, independently of IGF-1, induces GLUT-4 translocation and glucose uptake in 3T3-L1 adipocytes.. OXID MED CELL

Membranes prepared from insect cells expressed the 5-HT 7(a) receptor wild type and different C-terminal cysteine mutants were incubated with [ 35 S]-GTPγS in the presence or

Figure 36 Severe alteration of different signalling pathways in the hippocampus of IRSp53 haploinsufficient and deficient mice following NMDA receptor dependent LTP induction..

Die Immunzytochemie von PIST und Giantin, einem integralen Membranprotein des cis- und medialen Golgi-Apparates, zeigt, dass die Proteine nah bei einander lo- kalisiert sind

Dieses geschieht dadurch, daß nach .Sub- traktion der unspezifischen Bindung (hier nach Sub- traktion des bei der höchsten totalen Insulinkonzen- tration von 409 / Testansatz

As there was a difference observed between the percentage of 1C5-positive cells in the CD4 single-positive and the CD8 single-positive thymocytes it became important to know not