Exploring the influence of B cell receptor signaling components on the development and
homeostasis of B cells
Inaugural-Dissertation zur
Erlangung des Doktorgrades Dr.nat.med
Der Medizinischen Fakultät und
der Mathematisch-Naturwissenschaftlichen Fakultät der Universität zu Köln
vorgelegt von Jian Song
aus Heilongjiang, China
Köln 2007
Berichterstatter: Prof. Sigrun Korsching
Prof. Hinrich Abken
Tag der mündlichen Prüfung: Juni 2007
Für
靳慧明und
宋希萌ABBREVIATIONS _________________________________________________________ 8 1 INTRODUCTION______________________________________________________ 11 1.1 B Cell Development________________________________________________________ 11
1.1.1 Regulation of B Cell Development by the Pre-BCR (positive selection)____________________12 1.1.2 Regulation of B Cell Development by the BCR (Negative Selection)______________________12 1.2 The B Cell Receptor Complex_______________________________________________ 13 1.2.1 IgM versus IgG1 B Cell Receptor _________________________________________________13 1.2.2 Igα and Igβ___________________________________________________________________14 1.2.3 B Cell Response and B Cell Receptor Signaling______________________________________15 1.2.4 Aim of the Project _____________________________________________________________15 1.3 Smad7___________________________________________________________________ 16 1.3.1 Smad7 Works as an Inhibitor of TGF-β Signaling_____________________________________16 1.3.2 TGF-β-associated Diseases by Aberrant Expressions of Smad7__________________________17 1.3.3 TGF-β and B Lymphocytes ______________________________________________________18 1.3.4 Aim of the Project _____________________________________________________________19 1.4 NF-кB inducing kinase (NIK) _______________________________________________ 19 1.4.1 The NF-кB Family Members and Their Regulation____________________________________19 1.4.2 NIK Deficient Model ___________________________________________________________20 1.4.3 Aim of the Project _____________________________________________________________21 1.5 BAC Strategy for Gene Targeting____________________________________________ 21 1.5.1 BAC (bacterial artificial chromosome)______________________________________________21 1.5.2 RED/ET Cloning ______________________________________________________________21
2 MATERIALS AND METHODS___________________________________________ 23 2.1 Chemicals and Biological Material___________________________________________ 23 2.2 Molecular biology_________________________________________________________ 25 2.2.1 Competent Cells and Isolation of Plasmid DNA ______________________________________25 2.2.2 Preparation of BAC DNA________________________________________________________25 2.2.2.1 Mini Preparation of BAC DNA _______________________________________________25 2.2.2.2 Maxi Preparation of BAC DNA _______________________________________________25 2.2.3 Preparation of Genomic DNA ____________________________________________________26 2.2.3.1 DNA Extraction from Mouse Tail Biopsies ______________________________________26 2.2.3.2 DNA Extraction from ES Cells (96-well micro titer plates)__________________________26 2.2.4 Preparation of RNA ____________________________________________________________27 2.2.4.1 RNA Extraction by using TRIzol Reagent _______________________________________27 2.2.5 cDNA Synthesis_______________________________________________________________27 2.2.6 Agarose Gel Electrophoresis and DNA Gel Extraction_________________________________28 2.2.7 DNA Sequencing______________________________________________________________28 2.2.8 Polymerase Chain Reaction (PCR)_________________________________________________28 2.2.9 Southern Blot_________________________________________________________________28 2.2.9.1 Preparation and Transfer of the DNA Samples ___________________________________29 2.2.9.2 Hybridization _____________________________________________________________29 2.2.10 Red/ET Cloning ______________________________________________________________30 2.2.10.1 Transformation of pSC101-BAD-gbaA into the E. coli Strain Carrying the BAC________31 2.2.10.2 Cloning of a PCR Product with Homology Arms into a BAC by Red/ET ______________31 2.3 Cell Culture______________________________________________________________ 32 2.3.1 Reagents and Media for Cell Culture_______________________________________________32 2.3.2 Equipment ___________________________________________________________________33 2.3.2.1 Dishes and Plastic Ware _____________________________________________________33 2.3.2.2 Devices __________________________________________________________________34 2.3.3 Maintenance of Cells___________________________________________________________34 2.3.4 Freezing and Thawing of Cells____________________________________________________34 2.3.5 Determination of Cell Numbers___________________________________________________35 2.3.6 Murine Embryonic Feeder Cells___________________________________________________35
2.3.6.1 Embryonic Feeder Cell Preparation ____________________________________________35 2.3.6.2 Mitomycin C Treatment _____________________________________________________36 2.3.7 Murine Embryonic Stem Cells____________________________________________________36 2.3.7.1 Transfection of ES Cells _____________________________________________________37 2.3.7.2 Selection for Targeted Clones in Culture ________________________________________37 2.3.7.3 ES Cell Screening in 96-well Microtiter Plates ___________________________________38 2.3.8 HTNC Treatment______________________________________________________________38 2.3.8.1 Preparation of Targeted ES Cell Clones for Blastocyst Injection______________________39 2.3.8.2 Blastocyst Injections and Transfers ____________________________________________39 2.3.9 Preparation of Single Cell Suspensions From Lymphoid Organs _________________________40 2.3.10 Preparation of Peripheral Cells from Mouse Blood___________________________________40 2.3.11 Flow Cytometry ______________________________________________________________41 2.3.12 Magnetic Cell Sorting and FACS Sorting __________________________________________42 2.3.13 B Cell Receptor Internalization __________________________________________________42 2.3.14 Calcium flux_________________________________________________________________42 2.3.15 Culture of ex vivo Splenocytes and Lymphocytes ____________________________________42 2.3.16 CFSE Labeling and in vitro B cell Activation _______________________________________43 2.3.17 Induced Class Switch Recombination _____________________________________________43 2.3.18 Histological Analysis and Immunohistochemistry____________________________________43 2.3.19 Preparation and Immunostaining of Cytospins_______________________________________44 2.3.20 Protein Extract Preparations_____________________________________________________44 2.3.21 Western Blot_________________________________________________________________44 2.4 Mouse Experiments________________________________________________________ 45 2.4.1 Mice________________________________________________________________________45 2.4.2 NP-CG Immunization___________________________________________________________46 2.4.3 ELISA_______________________________________________________________________46
3 Results _______________________________________________________________ 48 3.1 Generation of IgG1i mice___________________________________________________ 48 3.2 Generation of IgαΔc/IgG1i, IgβΔc/IgG1i and IgαΔc/IgβΔc/IgG1i mice________________ 48
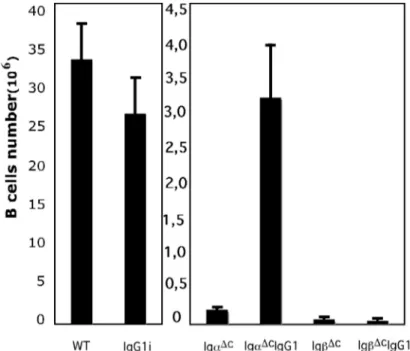
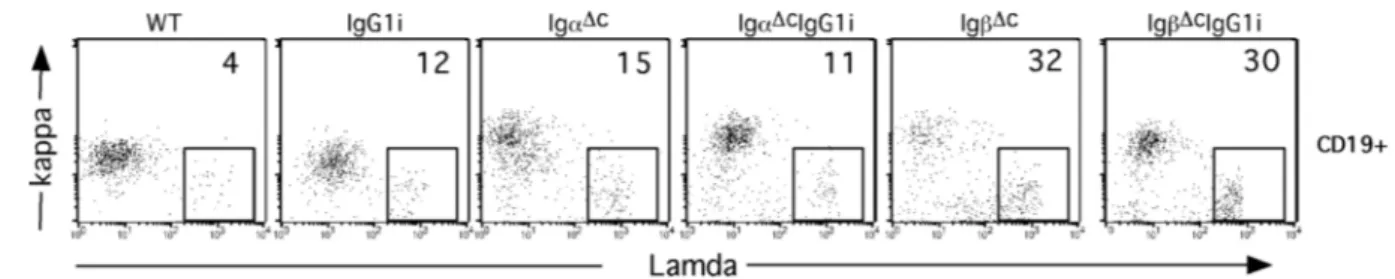
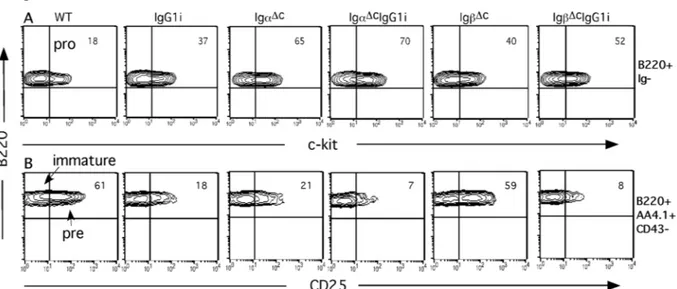
3.2.1 IgG1 affects B cell compartments distinctly and diversely when in combination with intact or mutant Igα and Igβ BCR subunits _______________________________________________________50 3.2.2 IgG1 expression compromises B cell development in the BM.___________________________51 3.2.3 Competition of IgG1 and IgM during B cell development_______________________________53 3.3 IgG1 signal in supporting B cells survival and proliferation ______________________ 55 3.3.1 IgαΔc or IgβΔc B cells are sensitive to apoptosis_______________________________________55 3.3.2 Proliferation capacity of IgG1i, IgαΔcIgG1i and IgβΔcIgG1i B cells_______________________57 3.4 IgG1 derived BCR signaling ________________________________________________ 58 3.4.1 IgG1 expression increases B cell activation in response to BCR engagement ________________58 3.4.2 BCR internalization and signaling of IgG1i, IgαΔcIgG1i and IgβΔcIgG1i B cells_____________59 3.5 IgG1 expression promotes the B cell maturation________________________________ 63 3.6 B-1 B cells in the peritoneal cavity of IgG1 expressing mice_______________________ 64 3.7 Serum IgG1 level in the IgG1 expressing mice__________________________________ 64 3.8 IgG1 B cells in Igα/Igβ double mutant mice ___________________________________ 65 3.9 Deficiency of Smad7 in B cells enhanced IgA class switch ________________________ 67 3.9.1 Generation of Smad7FL/FL mice____________________________________________________67 3.9.2 Generation of CD19Cre Smad7FL/FL mice____________________________________________68 3.9.3 B cell homeostasis in the BM and Spleen of CD19Cre Smad7FL/FL mice____________________69 3.9.4 Smad7 mediates TGF-β-controlled class switch_______________________________________70 3.10 Targeting NIK gene by BAC strategy________________________________________ 73 3.10.1 Gene targeting of NIK__________________________________________________________73 3.10.2 Generation of the Modified NIKBAC _____________________________________________75 3.10.3 Generation of the ES Cell Line NIKflox_____________________________________________76
4 DISCUSSION _________________________________________________________ 79 4.1 IgG1 B cell receptors play distinct roles when in combination with Igα/Igβ mutation_ 79
4.1.1
γ
1 signals support the B cells survival______________________________________________80 4.1.2γ
1 signals in the BCR signaling___________________________________________________82 4.1.3γ
1 in combination with mutation of both Igα and Igβ__________________________________83 4.2 Signals of Smad7 in the B cells immunity______________________________________ 83 4.3 BAC strategy for the gene targeting__________________________________________ 86 5 Summary _____________________________________________________________ 88 6 Zusammenfassung______________________________________________________ 89 7 References ____________________________________________________________ 90 8 Acknowledgements _____________________________________________________ 98 9 VERSICHERUNG _____________________________________________________ 99 10 LEBENSLAUF ______________________________________________________ 100ABBREVIATIONS
A adenosine
Amp ampicillin
APC allophycocyanin
BCR B cell receptor
β-me β-mercaptoethanol
bp base pair
B4 Bruce-4
BSA bovine serum albumin
C cytosine
°C temperature in degrees Celsius
CD cluster of differentiation
cDNA complementary DNA
cpm counts per minute
Cre site-specific recombinase
C region constant region
Cyc cychrome
dNTP desoxyribonucleotide-triphosphate
DMEM Dulbecco’s modified Eagle medium
DMSO Dimethyl sulfoxide
DNA desoxyribonucleic acid
ds double-stranded
DTT 1,4-Dithio- DL-threitol
E. coli Escherichia coli
EDTA ethylene-diaminetetraacetic acid
EF embryonic fibroblasts
ES embryonic stem
EtBr ethidium bromide
FACS fluorescence activated cell sorting
FCS foetal calf serum
FITC fluorescein-isothiocyanate
Flp site-specific recombinase, product of yeast FLP1-gene
FRT Flp recombination target
g gram
GANC ganciclovir
G418 geneticin sulfate
h hour/s
HEPES N-2-hydroxyethylpiperazine-N’-2-ethanesulfonic acid
Ig immunoglobulin
i.p. intraperitoneally
ITAM immunoreceptor tyrosine-based activation motifs
kb kilobase pairs
kD/ kDa kilodalton
L liter
LA long arm of homology
LB Luria-Bertani medium
LIF leukaemia inhibitory facto
loxP recognition sequence for Cre
M molar
MHC major histocompatibility locus
min minute
ml milliliter
mM millimolar
µl microliter
µM micromolar
MCS multiple cloning site
MMC mitomycin C
NaCl sodium chloride
NaOH sodium hydroxide
neo neomycin resistance gene
OD optical density
PBS phosphate buffered saline
PCR polymerase chain reaction
PE phycoerythrine
PIPES Piperazine-N,N’-bis(2-ethanesulfonic acid)
RNA ribonucleic acid
rpm revolutions per minute
RT room temperature
RU relative units
s second
SA short arm of homology
SDS sodium dodecyl sulfate
ss single-stranded
SSC sodium chloride/ sodium citrate buffer
TAE Tris-acetic acid-EDTA buffer
Taq Pol polymerase from Thermus aquaticus
TCR T cell receptor
TE Tris-EDTA buffer
Tris 2-amino-2-(hydroxymethyl-)1,3-propandiole
TWEEN polyoxyethylene-sorbitan-monolaureate
U units
UV ultraviolet
V volts
V region variable region
v/v volume per volume
w/v weight per volume
wt wild type
X-Gal 5-Bromo-4-chloro-3-indolyle/β-galactopyranoside
5’ five prime end of DNA sequences
3’ three prime end of DNA sequences
1 INTRODUCTION
B cells are an important component of adaptive immunity. They produce and secrete millions of different antibody molecules, each of which recognizes a different (foreign) antigen. The fact that B lymphocytes express a very large repertoire of antibodies is due to the complex mechanism of V(D)J recombination of immunoglobulin (Ig) genes as well as other processes including somatic hypermutation, gene conversion and class switch recombination.
On the other hand, these development processes are tightly controlled, where over 75% of the developing cells become apoptotic because of inappropriate immunoglobulin gene rearrangements resulting in recognition of self antigens or lack of signal transduction through newly formed BCR. (Ollila and Vihinen, 2005)
1.1 B Cell Development
B-lymphocytes follow a highly ordered program of development in the bone marrow (BM) (Fig.1), beginning with the commitment of lymphoid progenitors to the B lineage and the somatic recombination of heavy chain (HC) Ig alleles. After an initial rearrangement of diversity (DH) to joining (JH) gene segments, pro-B cells rearrange one of many upstream variable (VH) region segments to the D-JH segment, creating the V(D)J joint. Cells with a productive protein-encoding HC rearrangement express the HC together with the invariant surrogate Ig light chains VpreB and λ5 to form a pre-B cell receptor (Pre-BCR). Upon expression of the pre-BCR, cells undergo clonal expansion before initiation of rearrangements at the light chain (LC) loci (Espeli et al., 2006; Jung et al., 2006). A productive LC rearrangement results in the cell surface expression of IgM, defining entry into the immature B cell stage. A major selection event befalls these immature B cells in the BM where they interact with self-Ag. Self-reactive B cells are extinguished by three well-characterized mechanisms: receptor editing,apoptosis, and anergy. Throughout this process, appropriate BCR signalsare required for B cell development and survival (Edry and Melamed, 2004). The B cells with aberrant BCR signals are deleted during positive and negative selection, which ensures the generation of a functionally competent, non-autoimmune repertoire.
Fig.1 Receptor editing is activated throughout B lymphopoiesis. Selection checkpoints mediated by the pre-BCR or the BCR are specified in the schematic. B cells that fail to fulfill appropriate receptor requirements stimulate receptor editing and undergo secondary recombination (Edry and Melamed, 2004).
1.1.1 Regulation of B Cell Development by the Pre-BCR (positive selection)
VH to DHJH rearrangement is initiated in the transition from pre-B I to large pre-B II cells (Rolink et al., 2001). When an in-frame VHDHJH rearrangement occurs, the subsequently expressed µH chain protein can pair with the surrogate light chain (SL) components λ5 and VpreB. Upon association with the signal-transducing Igα and Igβ subunits, the pre-BCR complex is formed and can be active at the cell surface.
About 10% of pre-B I cells in the bone marrow express µH chain in the cytoplasm. Not all of these µH chains, however, are capable of forming a pre-BCR (Martensson et al., 2002).
At the transition from pre-B I to pre-B II, those cells expressing a µH chain capable of forming a pre-BCR are positively selected and enter into cellular division and expansion.
(Melchers, 2005; Zhang et al., 2004).
1.1.2 Regulation of B Cell Development by the BCR (Negative Selection)
The next checkpoint in B cell development occurs during progression from immature to mature B cell stages, where encountering antigen capable of cross-linking BCR typically leads to one of three results in immature B cells: (a) cells are eliminated (clonal deletion); (b) cells are rendered non-responsive and short lived (anergic); or (c) cells revise their BCR to eliminate self-reactivity (editing) (Hardy and Hayakawa, 2001). High-affinity interactions with membrane-bound antigen result in deletion, whereas lower-affinity interactions and soluble antigens will result in editing or anergy (Benschop et al., 1999; Lang et al., 1996).
Immature B cells, which have not been negatively selected in the BM after exposure to self antigen, may migrate from the BM and through the terminal branches of central arterioles into the spleen. These splenic immature B cells, which will only survive for 4 days,
differentiate into mature B cells with a lifespan of around 15 weeks (Rolink et al., 1998). In the BM, however, 90% of the immature B cells will be negatively selected and lost before migration to the spleen.
As pre-BCR signaling results in a transient down-regulation of recombination activating gene (RAG) expression (Grawunder et al., 1995), production of a BCR appears critical in final cessation of Rag expression, as well as in Ig light chain rearrangement. Hence, productive B cell development requires expression of a light chain that can efficiently pair with a particular HC to form a cell surface BCR. However, the resulting BCR must not signal above some critical threshold (Lang et al., 1996). Otherwise, it appears that Rag expression continues, allowing further light chain kappaV genes to rearrange and produce alternative light chains to effectively pair with HC. In order to successfully generate a non-autoreactive BCR, this light chain editing process can continue on both kappa alleles and eventually proceed to the second light chain locus, resulting in lambda light chain expression (Tiegs et al., 1993).
1.2 The B Cell Receptor Complex
The B cell antigen receptor (BCR) is a hetero-oligomeric structure composed of antigen binding membrane immunoglobulin, and transducer-transporter substructures. The transducer- transporter substructure is composed of disulfide-linked dimers of immunoglobulin (Ig)α and Igβ subunits. Naive B cells express BCRs that contain H chains of µ and δ (IgM and IgD) as antigen receptors,but after contact with antigen they can switch and use the membrane forms of γ, ε, and α (IgG, IgA, or IgE).
1.2.1 IgM versus IgG1 B Cell Receptor
While the Ig heavy (H) chains of the classes γ, ε and α carry evolutionarily conserved cytoplasmic tails of 14 to 28 amino acids, such structures are lacking in µ and δ chains (Geisberger et al., 2003; Neuberger et al., 1989; Reth, 1994). As the latter are expressed in developing and mature naïve B cells, the signaling function of the B cell antigen receptor (BCR) on those cells is thought to rely entirely on the cytoplasmic tails of the BCR-associated Igα/β heterodimer. However, in the generation of B cell memory, most of the antigen- activated B cells participating in the response switch to the expression of other antibody isotypes, and the BCR on these cells acquire the cytoplasmic tail of the newly expressed IgH chain as an additional signaling module. The functional importance of this module has become apparent in experiments in which the gene segments encoding the cytoplasmic tails of the constant (C) regions of the γ1 and ε chain, respectively, were deleted in the mouse germ-
line and a profound deficiency in the development of IgG1 or IgE expressing memory B cells was observed (Achatz et al., 1997; Kaisho et al., 1997). These results were complemented and supported by a study in which transgenic expression of γ1 or µ/γ hybrid chains conferring a particular antigenic specificity in combination with a transgenic κ light chain led to an enhanced generation of memory and plasma cell progeny upon antigenic challenge, due to reduced cellular attrition (Martin and Goodnow, 2002).
1.2.2 Igα and Igβ
The Igα/β heterodimer is expressed on the surface of B cells as part of the BCR complex. On the other hand, it is also integral to the pre-BCR. A functional pre-BCR is required for pre-B cell expansion and the down-regulation of further HC rearrangement. The importance of the Igα/β heterodimer in the pre-BCR is evidenced by the fact that only pro-B cells were detectable in mice containing truncations of both Igα and Igβ (Reichlin et al., 2001). Conversely, in mice containing either a truncated Igα or a truncated Igβ, the B lineage cells proceed through this checkpoint, undergo VH to DJH rearrangement and establish a pre-B cell population. In mice containing the Igβ truncation and therefore expressing a pre-BCR containing only functional Igα, normal numbers of pre-B cells were generated, indicating substantial pre-B expansion (Reichlin et al., 2001). In contrast, in mice containing the Igα truncation and therefore expressing a pre-BCR containing only Igβ, reduced numbers of pre-B cells were observed (Torres et al., 1996). Thus signals downstream of Igα appear more efficient at supporting the pro-B to pre-B transition or expanding pre-B cells.
Pre-B cells undergo rearrangement at the LC locus and those that express a functional BCR make the transition to immature B cells. Mice containing the Igβ truncation exhibited normal levels of immature B cells (Reichlin et al., 2001). On the contrary, in mice containing a truncated Igα, reduced levels of pre-B cells were matched by an equivalent reduction in immature B cell numbers (Torres et al., 1996). This suggests the possibility that the transition from pre-B to immature B cell is supported either by Igα or Igβ with equal efficiency.
After productive light chain rearrangement resulting in immature B cells, subsequent maturation generated a pool of mature recirculating B cells. The transition from immature to mature B cells is strikingly reduced in mice containing either the Igα or Igβ truncation, with most immature B cells undergoing programmed cell death (Torres et al., 1996). Consequently, while expression of the cytoplasmic domains of either Igα or Igβ is sufficient to support B lineage development to the immature B cell stage, albeit with differing efficiencies, the cytoplasmic domains of both Igα and Igβ are required for the efficient establishment of a mature B cell pool.
1.2.3 B Cell Response and B Cell Receptor Signaling
Antigen recognition by the BCR leads to a multitude of cellular responses in mature B cells. These responses include antigen internalization, T cell-independent B cell proliferation, and antibody production, as well as antigen presentation and the T cell-dependent antibody response. Experiments in cell lines and mice have provided insights into the proximal signaling requirements of the events after BCR engagement.
Aggregation of the BCR results in the phosphorylation of the immunoreceptor tyrosine- based activation motif (ITAM) tyrosine residues on Igα and Igβ by binding and activating spleen tyrosine kinase (Syk) and Lyn tyrosine kinase (Lyn) (Kurosaki, 1999), which are the first protein tyrosine kinases to be activated. Lyn stimulates receptor internalization and consequently negatively regulates aspects of BCR-dependent signaling (Ma et al., 2001).
Moreover, Lyn and Syk phosphorylated a specific set of proximal BCR signaling molecules such as Bruton’s tyrosine kinase (Btk), phospholipase Cγ2 (PLCγ2) (Fruman et al., 2000), which subsequently form a supramolecular complex upon BCR crosslinking, nucleated by the tyrosine phosphorylated form of the adaptor B cell linker protein (BLNK) (Chiu et al., 2002;
Fu et al., 1998; Wienands et al., 1998). This complex, also termed B cell signalosome, connects the BCR with pathways implicated in cellular activation and proliferation such as the calcium response and the nuclear factor κB (NF-κB) and mitogen-activated protein (MAP) kinase pathways (Gugasyan et al., 2000; Ishiai et al., 1999; Kur- osaki, 1999; Tan et al., 2001). Less is known about signaling requirements downstream of the BCR for the induction of antigen presentation to T cells and the T cell-dependent antibody response, although Syk may play a role in this respect (Lankar et al., 1998).
1.2.4 Aim of the Project
The conspicuous absence of the cytoplasmic tails in µ and δ chains could reflect peculiar signaling requirements in pre-B and immature B cells, predicting that expression of IgH chains with cytoplasmic tails would compromise B cell development. Indeed, while δ chains alone can perfectly well mediate B cell development (Lutz et al., 1998; Roes and Rajewsky, 1991), transgenic expression of γ chains of various classes often seemed to disturb normal development (Roth et al., 1995), sometimes promoting the generation of cells co- expressing endogenous µ and δ chains (Chu et al., 2004). However, the physiological significance of these experiments remained uncertain, given the variations in transgene copy number and consequently expression levels inherent in the experimental approach. In order to investigate the physiological role of γ1 chain containing BCRs, a new mouse model, termed
IgG1i, was generated in our laboratory using gene-targeting techniques. In this model the Cγ1 gene segment in the mouse germ line replaced the Cµ.
The signaling function of the B cell antigen receptor (BCR) on µ and δ cells is thought to rely entirely on the cytoplasmic tails of the BCR-associated Igα/β heterodimer. It remains to be answered whether the role of the γ1 chain in keeping B cells compartment is dependent on, or independent of, the Igα or Igβ chain. Therefore, mice homozygous for the Igα truncation mutation and homo- or heterozygous for IgG1i (IgαΔcIgG1i or IgαΔcIgG1i/+) or homozygous for the Igβ truncation mutation and homo- or heterozygous for IgG1i (IgβΔcIgG1i or IgβΔcIgG1i/+) were generated. We also generated the triple mutant mice that are homozygous for the Igα truncation mutation and homozygous for the Igβ truncation mutation as well as γ1 insertion (IgαΔcIgβΔcIgG1i). In those mouse models, we dissected the interaction among the IgG1, Igα and Igβ in each B cell developmental stage and evaluated B cell survival, proliferation and activation.
1.3 Smad7
While responding to pathogens the immune system maintains tolerance to self and harmless antigens. Multiple mechanisms operate to ensure this normal immunological function. Of those, transforming growth factor-β (TGF-β) is a potent regulatory cytokine with diverse effects on haematopoietic cells. The pivotal function of TGF-β in the immune system is to maintain tolerance via the regulation of lymphocyte proliferation, differentiation, and survival (Li et al., 2006a).
TGF-β receptor complex consists of TGFβRI (ALK5) and TGFβRII (Fig.4). Active TGF-β dimmer binds to the tetrameric ALK5 and TGFβRII receptor complex to initiate cell signaling. Activated ALK5 phosphorylates receptor-activated Smads (R-Smads), Smad2 and Smad3, which translocate into the nucleus in a complex with Smad4. The Smad complex binds to a target promoter in association with other transcription factors (TFs) and regulates gene expression via recruiting
histone acetyltransferase
(HAT) orhistone deacetylase
(HDAC). The regulatory activity of TGF-β is modulated by the presence of inflammatory cytokines and costimulatory molecules and by the intracellular inhibitory Smad proteins (I- Smads) that include Smad6 and Smad7.1.3.1 Smad7 Works as an Inhibitor of TGF- β Signaling
Smad7 regulates signaling of TGF-β in several ways (Fig.2). It is originally shown to compete with R-Smads for binding to activated type I receptors and thus to inhibit the
phosphorylation of R-Smads. Subsequently, they were found to recruit E3-ubiquitin ligases, known as Smad ubiquitination regulatory factor 1 (Smurf1) and Smurf2, to the activated type I receptor, resulting in receptor ubiquitination, degradation and termination of signaling.
Smad7 was also shown to recruit a complex of GADD34 (Growth Arrest and DNA Damage- Inducible Protein) and the catalytic subunit of protein phosphatase 1 to the activated TGF-β type I receptor, resulting in receptor dephosphorylation and inactivation and termination of signaling.
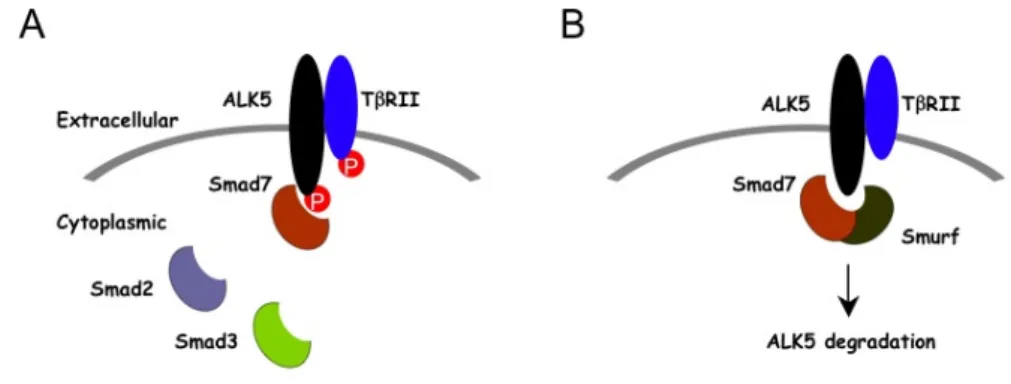
Fig. 2 Smad7-dependent inhibition
Smad7 down-regulates TGF-β signaling (A) by competing with Smad2 and Smad3 for ALK5 binding and (B) by degrading ALK5 through recruiting Smurf-containing E3 ubiquitin ligase complexes (Li et al., 2006a).
1.3.2 TGF-β -associated Diseases by Aberrant Expressions of Smad7
An excessive or deficient expression of Smad7 disrupts the balanced activity of TGF-β.
Abnormal expression of Smad7 is hypothesized to be one of the causes behind TGF-β- associated diseases (Park, 2005). Blocking TGF-β signaling by over-expression of Smad7 helps to maintain the chronic production of pro-inflammatory cytokines that drive the inflammatory process in IBD, and inhibition of Smad7 enables endogenous TGF-β to down regulate this response (Monteleone et al., 2001). On the other hand, the deficient Smad7 expression plays a key role in hyperresponsiveness to TGF-β in fibroblasts and development of the sclerotic skin diseases. The deficiency of Smad7 is presumably due to transcriptional inhibition of Smad7 gene or excessive degradation of Smad7 protein (Dong et al., 2002).
Aberrant expression of Smad7 is also observed in certain cancers. Recent study demonstrates that Smad7 plays an important role in the development of gastric carcinoma and that over-expression of Smad7 may be a significant independent prognostic indicator for clinical outcome in patients with gastric carcinoma (Kim et al., 2004). Smad7 overexpression is associated with poor outcome in gastric carcinomas, indicating that Smad7 expression may present one of the novel mechanisms for TGF-β resistance in human gastric carcinoma.
Increased expression of Smad6 and Smad7 has been described in human pancreatic cancers (Kleeff et al., 1999;), but the mechanisms underlying these changes in Smad7 expression still remains unresolved.
1.3.3 TGF-β and B Lymphocytes
It is known that TGF-β induces apoptosis in immature B cells and resting B cells (Lomo et al., 1995). TGF-β gives rise to NF-κB inhibitor IkBα and inhibits NF-κB activation (Arsura et al., 1996), which could lead to up-regulation of the BH3-only protein Bim, a proapoptotic member of the Bcl-2 family (Wildey et al., 2003). TGF-β can also mediate apoptosis by down-regulating c-myc and inducing the expression of Id3 (inhibitor of DNA binding 3) (Kee et al., 2001). Interestingly, both c-myc and Id3 regulate B cell proliferation.
Therefore, the anti-proliferation pathway and the apoptotic pathway of TGF-β may overlap significantly. This is evidenced by the fact that TGF-β induced apoptosis is associated with cell cycle blockade at G1/S because TGF-β represses cyclin A expression and inactivates cyclin-dependent kinase 2 (cdk2), possibly via the up-regulation of the cyclin-dependent kinase inhibitor p27.
Other signaling pathways such as CD40 also modulate TGF-β regulation of B cell proliferation. Engagement of CD40 can induce Smad7 expression and protects B cells from TGF-β-induced growth inhibition (Patil et al., 2000).
TGF-β promotes switching to IgA and IgG2b in mouse B cells in vitro (Kim and Kagnoff, 1990; McIntyre et al., 1993). In contrast, mice with a blockade of TGF-β signaling in B cells showed that TGF-β signaling is dispensable for IgG2b production. In these mice, serum IgA was absent whereas inactivation of TGF-β signaling in B cells results in elevation of other serum Ig isotypes (Cazac and Roes, 2000). These in vivo studies reveal a general inhibitory function for TGF-β on antibody production with the exception of IgA (Fig.3).
Fig. 3 TGF-β regulation of B cell responses.
TGF-β inhibits B cell proliferation through induction of Id3, p27, and p21 and inhibition of c-myc. TGF-β promotes class switching to IgA through Smad3/4 and CBFα3-mediated transactivation of germline α-promoter.
TGF-β also induces apoptosis in immature and resting B cells through induction of Id3 and Bim, and inhibition of NF-κB and c-myc (Li et al., 2006a).
1.3.4 Aim of the Project
TGF-β signaling is involved in the proliferation, differentiation, and survival of B- lymphocytes. In the mouse model, the absence of TGF-βRII in B cells leads to a reduced life span of conventional B cells, expansion of peritoneal B-1 cells, and B cell hyperplasia in Peyer's patches, elevated serum immunoglobulin, and a virtually complete serum IgA deficiency. Therefore, it is interesting to evaluate the physiological role of Smad7, the TGF- β signal inhibitor, in B cells proliferation, class switch, and survival and figure out the Smad7-regulated signaling pathway of TGF-β receptor in the B cells. To disrupt the Smad7 selectively in B cells, Smad7flox mice were crossed to CD19-Cre mice, which induce efficient B lineage-specific deletion of LoxP-flanked target sequences. Using these mice, we analyzed the role of Smad7 in B cell activation and homeostasis.
1.4 NF-кB inducing kinase (NIK)
1.4.1 The NF-кB Family Members and Their Regulation
In mammals, NF-кB is composed of homo- or heterodimers of five proteins belonging to the Rel family, which are RelA, RelB, c-Rel and NF-кB1 (p105/p50) as well as NF-кB2 (p100/p52). (Li and Verma, 2002, Ghosh et al., 1998) These Rel proteins form different NF- кB homo- and heterodimers, whose activation depends on two major NF-кB activation pathways: the canonical and the non-canonical pathway.
The canonical NF-кB activation pathway is the predominant pathway occurring in most cells. Dimer combinations of RelA, c-Rel and p50, which are kept inactive in the cytoplasm by their specific inhibitors, the IкB proteins (Ghosh and Karin, 2002), are activated by the canonical pathway. This pathway is essential for immune responses, inflammation and promoting cell survival.
The non-canonical pathway affects NF-кB2/p100, which preferentially dimerizes with RelB in the cytoplasm (Solan et al., 2002). This pathway is triggered by certain members of the tumor necrosis factor (TNF) cytokine family (Senftleben et al., 2001). Stimulation of a subset of receptors belonging to the TNFR super-family (such as BAFF-R, CD40, RANK, LTαR and LTßR) leads to the recruitment of TRAF proteins like TRAF2, TRAF3 and TRAF6. This activates the NF-кB inducing kinase (NIK) through a currently unknown
mechanism. NIK then selectively phosphorylates and activates the IKKα catalytic subunit.
Activated IKKα homodimers in turn phosphorylates the NF-кB precursor p100. p100 is subsequently polyubiquitinated and then processed to the mature subunit p52 by the proteasome (Massoumi et al., 2006). p52 and its binding partner RelB then enter the nucleus to turn on the transcription of target genes (Sun and Chen, 2004)(Fig.4).
This pathway is important for secondary lymphoid organogenesis, maturation of B cells, adaptive humoral immunity and optimal promotion of cell survival (Zarnegar et al., 2004).
Fig. 4: Schematic overview of the Non-Canonical Pathway of NF-кB activation
Proteins are depicted by name and by oval symbols.
Receptors are symbolized by boxed names. Arrows indicate activation processes. P stands for phospho- groups, and Ub for ubiquitin.
1.4.2 NIK Deficient Model
Alymphoplasia (aly) mice, which carry a spontaneous point mutation in the NIK gene, are characterized by the systemic absence of lymph nodes and Peyer’s patches, disorganized splenic and thymic architectures, and immunodeficiency (Miyawaki et al., 1994). Another unique feature of aly/aly mice is that they exhibit increased numbers of B1 B cells in the peritoneal cavity compared to aly/+ mice. Transfer experiments of peritoneal lymphocytes from aly/aly mice into RAG-2 mice revealed that B and T cells fail to migrate to lymphoid tissues, particularly to the gut-associated lymphatic tissue system (Fagarasan et al., 2000). The migration defect of aly/aly lymphocytes was due to impaired signal transduction downstream of the receptors, indicating that NIK is involved in the chemokine-signaling pathway.
NIKknockout mice (NIK–/–) displayed similar abnormalities in both lymphoid tissue development and antibody responses that observed in aly mice (Yin et al., 2001). In addition, a phenotype of immuno-suppression mediated by CD25–Foxp3– memory CD4+ cells were observed in the mice deficient for NIK (Ishimaru et al., 2006). Biochemical studies of those
cells indicated an involvement of a cell-intrinsic mechanism in which NF-κB2 (p100) limits nuclear translocation of NF-κB1–RelA and thereby functions as a regulatory ‘brake’ for the activation of naive T cells. Moreover, analyses of NIK–/– mice showed that although NIK is essential for B and T cell activation, it is dispensable for activation of dendritic cells (DCs) (Garceau et al., 2000).
1.4.3 Aim of the Project
Deficiency of NIK (aly/aly) causes defects in the formation of secondary lymphoid organs in embryonic development in mice (Miyawaki et al., 1994) but the role of NIK in postnatal maturation of lymph nodes and Peyer’s patches remains unclear. Further, NIK knockout mice exhibit various phenotypes in different lineages. Due to the complex interaction between lineages such as B and T cells, the importance of NIK in cellular lineage and development stage are not known. To identify the physiological functions of NIK, we disrupted the NIK locus using conditional gene targeting, an established genetic method to investigate the gene function solely in the specific tissues and/or cell types.
1.5 BAC Strategy for Gene Targeting
1.5.1 BAC (bacterial artificial chromosome)
BACs can be used to clone DNA fragments of up to 300kb. The vectors are based on the naturally occurring large E. coli plasmid called the F-factor. This plasmid contains two genes, parA and parB, which maintain the copy number of the F-factor at 1-2 per cell. Recombinant BACs containing large DNA fragments are produced as in standard plasmid vector cloning.
BACs are introduced into E. coli cells by electroporation. Large DNA fragments cloned into BACs have been found to be stable through hundreds of generations (Shizuya et al., 1992).
Recently, huge BAC libraries have been generated and were used for shotgun sequencing of several genomes. BAC stocks are available from the Children’s Hospital of Oakland Research Institute (CHORI).
1.5.2 RED/ET Cloning
All targeting techniques described so far require the production of complicated targeting constructs. This is often a limitation, since the availability of unique restriction sites on targeting vectors and genomic DNA is restricted and also the capacity with respect to insert size of the usual cloning vectors is limited. Development of efficient phage-based homologous recombination systems in the past five years has made it possible to engineer large segments of genomic DNA very easily (Murphy, 1998; Zhang et al., 1998, Yu et al.
2000, Muyrers et al, 1999). With this new technique it is possible to engineer bacterial artificial chromosomes (BACs) in a way that they can be used as targeting vectors later on.
Red/ET recombination relies on homologous recombination in vivo in E.coli. It allows a wide range of modifications of DNA molecules at any chosen position. Homologous recombination allows the exchange of genetic information between two DNA molecules in a precise, specific and faithful manner (Copeland et al., 2001; Liu et al., 2003). These qualities are optimal for engineering a DNA molecule regardless of its size. Therefore Red/ET cloning is a valuable tool to generate targeting vectors with very long stretches of homology to the target gene. (Fig.5)
Fig.5 Applications of Red/ET (genebridges)
Red/ET allows every type of DNA engineering possible regardless of target size or type of modification.
2 MATERIALS AND METHODS
2.1 Chemicals and Biological Material
Chemicals were purchased from Sigma-Aldrich (Steinheim), Fluka Chemie (Deisenhofen), Merck (Darmstadt) or AppliChem (Darmstadt) unless stated otherwise.
Solutions were prepared with double distilled water (ddH2O). Bacterial media were autoclaved prior to use.
Sterility of solutions and chemicals used in cell culture was maintained by working under a sterile hood (Heraeus, Germany).
Name of chemical Supplier
β-Mercaptoethanol (β-ME) Fluka Chemie GmbH, Switzerland
Acetone Merck, Darmstadt
Agar Gibco Life Technologies GmbH, Karlsruhe
Agarose, electrophoresis grade AppliChem, Darmstadt
Ampicillin Sigma-Aldrich, Steinheim
L-Arabinose Sigma-Aldrich, Steinheim
Bovine serum albumin (BSA) Sigma-Aldrich, Steinheim
Calcium chloride Sigma-Aldrich, Steinheim
Chloroform Merck, Darmstadt
Citric acid Fluka Chemie GmbH, Switzerland
2’-Deoxyguanosine Monohydrate AppliChem, Darmstadt Diethylpyrocarbonate (DEPC) AppliChem, Darmstadt
Dextran sulfate AppliChem, Darmstadt
Dextrose Merck, Darmstadt
Dithiothreitol (DTT) Boehringer Mannheim GmbH, Mannheim Dimethylsulfoxide (DMSO) Merck, Darmstadt
dNTPs Pharmacia Biotech, USA
Ethylendiamine tetraacetate (EDTA) Fluka Chemie GmbH, Switzerland
Ethanol, abs. AppliChem, Darmstadt
Ethidium bromide Sigma-Aldrich, Steinheim
Fetal calf serum (FCS) Boehringer Mannheim GmbH, Mannheim
Ficoll 400 Amersham Pharmacia, Freiburg
Glacial acetic acid Fluka Chemie GmbH, Switzerland Hydrochloric acid (37 %) Merck, Darmstadt
Isopropanol AppliChem, Darmstadt
Magnesium chloride Sigma-Aldrich, Steinheim
Magnesium chloride (for PCR) Gibco Life Technologies GmbH, Karlsruhe
Mineral oil Sigma-Aldrich, Steinheim
Orange G Chroma Gesellschaft Schmidt & Co, Stuttgart
Phenol Sigma-Aldrich, Steinheim
Potassium acetate Fluka Chemie GmbH, Switzerland
Potassium chloride Merck, Darmstadt
Proteinase K Roche, Switzerland
Salmon sperm DNA Biomol, Hamburg
Sodium azide Fluka Chemie GmbH, Switzerland
Sodium chloride AppliChem, Darmstadt
Sodium citrate Fluka Chemie GmbH, Switzerland
Sodium dodecyl sulfate AppliChem, Darmstadt
Sodium hydrogencarbonate Fluka Chemie GmbH, Switzerland
Sodium hydroxide Fluka Chemie GmbH, Switzerland
Tris base Fluka Chemie GmbH, Switzerland
Tris/ HCl AppliChem, Darmstadt
Table 1: Chemicals
2.2 Molecular biology
Standard methods of molecular biology were performed – if not otherwise stated- according to protocols described in Sambrook et al. (1989).
2.2.1 Competent Cells and Isolation of Plasmid DNA
Competent Escherichia coli DH5α or M1 or Topo 10 cells were prepared according to the protocol of Inoue et al. (Inoue et al., 1990) and used in heat shock transformations of plasmid DNA. DNA ligation was performed with the NEB DNA ligase according to the manufacturer’s instructions. Plasmid DNA was isolated from transformed Escherichia coli bacteria with an alkaline lysis method (QIAGEN, Hilden, Germany). The procedure was performed according to the protocol of (Zhou et al., 1990). Mini or Maxi Plasmid DNA of higher purity was obtained with QIAGEN columns (QIAGEN, Hilden, Germany) following the supplier’s instruction.
2.2.2 Preparation of BAC DNA
Preparation of BAC DNA is very similar to preparation of plasmid DNA. Some precautions must be taken in order to maintain the integrity of the BAC. Vortexing or shaking should be left out, because this may lead to shearing of the BAC.
2.2.2.1 Mini Preparation of BAC DNA
BAC DNA was prepared from a 5 ml overnight culture. Four ml of this culture were used for every lysis. Cells were centrifuged at 13000 rpm for 3 min. The pellet was dissolved in 200 µl of buffer P1. 220 µl P2 were added followed by gentle shaking of the tubes. The solution was incubated for a maximum of 5 min at room temperature. Subsequently, 220 µl of P3 were added. After 5 min incubation the solution was centrifuged for 10 min at 13000 rpm, the cleared supernatant was transferred into a fresh 1.5 ml tube. BAC DNA was precipitated with 550 µl of isopropanol and washed with 70 % (v/v) ethanol. The DNA pellet was directly resuspended in a restriction digest mix to avoid any shearing of the BAC DNA.
2.2.2.2 Maxi Preparation of BAC DNA
BAC DNA was prepared from a 200 ml overnight grown culture. Cells were pelleted at 4700 rpm for 15 min. DNA extraction was performed using the Nucleobond AX 500 kit (Macherey + Nagel, Düren) following the manufacturer’s instruction. After clearance of genomic DNA and cell debris by centrifugation, the protocol was modified. The cleared lysate was filtered through a sterile nylon mesh. Afterwards the DNA was precipitated with an equal
amount of isopropanol (centrifugation: 4700 rpm, 25 min, 4°C). The DNA was washed twice with 5 ml of 70 % (v/v) ethanol (centrifugation: 4700 rpm, 10 min, room temperature) and resuspended in 200 µl of TE buffer. Prior to use in transfection of ES cells, the DNA was purified following the phenol/chloroform extraction protocol. To prevent shearing of the DNA, the solution was not vortexed, but gently shaken.
2.2.3 Preparation of Genomic DNA
Genomic DNA was prepared using a simplified protocol that allows the turnover of many samples at the same time (Laird et al., 1991). DNA from either mouse-tail biopsies or ES cells was extracted.
2.2.3.1 DNA Extraction from Mouse Tail Biopsies
Cells were lysed over night at 56°C in lysis buffer (10 mM Tris-HCl, pH 8; 10 mM EDTA; 150 mM NaCl; 0.2% (w/v) SDS; 400 mg/ml proteinase K). Subsequently, DNA was precipitated from the solution by the addition of an equal volume of isopropanol. DNA was pelleted by centrifugation, washed in 70% (v/v) EtOH and resuspended in TE-buffer (10 mM Tris-HCl, pH 8; 1 mM EDTA).
2.2.3.2 DNA Extraction from ES Cells (96-well micro titer plates)
After washing ES cells twice with 100 µl PBS, 50 µl of ES cell lysis buffer was added to each well. The plates were transferred into a pre-warmed humidified box in which digestion of cellular proteins proceeded overnight at 56°C. After lysis and denaturation, samples were cooled to room temperature for 1 h. ES cell derived genomic DNA was precipitated with absolute ethanol for an additional hour at room temperature. DNA strands were visible under the microscope. To remove the ethanol the plates were inverted and the wells carefully drained on paper towels. DNA usually remained attached to the plastic surface. Every well was washed three times with 70 % (v/v) ethanol. DNA was air-dried and ready for further processing, e.g. restriction digests.
ES cell lysis buffer 10 mM Tri/HCl pH 7.5 10 mM EDTA
0.5 % (w/v) sarcosyl (sodium lauryl sarcosinate) 10 mM NaCl
0.4 mg/ml proteinase K (added prior to lysis)
2.2.4 Preparation of RNA
2.2.4.1 RNA Extraction by using TRIzol Reagent
Cells were washed off the culture plate inserts with 500 µl of PBS. Cells were collected by centrifugation (3500 rpm, 5 min) and resuspended in 1 ml of TRIzol Reagent (GibcoBRL, USA). RNA was either prepared directly afterwards or the cells were stored at -80°C for storage. All the following steps were performed at a separate workbench, using filtered tips, a separate set of pipettes, and keeping the tubes on ice at all times. The TRIzol Reagent, a monophasic solution of phenol and guanidine isothiocyanate, is an improvement of the single- step RNA isolation method developed by Chomczynski and Sacchi (Chomczynski, P., and Sacchi, N. 1987). Cells were lysed by pipetting up and down several times. The homogenized cells were incubated at room temperature for 5 min to allow the complete dissociation of nucleoprotein complexes. Chloroform (0.2 ml) was added to each tube and the tubes were shaken vigorously for 15 sec and then incubated for 3 min at room temperature. Tubes were centrifuged at 13000 rpm for 15 min at 4°C. The mixture separates into an upper aqueous phase containing the RNA, an interphase with proteins, and a lower phenol-chloroform phase.
The upper phase was transferred into a fresh tube and the RNA was precipitated with 0.5 ml isopropanol. The samples were incubated for 10 min at room temperature and the RNA was collected by centrifugation (13000 rpm, 10 min, 4°C). The supernatant was removed carefully and the RNA was washed with 1 ml 70 % (v/v) ethanol prepared with DEPC treated water (6000 rpm, 5 min, 4°C). Diethylpyrocarbonate (DEPC; AppliChem, Darmstadt) inactivates RNases. The ethanol was completely removed and the RNA was dried for a maximum of 10 min at room temperature. Afterwards the RNA was dissolved in 30 µl of DEPC-water for 10 min at 55°C. It was stored at -20°C for later preparation of cDNA.
2.2.5 cDNA Synthesis
8 µl of total RNA were mixed with 2 µl of 10 mM dNTP mix, 2 µl of oligo (dT12-18) (0.5 µg/µl) and 18 µl of DEPC treated water. The mixture was incubated at 65°C for 5 min. After a 2 min incubation on ice, 4 µl of 10 x RT buffer, 8 µl of 25 mM MgCl2, and 4 µl of 0.1 M DTT were added and incubated for 2 min at 42°C. At this point, 1 µl of Superscript II reverse transcriptase was added. All reagents were purchased from Invitrogen, USA. cDNA synthesis was performed at 42°C for 50 min. The reverse transcriptase was inactivated at 70°C for 15 min. The cDNA was stored at -20°C for further analysis.
2.2.6 Agarose Gel Electrophoresis and DNA Gel Extraction
Separation of DNA fragments by size was achieved by electrophoresis in agarose gels (0.8% - 2% (w/v); 1x TAE (Sambrook, 1989); 0.5 mg/ml ethidium bromide). DNA fragments were recovered from agarose gel slices with either the QIAEX II or the QIAquick Gel Extraction Kit (QIAGEN, Hilden, Germany) following the manufacturer’s instructions.
2.2.7 DNA Sequencing
DNA was sequenced using the 'Big Dye termination Cycle Sequencing Kit' (Applied Biosystems, Foster City, USA), which is a PCR-based modification of the original Sanger protocol (Sanger et al., 1977). The fluorescently labeled DNA fragments were separated and analysed with the ABI373A and ABI377 systems (Applied Biosystems, Foster City, USA).
2.2.8 Polymerase Chain Reaction (PCR)
The polymerase chain reaction is a rapid procedure for in vitro enzymatic amplification of a specific segment of DNA (Saiki et al., 1985; Saiki et al., 1988). The first step of PCR simply entails mixing template DNA, two appropriate oligonucleotide primers (18-75 nucleotides), Taq or another thermostabile polymerases, deoxyribonucleoside triphosphates (dNTPs), and a buffer. Once assembled, the mixture is cycled many times (usually 25-40) through temperatures that permit denaturation (94-95°C), annealing (54-61°C) and DNA synthesis (68-72°C) to exponentially amplify a product of specific size and sequence (Mullis et al., 1986; Mullis, 1990). The Taq polymerase synthesizes the complementary strand starting from the 3’ end of the primer. PCR reactions were performed with the PTC-200 PCR cycler (MJ Research) or Biometra Trio Thermoblock (Biometra).
To amplify cDNA fragments for cloning or sequencing, the High Fidelity Master Kit with proofreading activity was used. (Roche, Mannheim, Germany)
2.2.9 Southern Blot
Southern blotting is the transfer of DNA fragments from an electrophoresis gel to a membrane. The transfer results in immobilization of the DNA fragments, so the membrane carries a semi-permanent reproduction of the banding pattern of the gel. After immobilization, the DNA can be hybridized with radioactively labeled probes and visualized by autoradiography (Southern, 1975).
Genomic DNA was digested with restriction endonucleases, and the resulting fragments were separated according to size by agarose gel electrophoresis on a 0.7 % (w/v) agarose gel.
The DNA was denatured in situ and transferred onto a positively charged nylon membrane.
Blotted DNA was fixed by incubation at 80°C for 20 min. The DNA was hybridized to a 32P- radioactively labeled DNA probe specific for the desired genomic region. Autoradiography was used to locate the positions of bands to which the probe hybridized.
2.2.9.1 Preparation and Transfer of the DNA Samples
Southern blot analysis was used to identify the targeted allele in the genome of ES cells, for typing of genetically modified mice and to identify targeted BACs.
The digested DNA and a DNA size marker were separated on a 0.7 % agarose gel overnight (40V, 16 h). The gel was photographed under UV light with a ruler aligned to the 1 kb DNA size marker and its bands were marked with a yellow tip. Afterwards the gel was gently shaken in 0.25 M HCl for 15-20 min that leads to partial depurination of the DNA, which in turn leads to strand cleavage. The HCl was exchanged with a 0.4 M NaOH solution which functions as a denaturation agent, to obtain single-stranded DNA. The DNA is ready to be transferred onto a positively charged nylon membrane (Hybond N+, Amersham Biosciences, UK). The DNA was transferred using downward capillary transfer with an alkaline transfer buffer. Transfer was performed for 4-16 h.
After completion of the transfer, the membrane was marked with a pencil corresponding to the previously marked size marker. Afterwards the membrane was baked for 20 min at 80°C to immobilize the DNA on the membrane.
Depurination buffer Denaturation buffer Transfer buffer
0.25 M HCl 0.4 M NaOH 0.4 M NaOH
0.6 M NaCl
2.2.9.2 Hybridization
After baking of the membrane, it was moistenend with 2 x SSC and thereafter incubated in a rotating oven for at least 2 h at 65°C with prehybridization solution. In the meantime, the DNA probe was labeled with 32P.
30-100 ng of DNA (probe) were mixed with 2 µl of random primers (TaKaRa labeling kit) and filled up with water to a final volume of 10 µl. The solution was boiled for 5 min, to get single stranded DNA. After 5 min incubation on ice, 2.5 µl of Bca buffer, 2.5 µl of dNTPs, 6.5 µl of H2O, 1.0 µl of Bca BEST polymerase (all components part of the TaKaRa labeling kit) and 25 µCi 32P-CTP were added. The mix was incubated at 55°C for 1 h. The labeling reaction was stopped by adding 100 µl of H2O. The labelled probe was purified from
non-incorporated nucleotides on a Micro Spin S 200 HR column (Amersham Bioscience, UK). The purified probe was boiled for 5 min, incubated on ice for 3 min and finally added to the prehybridization solution. Hybridization was performed by rotating the membrane in the solution overnight at 65°C. To avoid background labeling, the membrane was washed the next day with 2 x SSC/ 0.1 % SDS and 1 x SSC/ 0.1 % SDS until the counts decreased to 40- 100 cpm. Afterwards, the membrane was sealed in a plastic bag. The blot was analyzed by phosphoimaging. The sizes of the bands were estimated using their electrophoretic mobility relative to the previously photographed gel or per overlay with the marked bands of the size ladder on the blot.
Prehybridization solution 20 x SSC
1 M NaCl 3 M NaCl
50 mM Tris pH 7.5 300 mM sodium citrate
10 % (w/v) dextrane sulfate adjust to pH 7.0 w/ NaOH 1 % (w/v) SDS
250 µg/ml salmon sperm DNA (sonicated)
2.2.10 Red/ET Cloning
The Plasmid pSC101-BAD-gbaA-tetra (available from GeneBridges, Dresden) carries the λ phage redγβα operon expressed under the control of the arabinose-inducible pBAD promoter (Guzman et al. 1995) and confers tetracycline resistance. The pBAD promoter is both positively and negatively regulated by the product of the araC gene (Schleif, 1992).
AraC is a transcriptional regulator that forms a complex with L-arabinose. Arabinose binds to AraC and allows transcription to begin. In the absence of arabinose transcription is blocked by the AraC dimer. To minimize toxic side effects of the red γ gene, expression is tightly controlled. The plasmid is a derivative of a thermo sensitive pSC101 replicon which is a low copy number plasmid depending on the oriR101. The RepA protein encoded by plasmid pSC101 is required for plasmid DNA replication and the partitioning of plasmids to daughter cells at division (Miller et al., 1995). Since a temperature sensitive (Ts) RepA protein is expressed cells have to be cultured at 30°C, pSC101 derivatives are easily curable at 37°C to 43°C. The temperature-sensitivity of the RepA proteins leads to a rapid loss of the plasmid in the absence of continued selection pressure.
We used the system of GeneBridges, Dresden.
2.2.10.1 Transformation of pSC101-BAD-gbaA into the E. coli Strain Carrying the BAC Ten colonies carrying the BAC were picked and inoculated in an Eppendorf tube containing 1.0 ml LB medium supplemented with 15 µg/ml chloramphenicol. The lid was punctured for ventilation. The tubes were cultured overnight at 37°C shaking at 300 rpm. The next day, a fresh Eppendorf tube containing 1.4 ml LB medium conditioned with chloramphenicol was inoculated with 30 µl of the overnight culture. Cells were cultured for three hours at 37°C shaking at 1000 rpm. All the following steps were performed on ice in a cold room. The cells were centrifuged (11000 rpm, 30 sec, 4°C). The pellet was placed on ice and resuspended in 1 ml ice-cold dH2O. After centrifugation, cells were resuspended and centrifuged a second time. The supernatant was removed leaving 20 to 30 µl in the tube. One µl of pSC101-BAD-gbaA were added to the cell slurry. The mixture was transferred into a chilled electroporation tube (BioRad, 1 mm). Electroporation was performed at 1800 V, 25 µF, 200 Ω with the Eppendorf Electroporator 2510. The electroporated cells were resuspended in 1 ml LB medium and incubated at 30°C for 60-80 min shaking at 1000 rpm.
100 µl of those cells were plated on LB agar plates containing tetracycline (3 µg/ml) and chloramphenicol (15 µg/ml). The plates were incubated at room temperature for at least 24 h.
2.2.10.2 Cloning of a PCR Product with Homology Arms into a BAC by Red/ET
At least ten colonies from the previous transformation were picked and inoculated together in a ventilated tube containing LB medium conditioned with tetracycline and chloramphenicol. Tubes were incubated at 30°C shaking overnight at 300 rpm. The next day, two new tubes containing 1.4 ml fresh medium were inoculated with 30 µl of overnight culture. The tubes were incubated shaking at 30°C at 1100 rpm for 2 hours (OD600 ~ 0.2). 20 µl of 10 % (w/v) L-arabinose were added to one of the tubes to induce the expression of the Red/ET recombination proteins. Cells were incubated at 37°C shaking at 1100 rpm for 40 min (cells should not grow further than OD600 ~ 0.4). The following steps were performed as described above in section 1.2.10.1. Instead of the pSC101-BAD-gbaA, 1 µl of the PCR product with homology arms was added to the cell slurry. After electroporation, the cells were resuspended in 1 ml of LB medium and incubated at 37°C for 70 min. During this period, recombination occurs. 100 µl of the cells were plated on LB agar plates conditioned with 15 µg/ml chloramphenicol and 50 µg/ml kanamycin. The plates were incubated at 37°C overnight. Individual clones were analyzed with PCR and Southern blotting as described before.
2.3 Cell Culture
Cells were kept in incubators at 37°C in a humidified atmosphere (5 % (v/v) H2O) and a constant CO2 concentration of 10 % (v/v). All procedures requiring sterility were carried out under a laminar flow sterile hood (Heraeus). Media and solutions were prepared in sterile bottles, with sterile glass or plastic pipettes and filter-sterilized if necessary.
Material and devices were cleaned with either 70 % (v/v) ethanol or Bacillol (Bode Chemie, Hamburg) prior to use. Gloves were worn at all times. Glass pipettes were flamed additionally to autoclaving prior to use.
The described techniques are modified according to Torres and Kühn (Torres and Kühn, 1997).
2.3.1 Reagents and Media for Cell Culture
Embryonic feeder cell (EF) medium (also used for CV-1 5B cells) 500 ml DMEM w/ Glutamax (Gibco/BRL)
60 ml EF FCS (Gibco/BRL)
6 ml 100 x sodium pyruvate (Gibco/BRL)
Embryonic stem cell (ES) medium 500 ml DMEM (Gibco/BRL)
75 ml ES FCS (Gibco/BRL)
6 ml 100 x sodium pyruvate (Gibco/BRL) 6 ml 100 x L-glutamine (Gibco/BRL)
6 ml 100 x non-essential amino acids (Gibco/BRL) 0.6 ml Leukemia inhibitory factor (LIF)
0.6 ml 0.1 M β-mercaptoethanol (Sigma)
PBS (phosphate buffered saline)
Dulbecco’s phosphate buffered saline w/o calcium and magnesium (PAA laboratories)
1 x trypsin/EDTA
10 ml 10 x trypsin/EDTA (Gibco/BRL) 90 ml PBS
Mitomycin C (MMC)
2 mg MMC (Sigma) were dissolved in 2 ml EF medium; filter sterilized and diluted 1:100 in 200 ml EF medium (final concentration: 10 µg/ml). 7 ml aliquots were stored at -20°C.
0.1 % gelatine (w/v)
10 ml of a 2 % gelatine stock solution (Sigma) were heated to 37°C and diluted 1:20 in 190 ml of PBS.
Transfection buffer
RPMI w/o phenol red (Gibco/BRL)
Geneticin (G418 sulfate, Gibco/BRL)
Five g G418 sulfate were dissolved in 28 ml of PBS for a 600 x stock solution. 1 ml of this stock was added to one bottle of ES medium, resulting in a concentration of 300 µg/ml. Since the G418 batch used has a relative activity of 71 %, the final effective working concentration was reduced to 225µg/ml.
Ganciclovir (Ganc, Hoffmann-La Roche, Switzerland)
Ganc was purchased as Cymeven i.v. 4.3 mg of Ganc were dissolved in 80 µl of H2O. 10 µl of this stock were diluted 1:100 in ES medium, filter sterilized and diluted 1:1000 in ES medium, resulting in a final concentration of 2 µM.
2.3.2 Equipment
2.3.2.1 Dishes and Plastic Ware
15 cm plates TPP, Switzerland
10 cm plates Greiner Bio-One, Germany
6 well plates Becton-Dickinson, USA
12 well plates Becton-Dickinson, USA
24 well plates Corning Incorporated, USA
48 well plates Corning Incorporated, USA
96 well plates (round and flat bottom) Costar, USA
250 ml tissue culture flask Greiner Bio-One, Germany Plastic pipettes (1, 5, 10 and 25 ml) Corning Incorporated, USA
Pipette tips Tip-One Starlab, Finnland