Role of myeloid cells specific PDK-1 in inflammation and obesity induced insulin resistance
Inaugural-Dissertation zur
Erlangung des Doktorgrades
der Mathematisch-Naturwissenschaftlichen Fakultät der Universität zu Köln
Vorgelegt von Bhagirath Chaurasia
aus New Delhi, India
2009
Berichterstatter: Prof. Jens C. Brüning Prof. Mats Paulsson
Tag der mündlichen Prüfung: 18.05.2009
Table of Content
-1-
Table of Contents
1 Introduction ... - 7 -
1.1 Obesity ... - 7 -
1.2 Diabetes mellitus ... - 8 -
1.3 Insulin and Insulin signaling ... - 9 -
1.4 Nutrient sensing and chronic inflammation under obesity ... - 12 -
1.5 Inflammatory pathways and insulin resistance ... - 14 -
1.5.1 Cytokine mediated inflammation... - 15 -
1.5.2 Lipid mediated inflammation ... - 15 -
1.5.3 Endoplasmic stress mediated inflammation ... - 16 -
1.6 Source of inflammation under obesity ... - 18 -
1.7 Role of macrophages in propagating inflammatory signal ... - 18 -
1.8 Macrophages and activation of macrophages ... - 19 -
1.9 TLR4 signaling in macrophages ... - 20 -
1.10 Role of Insulin signaling in macrophages ... - 23 -
1.11 Aim ... - 23 -
2 Materials and Methods ... - 24 -
2.1 Chemicals ... - 24 -
2.2 Molecular biology ... - 25 -
2.2.1 Isolation of genomic DNA ... - 25 -
2.2.2 Quantification of Nucleic Acids ... - 26 -
2.2.3 Polymerase Chain Reaction (PCR) ... - 26 -
2.2.4 RNA Extraction, RT-PCR and Quantitative Realtime PCR ... - 27 -
2.3 Biochemistry ... - 28 -
2.3.1 Protein Extraction from cells ... - 28 -
2.3.2 Protein extraction from tissue ... - 28 -
2.3.3 Nuclear and cytoplasmic protein extraction ... - 29 -
2.3.4 Immunoprecipitation ... - 29 -
2.3.5 IKK Kinase Assay ... - 29 -
Table of Content
- 2 -
2.3.6 Electrophoretic mobility-shift Assay ... - 30 -
2.3.7 Western Blot Analysis ... - 30 -
2.3.8 Enzyme linked Immunosorbent Assay (ELISA) ... - 31 -
2.4 Cell Culture and Tissue Analysis ... - 32 -
2.4.1 Culture of Primary Murine Macrophages ... - 32 -
2.4.2 TUNEL Assay ... - 32 -
2.4.3 Histological Analysis and Immunohistochemistry ... - 32 -
2.4.4 Fluorescence–Activated Cell Sorting (FACS) ... - 33 -
2.4.5 Analysis of AST levels ... - 33 -
2.5 Mouse Handling ... - 33 -
2.5.1 Mouse Experiments ... - 34 -
2.5.2 Mice ... - 34 -
2.5.3 Generation of PDK-1
Δmyelmice ... - 34 -
2.5.4 Body weight and Blood Glucose level ... - 35 -
2.5.5 Glucose and Insulin Tolerance Test ... - 35 -
2.5.6 Isolation of Primary Peritoneal Macrophages ... - 35 -
2.5.7 LPS induced septic Shock ... - 35 -
2.5.8 Hyperinsulinemic-euglycemic Clamp Studies ... - 36 -
2.6 Computer Analysis ... - 37 -
2.6.1 Densitometrical Analysis ... - 37 -
2.6.2 Statistical Methods... - 38 -
3 Results ... - 39 -
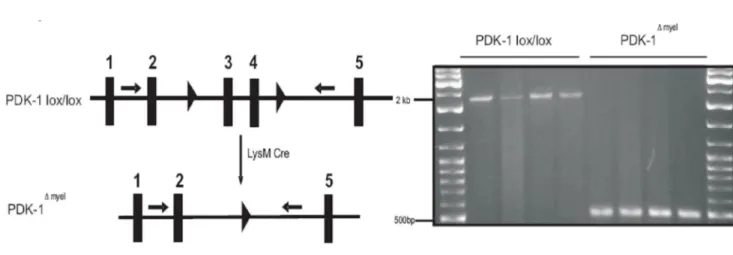
3.1 Generation of myeloid cell specific PDK-1 Knockout mice ... - 39 -
3.2 Effect of myeloid cell restricted PDK-1 deficiency in development and differentiation of myeloid cells ... - 41 -
3.3 Role of myeloid cell restricted PDK-1 deficiency in Inflammation ... - 42 -
3.3.1 Primary macrophages of PDK-1
Δmyelmice exhibit Increased Expression and Secretion of Inflammatory Cytokines upon LPS stimulation ... - 42 -
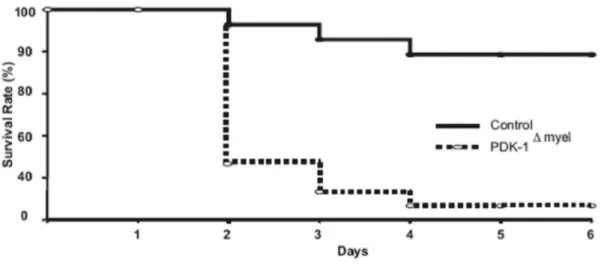
3.3.2 PDK-1
Δmyelmice exhibit increased Susceptibility to Septic Shock ... - 44 -
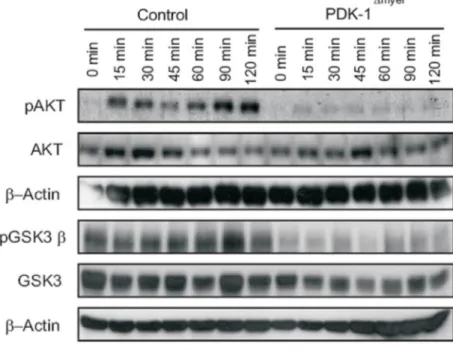
3.3.3 Myeloid cell specific disruption of PDK-1 leads to inactivation of downstream
PI3kinase signaling upon LPS stimulation ... - 47 -
Table of Content
- 3 -
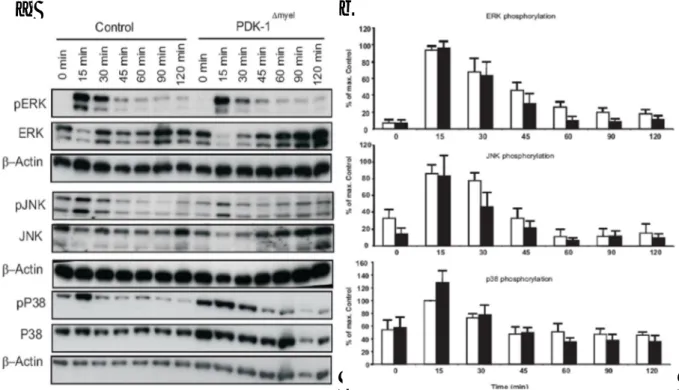
3.3.4 Myeloid restricted PDK-1 deficiency does not alter MAPK activity under LPS
stimulation ... - 48 -
3.3.5 Myeloid cells from PDK-1
Δmyelmice exhibit Increased NF-κB Activation ... - 49 -
3.3.6 Enhanced NF-κB Activation PDK-1
Δmyelis caused by increased activation of IKK complex - 50 - 3.3.7 Myeloid cells from PDK-1
Δmyelmice exhibit unaltered activation of IRAK upon LPS stimulation ... - 51 -
3.3.8 PDK-1 limits the ubiquitination of TRAF6 ... - 51 -
3.4 Role of myeloid cell restricted PDK-1 deficiency diet induced obesity ... - 52 -
3.4.1 PDK-1
Δmyelmice show steady increase in body weight upon High fat diet ... - 52 -
3.4.2 PDK-1
Δmyelmice exhibit unaltered systemic inflammation under diet induced obesity - 55 - 3.4.3 PDK-1
Δmyelmice exhibit impaired glucose homeostasis under diet induced obesity .- 58 - 4 Discussion ... - 64 -
4.1 Myeloid cell specific PDK-1 does not affect development and differentiation of myeloid cells ... - 64 -
4.2 Role of myeloid cell specific PDK-1 in inflammation... - 65 -
4.3 Role of myeloid cell specific PDK-1 in obesity induced insulin resistance ... - 69 -
4.3.1 Role of myeloid cell specific PDK-1 in obesity ... - 69 -
4.3.2 Role of myeloid cell specific PDK-1 in obesity induced inflammation ... - 69 -
4.3.3 Role of myeloid cell specific PDK-1 in glucose homeostasis under diet induced obesity - 70 - 4.4 Conclusion ... - 71 -
4.5 Outlook ... - 71 -
5 Reference ... - 73 -
6 Summary ... - 89 -
7 Zusammenfassung... - 90 -
8 Curriculum Vitae ... - 92 -
9 Acknowledgement ... - 94 -
10 Erklärung ... - 95 -
Abbreviations
-4-
Abbreviations
A Adenosine aa Amino acid Akt Proteinkinase B
Avertin Tribromoethyl alcohol and tert-amyl alcohol β-me β-mercaptoethanol
bp Base pair
C Cytosine
CAP Cbl associated protein
°C Degrees Celsius cpm Counts per minute
Cre Site-specific recombinase Ctrl Control
ddH
2O Double distilled water
DEPC Diethylpyrocarbonate
dNTP Deoxynucleotide-triphosphate
DMSO Dimethylsulfoxide
DNA Desoxyribonucleic acid DTT 1,4-Dithio-DL-threitol
ECL Enhanced chemiluminescence EDTA Ethylene-diaminetetraacetic acid ELISA Enzyme-linked immunosorbent assay ERK Extracellular signal-regulated kinase
EtBr Ethidium Bromide
FOXO Forkhead transcription factor G Guanine
Glut Glucose transporter
Grb Growth factor receptor binding protein
Abbreviations
- 5 -
GSK Glycogen synthase kinase GTT Glucose tolerance test h Hour
HEPES Hydroxy-ethylpiperazine-ethansulfonic acid
i.p. Intraperitoneal
IL Interleukin
IR Insulin receptor
IRS Insulin receptor substrate ITT Insulin tolerance test kDa Kilodalton
loxP Locus of x (crossing) over of P1 MCP-1 Macrophage chemoattractant protein 1 min Minute
mTOR Mammalian target of rapamycin
NaCl Sodium Chloride
NaOH Sodium hydroxide
OD Optical Density
p70S6K p70 S6 kinase
PBS Phosphate buffered saline PCR Polymerase chain reaction
PDK Phosphoinositide-dependent kinase PH Pleckstrin homology
PI3K Phosphatidylinositol-3 kinase
PIP
2Phosphatidylinositol-4,5-biphosphate PIP
3Phosphatidylinositol-3,4,5-triphosphate PKA Proteinkinase A
PKC Proteinkinase C
PTB Phosphotyrosine binding Ras Rat sarcoma
Raf v-raf-leukemia viral oncogene
Abbreviations
- 6 -
RNA Ribonucleic acid Rpm Rounds per minute RT Room temperature sec Second
SDS Sodium dodecyl sulfate SH Src homology
SOS Son of sevenless
SSC Sodium chloride/ sodium citrate buffer TAE Tris-acetic acid-EDTA buffer
Taq Pol Polymerase from Thermus aquaticus TE Tris-EDTA buffer
TNF Tumor necrosis factor
Tris 2-amino-2-(hydroxymethyl-)1,3-propandiole TWEEN Polyoxethylene-sorbitan-monolaureate U Units
v/v Volume per volume WAT White adipose tissue w/v Weight per volume wt Wildtype
5’ Five prime end of DNA sequences
3’ Three prime end of DNA sequences
Introduction
-7-
1 Introduction
1.1 Obesity
Obesity is characterized by abnormal or excessive fat accumulation leading to negative impact on one’s health (Spiegelman and Flier 2001). Obesity is of growing concerns in the western world mainly for its association with a numerous diseases such as, diabetes mellitus type 2, cardiovascular diseases, osteoarthritis and various forms of cancer (Spiegelman and Flier 2001;
Haslam and James 2005). Thus, obesity is an independent factor for the development of cardiovascular diseases (Poirier, Giles et al. 2006). Hence obesity is increasingly being associated with an enhanced risk of morbidity and mortality as well as reduced life expectancy (Poirier, Giles et al. 2006).
With the growing trend in sedentary life style across the globe obesity has started to become a global epidemic, and in the past ten years there has been a tremendous increase in obesity among children and adults living in United States (Flegal, Carroll et al. 1998; Flegal, Carroll et al. 2002;
Engeland, Bjorge et al. 2003; Eckel, York et al. 2004). (10). According to recent reports published by world health organization (WHO) in 2005, approximately 1.6 billion adults were overweight and at least 400 million were obese. Moreover according to WHO projections these numbers are expected to double by the year 2015 (WHO 2005). Moreover the health service use and medical costs associated with obesity and related diseases have risen dramatically among adults in United States and are expected to continue to rise, thus leading to an increase burden on countries health care system (Yang and Hall 2007).
The fundamental cause of obesity and weight gain is an energy imbalance i.e. caused by chronic consumption of energy in excess than that used by the body (Nestle and Jacobson 2000).
Although body weight is best determined by interaction between genetic, environmental and
psychological factors acting through physiological mediators of energy intake and expenditure,
the rising prevalence of obesity is attributed to behavioral and environmental changes resulting
from technological advances (Kopelman 2000). However the combination of an excessive and
energy-dense nutrient intake combined with reduced physical activity is largely accepted as a
cause for the rapid acceleration of obesity in industrialized societies (Hill and Peters 1998).
Introduction
- 8 -
Overweight and obesity are currently classified by body mass index (BMI) which is defined as weight in kilograms (kg) divided by square of individual’s height in meters (m) (kg/m
2). In adults, overweight is defined as a BMI of 25.0 to 29.9 kg/m
2, whereas obesity is defined as a BMI ≥30.0 kg/m
2(Bleich, Cutler et al. 2007). Increasing body fatness is accompanied by profound changes in physiological function. These changes to a certain extent are dependent on the regional distribution of adipose tissue. Adipose tissue in turn secretes leptin (an adipocyte derived cytokine) which acts in the brain, informing the brain, by its suppression that the body is starving, thereby initiating an appetite (Flier 2004). However apart from secreting leptin, adipocytes also secrete other cytokine such as TNFα, IL6, MCP-1 and adiponectin to name a few, which appear to be responsible for the onset of medical problems associated with obesity.
1.2 Diabetes mellitus
Diabetes mellitus is a disease in which the pancreas either does not release insulin or insulin sensitive tissues such as liver, muscle and fat do not apparantely respond to this hormone (Bergman, Ider et al. 1979; Topp, Promislow et al. 2000). The long term effects associated with diabetes include diabetic retinopathy, nephropathy, peripheral neuropathy and development of atherosclerosis (Derouich and Boutayeb 2002).
Diabetes is classified in two forms: type 1 and 2 diabetes mellitus (Rother 2007). Type 1diabetes also called insulin-dependent diabetes mellitus (IDDM) or juvenile-onset diabetes results from the loss of insulin producing pancreatic β cells as a consequence of autoimmune attack (Kloppel, Lohr et al. 1985). Type 1 diabetes account for 5 to 10% of all the cases diagnosed with diabetes (Porksen 2002). Type 2 diabetes also called as non-insulin-dependent diabetes mellitus (NIDDM) is prevalent among adults and largely caused by insulin resistance
(Rother 2007). However, the way insulin resistance triggers β cell failure remains obscure (Kloppel, Lohr et al.
1985). 90-95% of all the diagnosed diabetes cases account for type 2 diabetes.
Due to the large population of diabetic patients in the world and the big health expenses, many
researchers are motivated to study the glucose-insulin endocrine metabolic regulatory system so
that we can better understand how the mechanism functions (Bergman, Finegood et al. 2002;
Introduction
- 9 -
Porksen 2002), hence eventually resulting in providing more effective, efficient and financially reasonable treatments against diabetes.
1.3 Insulin and Insulin signaling
Insulin is a small peptide hormone, with a molecular weight of about 6kd. It is composed of two chains held together by disulphide bonds. The amino acid sequence is highly conserved among vertebrates. Insulin is synthesized in significant quantities only in pancreatic β-cells. The insulin mRNA is translated as a single chain precursor called preproinsulin, and removal of its signal peptide during insertion into the endoplasmic reticulum generates proinsulin (Steiner, Cunningham et al. 1967).
Proinsulin consist of three domains: an amino- terminal B chain, a carboxy- terminal A chain and a connecting peptide in the middle known as the C peptide. Within the endoplasmic reticulum, proinsulin is exposed to several specific endopeptidases, which excise the C-peptide, thereby generating the mature form of insulin (Orci, Ravazzola et al. 1985). Insulin and free peptide are packaged in the golgi into secretory granules which accumulate in the cytoplasm (Davidson, Rhodes et al. 1988). In response to elevated plasma glucose level, insulin is secreted from the cell by exocytosis and diffuses into the capillary blood. The secreted insulin thereon maintains glucose homestasis by either acting on the peripheral tissues, skeletal muscle and adipose tissue to mediate the glucose uptake or by inhibiting release of lipids from the adipose tissue. In addition insulin acts on the liver to inhibit de novo glucose production (gluconeogenesis) (Docherty and Hutton 1983; Davidson and Hutton 1987).
Like receptors for other protein hormones, the receptor for insulin is embedded in the plasma
membrane. The insulin receptor is composed of two α and two β subunits which are linked by a s
disulphide bridges. The alpha chains are entirely extracellular and house insulin binding domain,
while the linked beta chains penetrate through the plasma membrane and bear an intrinsic protein
kinase activity (Saltiel 1996). Receptor occupancy by insulin-induces conformational changes in
the receptor, which is transduced across the membrane, resulting in activation of intracellular β
Introduction
- 10 -
subunit kinases. The insulin receptor kinase then phosphorylates a number of proteins on tyrosine residues, allowing for their interaction with numerous downstream target enzymes, resulting in the amplification and branching of the initial insulin signal (Saltiel 1996).
There are two main limbs that propagate the signal generated through insulin receptor: the
insulin receptor substrates/phosphatidylinositol 3-kinase pathway (IRS/PI3-K) and Ras/ mitogen-
acctivated protein kinase (MAPK) pathway (Fig 1) (Di Guglielmo, Drake et al. 1998; Ogawa,
Matozaki et al. 1998; White 1998). The IRS/PI3-K pathway leads to the generation of
phosphatidylinositol 3-phosphate, and the consequent activation of PI-dependent kinases, such as
the PI-dependent kinases 1 and 2 (PDK-1, PDK-2) and protein kinase C (PKC). Some of these
kinases may be required to activate downstream kinases, such as the serine/threonine kinase
AKT. It has been demonstrated that AKT may directly phosphorylate and inactivate glycogen
synthase kinase 3, thus leading to dephosphorylation and activation of glycogen synthase and
increased glycogen synthesis. Moreover, there is also clear evidence linking AKT to
translocation of glucose transporters. Insulin, through the formation of complexes between the
exchange factor SOS (son of sevenless) and growth factor receptor- binding protein 2 (GRB-2),
can activate the Ras/MAPK pathway. GRB-2 can be activated by IRS or SHC, two direct
substrates of the insulin receptor kinase. Thus IRS/PI3-K pathway plays role in metabolism
whereas Ras/MAPK pathway may play a role in certain tissues to stimulate the long term effects
of insulin on growth and proliferation (Fig 1). In addition the insulin signaling activation leads
to the translocation of Glucose transporters (GLUT) by an additional signaling pathway
engaging adaptor protein with
apleckstrin homology and an Src homology 2 domain (APS),
Casitas B-lineage lymphoma (Cbl) and Cbl associated protein (CAP) which forms a trimeric
complex (Bastard, Maachi et al. 2002). Upon tyrosine phosphorylation of Cbl, it recruits CrKII-
C3G complex to the plasma membrane, thereby leading to the activation of downstream
molecule TC10 which in turn regulate the translocation of GLUT to the plasma membrane
(Trischitta, Brunetti et al. 1989; Chiang, Baumann et al. 2001; Patki, Buxton et al. 2001; Liu,
Kimura et al. 2002; JeBailey, Rudich et al. 2004).
Introduction
- 11 - Fig 1. Intracellular Insulin signaling.
Insulin binding to the insulin receptor results in receptor auto-phosphorylation and its trans-activation leading to the recruitment and subsequent tyrosine phosphorylation of insulin receptor substrates. This enables the binding of SH-2 domain containing proteins, which ultimately leads to the activation of downstream signaling pathways such as the PI3K or the Ras/Raf MAPK signaling pathway.
(Abbreviations: Akt: Proteinkinase B, APS: adapter protein with a pleckstrin homology and an Src homology 2 domain, CAP: cbl-associated protein, SOS: son of sevenless, Raf: v-raf-leukemia viral oncogene, Ras: rat sarcoma, ERK: extracellular signal-regulated kinase, FOXO: Forkhead transcription factor , Glut: glucose transporter , Grb2: growth factor receptor binding protein 2, Gsk3: glycogen synthase kinase 3, IR: insulin receptor, IRS: insulin receptor substrate, mTOR: mammalian target of rapamycin, p70S6K: p70 S6 kinase, PI3K: phosphatidylinositol-3 kinase, PIP: phosphatidylinositol phosphate, Pdk: phosphoinositide-dependent kinase, PKA: Proteinkinase A, PKC: Proteinkinase C,).
1.4 Phosphoionositide dependent kinase-1 (PDK-1)
The phosphoinositide-3 kinase (PI-3K) signaling pathway is one of the key regulatory pathways
activated upon extracellular stimulation of growth factor receptors, such as the insulin receptor
(Wick and Liu 2001). The activation of the phosphoinositide-3 kinase (PI-3K) pathway
Introduction
- 12 -
constitutes one of the most important mechanisms that regulate important cellular functions such as gene expression, cell cycle progression and differentiation (Dygas and Baranska 2001). Apart from this, PI-3K is also known to be critical for numerous insulin specific actions such as glucose uptake, glycogen, lipid and protein synthesis (Wick and Liu 2001).
PI-3K mediates the transfer of phosphate groups to phosphatidylinositol residues located in the plasma membrane. There are several kinases including protein kinase B (PKB/Akt) and protein kinase C (PKC) zeta that are activated by rise in PI-3 phosphate. These kinases, which primarily include members of AGC kinase family, are recognized as key mediators of the PI-3K signal.
Activation of Akt and other PI-3K downstream kinase is mediated by 3’-phosphoinositide dependent kinase 1 (PDK1) (Kikani, Dong et al. 2005). PDK1 has been found to act as the upstream kinase for a number of protein kinases, including p70 ribosomal S6 kinase (S6K), PKC isoforms, serum and glucocorticoid regulated kinase (SGK), p90 ribosomal S6 kinase (RSK), protein kinase C- related kinase 1 and 2 (PRK1/2) and p21-activated kinase 1 (PAK1) (Dygas and Baranska 2001; Wick and Liu 2001; Kikani, Dong et al. 2005).
PDK1 is a 63 kDa protein kinase, consisting of an N-terminal kinase domain and a C-terminal pleckstrin homology (PH) domain. The PH domain of PDK1 bind to the PI-3K products phosphoinositol (3, 4, 5) phosphate (PIP3), and phosphoinositol (3, 4) phosphate (PIP2), which target PDK1 to the plasma membrane where PDK1 phosphorylate the threonine 308 in the primary sequence of thee Akt serine/threonine kinase in the activation loop . Other substrates of PDK1 lacking a PH domain are activated by direct association with PDK1. The role of PDK1 in insulin signalling is as follows: Insulin binding to its receptor stimulates its phosphorylation by tyrosine phosphorylation. Activated receptors then recruit and activate insulin receptor substrates 1/2 (IRS 1/2), leading to the activation of PI-3K and subsequent generation of inositols lipid, PIP3. PIP3 then targets PDK1 and Akt on to plasma membrane where PDK1 activates Akt by phosphorylating the kinase in the activation loop (Kikani, Dong et al. 2005) (Fig. 1).
1.5 Nutrient sensing and chronic inflammation under obesity
Metabolic functions and the immune system are among the basic requirements across the animal
kingdom. Moreover, these two pathways interact with each other at many levels (Hotamisligil
and Erbay 2008). Although required for homeostasis, the interaction between these two can also
Introduction
- 13 -
lead to metabolic dysregulation under conditions of chronic stress (Wellen, Fucho et al. 2007).
The association between inflammation and metabolism is also present at the organ level of higher organisms, as in case of adipose tissue and liver wherein immune cells (macrophages) are found along side with adipocytes and hepatocytes respectively (Chung, Lapoint et al. 2006).
Moreover the cells from either of the systems are closely related and share similar functions, for example they both are capable of being activated by pathogen- associated component and can also secrete cytokines (Hotamisligil 2006).
Functionally either limitation of nutrient can lead to immune suppression resulting in enhanced susceptibility to infection or an excess in nutrient avaliability leads to the development of obesity, which in turn results in hyperactivation of immune system, Thereby increasing risk for the development of inflammatory associated diseases such as diabetes, atherosclerosis and fatty liver diseases in obese people (Chandra 1996; Blackburn 2001).
In presence of an excess of nutrient, the inflammatory potential of the metabolically important tissues is activated, which leads as a source of the inflammatory cytokines and inflammatory factors (Uysal, Wiesbrock et al. 1997; Hotamisligil 2003). This leads to the development of chronic inflammatory state under obesity (excess nutrient) (Shoelson, Lee et al. 2006). And hence, this can lead to insulin resistance when inflammatory pathways interfere with insulin signaling (Hotamisligil, Shargill et al. 1993).
The first molecular link between obesity and inflammation was established more than a decade ago when enhanced expression of tumor necrosis factor alpha (TNFα) in adipose tissue of obese mouse and skeletal muscle of obese patients was demonstrated(Hotamisligil, Arner et al. 1995;
Saghizadeh, Ong et al. 1996; Sethi and Hotamisligil 1999; Shoelson, Lee et al. 2006). Moreover it was shown that TNFα impairs insulin action both in vitro or when administered to mice in vivo (Uysal, Wiesbrock et al. 1997; Vozarova, Weyer et al. 2001). Obesity not only induces a low inflammatory state in different tissues but also leads to increased plasma levels of pro- inflammatory molecules, whereas levels of anti-inflammatory proteins such as adiponectin are decreased (Berg, Combs et al. 2002; Chiellini, Bertacca et al. 2002; Sartipy and Loskutoff 2003;
Xu, Barnes et al. 2003). Obesity is characterized by adipocyte hypertrophy leading to the release
Introduction
- 14 -
of key chemokines such as CCL2 (MCP1) and cytokines such as TNFα, which thereby function to promote macrophage infiltration into adipose tissue. Both of these changes contribute to the secretion of pro-inflammatory adipocytokines including TNFα, IL-6, and IL-1β (Brenner, O'Hara et al. 1989). Altogether it is by now well established that the development of insulin resistance and to the pathogenesis of type 2 diabetes mellitus is closely linked to low-grade inflammatory state (Shoelson, Lee et al. 2006). However in the past decade the list for this possible causes of inflammation during obesity continuously extended and now includes numerous mechanisms mediating the release of acute phase proteins such as circulating free fatty acids (FFA) caused by enhanced adiposity, endoplasmic reticulum (ER) stress due to enhanced metabolic load, and mitochondrial reactive oxygen species (ROS) production due to elevated glucose metabolism (Wellen and Hotamisligil 2005).
1.6 Inflammatory pathways and insulin resistance
Although the link between obesity and inflammation is well established, the underlying mechanism(s) leading to enhanced inflammation are just beginning to emerge. The inhibition of insulin signaling under obesity is largely caused by the activation of two intracellular kinases:
inhibitor of nuclear factor (NF) κB kinases (IKKs) and c-jun N-terminal kinases (JNKs) (Mercurio, Zhu et al. 1997; Taniguchi, Emanuelli et al. 2006). These kinases can phosphorylate IRS molecules at serine residues which prevents the activating tyrosine phosphorylation of IRS.
As such efficient signal transduction from insulin receptor is abrogated (Fig. 2) (Hotamisligil,
Peraldi et al. 1996; Gao, Hwang et al. 2002; Zick 2005). The role of these two kinases in
inducing insulin resistance was further supported by genetic deletion of either the IKKβ subunit
of the IKK complex or JNK, since these mice are protected from diet induced insulin resistance
(Hirosumi, Tuncman et al. 2002; Arkan, Hevener et al. 2005). There are number of factors
contributing to the activation of these two kinases, thereby leading to the activation of
inflammatory pathways under obesity and thereby inducing insulin resistance.
Introduction
- 15 -
1.6.1 Cytokine mediated inflammation
The pro-inflammatory cytokine TNFα is thought to be an important mediator of insulin resistance. As mentioned before, TNFα levels are increased in obesity, both in the serum as well as in tissues. Moreover, TNFα binds to tumor necrosis factor receptor (TNFR) and activates both IKKs and JNKs both implicated in insulin resistance (Mercurio, Zhu et al. 1997; Taniguchi, Emanuelli et al. 2006). Further evidence for the crucial role of TNFa in insulin resistance was provided by genetic ablation of TNF signaling. The deletion of TNFα or its receptor subunits (p55 and p75) was shown to protect from obesity induced insulin resistance in mice (Vozarova, Weyer et al. 2001). TNFα mediated inhibition of insulin signaling has also been reported to occur in obese individuals and that there it contributes to the development of metabolic disorders (Hotamisligil, Peraldi et al. 1996). Apart from TNFα, a variety of other cytokines and chemokines such as IL-6, IL-1β, monocyte chemoatractant protein-1 (MCP-1/CCL2) and C- reactive protein (CRP) have been shown to be unregulated under obesity in humans as well as in mice and have been shown to inhibit insulin action (Wellen and Hotamisligil 2005). The induction of IKK and JNK activation by cytokines activates nuclear factor kappa b (NFκB) and activator protein 1 (AP1) which thereby drive the expression of cytokines leading to feed forward inhibition of insulin signaling (Fig 2).
1.6.2 Lipid mediated inflammation
Elevated free fatty acid (FFA) are also an important modulator of obesity induced inflammation
and participate in the induction of insulin resistance (Boden 1997; Shulman 2000). Two
intracellular kinases, IKK and protein kinase (PKC) are known to be activated in response to
lipid metabolites by two independent mechanisms. Similar to the bacterial cell wall component
lipopolysaccharide (LPS), FFA are capable of binding to toll like receptor 4 (TLR4). This is a
pathogen recognition receptor that activates pro-inflammatory signaling cascades in order to
mount an immune response to infections. One of the main signal transduction pathways activated
by TLR4 is the activation of NF-B by the IKK complex. Because of their cross reactivity with
TLR4, FFA are thought to promote the pro-inflammatory state by inducing cytokines as well as
to induce insulin resistance via TLR4-dependent IKK activation (Fig 2) (Medzhitov 2001; Gao,
Introduction
- 16 -
Wang et al. 2007). Beside LPS, saturated fatty acids such as palmitate are capable of stimulating TLR4 signaling at least in vitro and this effect is mediated by myeloid differentiation factor 88 ( (Myd88) a signal transducer for TLR4 signaling (Lee, Sohn et al. 2001; Lee, Ye et al. 2003; Shi, Kokoeva et al. 2006). Secondly, lipid infusion has been shown to lead to a rise in intracellular lipid metabolite levels namely, diacylglycerol (DAG) and fatty acyl coA, and this has been associated with the PKC activation which also contributes to serine phosphorylation of IRS molecule (Chin, Liu et al. 1994; Griffin, Marcucci et al. 1999; Yu, Chen et al. 2002).
1.6.3 Endoplasmic stress response mediated inflammation
Accumulation of unfolded proteins in the endoplasmic reticulum (ER), known as ER stress also
plays a pivotal role in mediating inflammation under obesity. The ER has an important role in
protein processing and lipid metabolism under normal conditions mediated by an assembly of
chaperones (Hotamisligil and Erbay 2008). However the conditions of obesity, nutrient overload,
hypoxia, or energy depreviation trigger the protective response known as unfolded protein
response (UPR) which assists ER to fold and translocate proteins, decrease protein synthesis,
coordinate stress responses ultimately resulting in cell cycle arrest. In addition to these
protective responses under stress the UPR can also stimulate key inflammatory signals and
apoptosis (Ozcan, Cao et al. 2004). ER stress is linked to inflammation through the activation of
JNK and IKK pathways (Fig 2) (Urano, Wang et al. 2000; Ozcan, Cao et al. 2004; Hotamisligil
and Erbay 2008). The relevance of this axis has been shown recently using deletion of X-box
binding protein (XBP-1), a transcription factor that mediates expression of ER chaperones in
mice. The mice lacking XBP-1 exhibit enhanced, ER stress, increased JNK activation and
thereby leading to increased insulin resistance (Iwakoshi, Lee et al. 2003). In contrast induction
of exogenous expression of active XBP-1 was shown to relieve ER stress, reduced JNK activity
and to increase insulin sensitivity (Ozcan, Ozcan et al. 2008).
Introduction
- 17 -
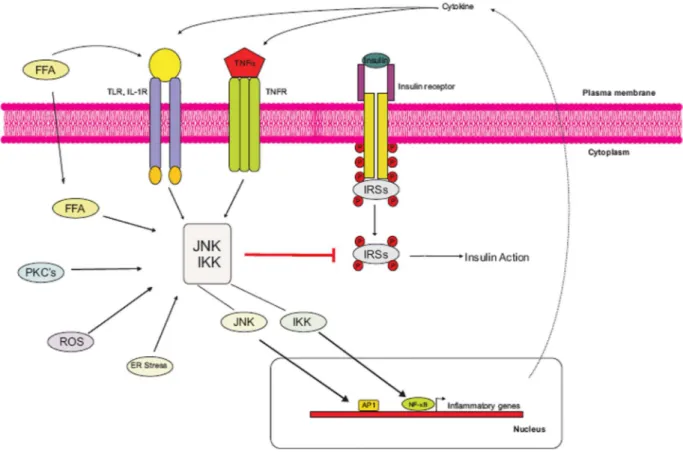
Fig 2. Mechansims for inhibition of insulin signaling by inflammation under obesity
Enhanced adiposity increases circulating inflammatory cytokine and free fatty acid concentration. This leads to activation of cell surface receptors which then induce serine kinases like c-jun N-terminal kinase (JNK), inhibitor of NFkB kinase (IKK) komplex and protein kinase c (PKC) isoforms. These kinases then mediate inhibitory serine (S307) phosphorylation events on insulin receptor substrates (IRS) thereby blocking insulin action. Additionally, transcription factors nuclear factor kB (NFkB), activator protein (AP) 1 and signal transducer and activator of transcription (Stat) activate inflammatory gene expression thereby enhancing production and secretion of inflammatory markers and mediators. Furthermore, endoplasmatic reticulum (ER) stress and intermediates of fatty acid metabolism may activate stress kinases.
(Abbreviations: FFA: free fatty acid, FA: fatty acid, IL1R: interleukin-1 receptor, IR: insulin receptor, IRS:
insulin receptor substrate, LPS: lipopolysaccharide, TLR: toll-like receptor, TNF: tumor necrosis factor, TNFR: TNF receptor)
Introduction
- 18 -
1.7 Source of inflammation under obesity
Many of the inflammatory parameters contributing to the pro-inflammatory state in obesity are believed to originate from adipose tissue. Adipose tissue not only serves as a storage depot for excess calories in form of fat, but also actively secretes fatty acids, hormones, cytokines and chemokines which then act both in an endocrine and a paracrine fashion (Schenk, Saberi et al.
2008). The adipose tissue consists of different cell types comprising of preadipocytes, endothelial cells and immune cells. Weight gain is characterized by massive expansion in adipocyte size and adipose tissue mass. With this massive tissue expansion, there is enhanced secretion of FFA into the circulation, which in turn leads to decreased oxygen supply to adipocytes. This increased level of hypoxia (microhypoxia) activates IKK and JNK signaling cascade which therein enhance the expression of inflammatory cytokines and chemokines (Ye, Gao et al. 2007). Ultimately, activation of these stress pathways will make the adipocytes more prone to cell death. With the secretion of chemokine there is enhanced recruitment of bone marrow derived macrophages to the adipose tissue, where they form ring like structure around the adipocytes to remove dead adipocytes leading to tissue remodeling (Cinti, Mitchell et al.
2005). In addition, these newly recruited macrophages secrete pro-inflammatory cytokines and chemokines thereby further aggravating insulin resistance in the neighbouring adipocytes and recruiting even more macrophages. (Xu, Barnes et al. 2003). This ultimately results in the activation of hypoxia sensitive pathways thereby leading to enhanced proinflammatory tone which further aggravates systemic insulin resistance.
1.8 Role of macrophages in propagating inflammatory signal
The importance of macrophages in propagating inflammatory signals under conditions of obesity was first reported by Weisberg and collegues in 2003, wherein they reported that more than 40%
of the total adipose tissue cell content from obese humans and rodents was comprised of macrophages in contrast to only 10% observed in lean counterparts (Weisberg, McCann et al.
2003). However the precise mechanisms involving macrophage recruitment to adipose tissue are
just beginning to emerge. MCP-1, which is an important chemoattractant for immune cells, or its
receptor CCR2 are believed to be key mediators for this effect, since disruption of MCP-1 or its
Introduction
- 19 -
receptor CCR2 prevented the accumulation of macrophages in adipose tissue of obese mice and improved overall insulin sensitivity (Weisberg, Hunter et al. 2006, Kanda, Tateya et al. 2006).
The JNK and IKK pathways are considered to be of utmost importance in macrophages for propagating inflammatory tone due their central role in driving the expression of inflammatory markers and chemokines. Myeloid specific disruption of IKKβ and JNK1 protects mice against diet-induced insulin resistance. This effect is probably mediated by a reduction of the inflammatory tone and reduced macrophage accumulation in the adipose tissue (Arkan, Hevener et al. 2005; Solinas, Vilcu et al. 2007). In line with these results myeloid cell specific disruption of TNFα in mice also protects against obesity induced insulin resistance. These studies clearly indicated that systemic inflammation mediated by macrophages plays a key role in development of obesity induced insulin resistance.
1.9 Macrophages and activation of macrophages
Macrophages represent a heterogeneous population of ubiquitously distributed mononuclear phagocytes responsible for numerous homeostatic, immunological, and inflammatory processes.
Initial macrophage development takes place in the bone marrow, where progenitors of myeloid cells differentiate into monocytes. These monocytes are transported to various organs throughout the body via the blood circulation to give rise to resident macrophages. Their wide tissue distribution makes these cells well suited to provide an immediate defense against foreign elements prior to leukocyte migration. Because macrophages participate in both specific immunity via antigen presentation and IL-1 production and nonspecific immunity against bacterial, viral, fungal, and neoplastic pathogens, it is not surprising that macrophages display a range of functional and morphological phenotypes.
Although it is now widely accepted that pro-inflammatory macrophages are recruited to adipose tissue upon obesity development, the factors associated with their activation are also emerging.
Enhanced circulating levels of pro-inflammatory cytokines combined with lipid enrich
environment are largely responsible for activating macrophages under obesity. On the other hand
some new emerging data also suggest the role of gut derived LPS to be an additional factor in the
Introduction
- 20 -
macrophage activation. Also increased amount of FFA can directly stimulate toll like receptors (TLR) a family of pattern recognition receptors. It has been shown that disruption of TLR2, TLR4 or both prevent the activation of macrophages by FFA (Lee, Ye et al. 2003; Nguyen, Favelyukis et al. 2007) and thus, these mice are protected against obesity-induced insulin resistance. In addition to FFA and LPS, cytokines derived from expanding adipose tissue, adipose tissue microhypoxia and ER stress can activate inflammatory pathways in these cell types.
1.10 TLR4 signaling in macrophages
The innate immune system comprising of macrophages, neutrophils and dendritic cells represents the first line of defense in the body against the invading pathogens and microorganisms (Fearon and Locksley 1996). These cells recognize a particular conserved motif in the invading pathogens using a group of transmembrane proteins called toll like receptors (TLR). This leads to the activation of TLR signaling resulting in an immediate defensive response by stimulating the production of cytokines and antimicrobial peptides (Akira 2003).
There are 10 members of the TLR so far identified in mammals named TLR 1-10 (Takeda and Akira 2003); however it was TLR4 which was first shown to induce the battery of inflammatory responses (Medzhitov, Preston-Hurlburt et al. 1997).
TLR4 is an essential receptor that recognizes LPS, a component of the cell wall of gram negative
bacteria. TLR4 stimulation leads to the activation of three different intracellular signaling
cascades namely NFκB signaling, mitogen activated protein kinase (MAPK) and PI3K kinase
signaling. LPS binding to TLR4, CD14 and Md2 on the cell surface leads to the recruitment of
Myd88 through its binding to the Toll/IL-1 receptor
(TIR) domain of TLR4 receptor. The binding
of Myd88 to TLR4 leads the recruitment of interleukin-1 receptor associated kinase (IRAK) to
Myd88. This leads to IRAK activation by phosphorylation upon which it is released from
Myd88. Upon its release phosphorylated IRAK binds to TNF receptor -associated factor 6
(TRAF6), which is then activated by K63 linked polyubiquitination. The poly-ubiquitin chains
on TRAF6 are recognized and bound by a kinase complex consisting of transforming-growth
Introduction
- 21 -
factor- β-activated kinase 1 (TAK1), TAK1-binding protein 1 (TAB1) and TAB2. This complex can then both activate the IKK complex, leading to NFκB activation (Fig 3) or activates MAPK kinases (MEK) leading to activation MAPK cascade comprising of three components p38, JNK and ERK which ultimately leads to the activation of inflammatory response be activating transcription factor AP-1 and EGR1 (Li and Verma 2002; Akira 2003; Takeda and Akira 2003).
A third signaling cascade activated upon LPS binding to TLR4 is the phosphoinositide 3-kinases
(PI3K) pathway. The activation of the PI3K pathway ultimately results in the activation of AKT
which mediate the activation of NFκB via GSK3β through transcriptional co-activators CREB
and CBP (Martin, Rehani et al. 2005). However the activation of PI3K pathway is argued to also
negatively regulate the activation of MAPK and NFκB in dendritic cells (DC) and monocytes
(Guha and Mackman 2002; Fukao and Koyasu 2003; Lee, Ye et al. 2003; Choi, Jang et al. 2006)
(Fig 3).
Introduction
- 22 - Fig 3. TLR4 signaling pathways.
LPS binding to Toll-like receptor 4 (TLR4)–CD14–MD-2 complexes activates an intracellular signalling cascade that involves the recruitment of Myd88 and IRAK (interleukin-1-receptorassociated kinase).
Activation of IRAK results in the phosphorylation of TNF-receptorassociated factor 6 (TRAF6), which might relay signals through the TAK1–TAB1–TAB2 complex to IKK complexes to activate the NF-κB pathway or to MAPK pathway activation leading to activation of p38, JNK and ERK. LPS binding to TLR4 also activates PI3K casacade which results in the activation of NF-κB and it also potentially inhibit IKK and MAPK signaling cascades possibly mediated by PKB, and thereby limits the production of inflammatory cytokines (Abbreviations: ERK:Extracellular signal-regulated kinase, JNK: c-jun N terminal kinase, Egr1: Early growth response factor 1, AP1: activator protein-1, cAMP response element binding, CBP: CREB binding protein)
Introduction
- 23 -
1.11 Role of Insulin signaling in macrophages
Insulin largely exerts metabolic effects in insulin responsive tissue. In addition, it plays a critical role in normal growth and development (Taniguchi, Emanuelli et al. 2006). Although the role of insulin signaling in macrophages is largely unknown, the activation of IR/IRS2/PI3k/AKT signaling in response to insulin is similar as that seen in other cell types. However it is believed that insulin signaling in macrophages might regulate protein synthesis and phagocytosis thus influencing macrophages function in innate immunity (Taniguchi, Emanuelli et al. 2006).
Early studies suggest that in contrast to other cell types insulin action in macrophages has no effect on glucose uptake (Liang, Han et al. 2004) but induces H
2O
2production, thereby leading to enhanced phagocytosis (Fortuno, San Jose et al. 2006). Moreover, reduced expression of IR- signaling components as observed in macrophages isolated from diabetic subjects in various studies suggests their importance in maintaining macrophage function (Comi, Grunberger et al.
1987; Naidoo, Jialal et al. 1987; Liang, Han et al. 2004). In support of the role of insulin- mediated macrophage inflammatory responses, recent studies have shown that stimulation of monocytes with insulin leads to increased expression and secretion of TNFα (Iida, Shimano et al.
2001; Iida, Suzuki et al. 2002). In addition, conditional disruption of insulin receptor in macrophages has been shown to blunt the expression and secretion of IL-6 after stimulation with LPS indicating a reduced inflammatory response in these cells (Baumgartl, Baudler et al. 2006).
Taken together the functional role of insulin signaling discussed, in macrophages remains controversial.
1.12 Aim
The activation of PI-3K pathway in response to various stimuli such as growth factors, leads to the activation of AKT and further downstream signaling cascade mediated by PDK1. The main aim of my project is to study what role does myeloid cell specific downstream kinase of insulin signaling PDK-1 has in
1. Inflammation and
2. Obesity induced insulin resistance.
Materials and Methods
-24-
2 Materials and Methods
2.1 Chemicals
Molecular weight markers for agarose gel electrophoresis (Gene Ruler DNA Ladder Mix) and for SDS-PAGE (Prestained Protein Ladder Mix) were obtained from MBI Fermentas, St. Leon- Rot, Germany. RedTaq DNA Polymerase and 10 x RedTaq buffer were purchased from Sigma- Aldrich, Seelze, Germany.
Chemicals Company
2-Deoxy-D-[1-
14C]-Glucose Amersham, Freiburg, Germany
α-[
32P]-dCTP Amersham, Freiburg, Germany
ε-aminocaproic acid Sigma-Aldrich, Seelze, Germany
Acetone KMF Laborchemie, Lohmar, Germany
Acrylamide Roth, Karlsruhe, Germany
Agarose (Ultra Pure) Invitrogen, Karlsruhe, Germany
Amyloglucosidase Roche, Mannheim, Germany
Aprotinin Sigma-Aldrich, Seelze, Germany
Avertin Sigma-Aldrich, Seelze, Germany
Benzamidine Sigma-Aldrich, Seelze, Germany
-Mercaptoethanol (-ME) AppliChem, Darmstadt, Germany Bovine serum albumin (BSA) Sigma-Aldrich, Seelze, Germany
Bradford reagent Bio-Rad, München, Germany
Bromphenol blue Merck, Darmstadt, Germany
Chloroform Merck, Darmstadt, Germany
D-[3-
3H]-Glucose Amersham, Freiburg, Germany
Desoxy-Ribonucleotid-Triphosphates (dNTPs) Amersham, Freiburg, Germany
Dextran sulfate AppliChem, Darmstadt, Germany
Dimethylsulfoxide (DMSO) Merck, Darmstadt, Germany
Dithiothreitol (DTT) Boehringer, Mannheim, Germany
Enhanced Chemiluminscence (ECL) Kit Perbio Science, Bonn, Germany
Ethanol, absolute AppliChem, Darmstadt, Germany
Ethidium bromide Sigma-Aldrich, Seelze, Germany
Ethylendiamine tetraacetate (EDTA) AppliChem, Darmstadt, Germany
Fetal Calf Serum (FCS) Gibco BRL, Eggenstein, Germany
Glacial acetic acid Roth, Karlsruhe, Germany
Glucose DeltaSelect, Pfullingen, Germany
Glycerol Serva, Heidelberg, Germany
Hydrochloric acid (37 %) KMF Laborchemie, Lohmar, Germany
Insulin Novo Nordisk, Bagsværd, Denmark
Isopropanol Roth, Karlsruhe, Germany
Ladderman
TMDNA Labeling Kit Cambrex Bio Science, Verviers, Belgium
Materials and Methods
- 25 -
Leptin Sigma-Aldrich, Seelze, Germany
Methanol Roth, Karlsruhe, Germany
Non-essential amino acids Gibco BRL, Eggenstein, Germany
Palmitate Sigma-Aldrich, Seelze, Germany
Penicillin/Streptomycin Solution Gibco BRL, Eggenstein, Germany Phenol-Chloroform-Isoamyl alcohol AppliChem, Darmstadt, Germany Phenylmethylsulfonylfluoride (PMSF) Sigma-Aldrich, Seelze, Germany Phosphate buffered saline (PBS) Gibco BRL, Eggenstein, Germany
Potassium hydroxide Merck, Darmstadt, Germany
Proteinase K Roche, Mannheim, Germany
RPMI 1640 w/out phenol red Gibco BRL, Eggenstein, Germany
Sodium acetate AppliChem, Darmstadt, Germany
Sodium chloride AppliChem, Darmstadt, Germany
Sodium dodecyl sulfate AppliChem, Darmstadt, Germany
Sodium hydroxide AppliChem, Darmstadt, Germany
Sodium fluoride Merck, Darmstadt, Germany
Sodium orthovanadate Sigma-Aldrich, Seelze, Germany
Sodium pyruvate Gibco BRL, Eggenstein, Germany
Sucrose AppliChem, Darmstadt, Germany
Tetramethylethylenediamine Sigma-Aldrich, Seelze, Germany
Thioglycollate Sigma-Aldrich, Seelze, Germany
Trishydroxymethylaminomethane (Tris) AppliChem, Darmstadt, Germany
Triton X-100 Applichem, Darmstadt, Germany
Tween 20 Applichem, Darmstadt, Germany
Western Blocking Reagent Roche, Mannheim, Germany
Table 1.
2.2 Molecular biology
Standard molecular biology methods were performed according to Sambrook and Russell (Sambrook and Russell 1989), unless otherwise stated.
2.2.1 Isolation of genomic DNA
Mouse tail biopsies were incubated 2-3 hours (h) in lysis buffer (100 mM Tris-HCl (pH 8.5), 5 mM EDTA, 0.2% (w/v) SDS, 0.2 M NaCl, 500 µg/ml proteinase K) in a thermomixer (Eppendorf, Hamburg, Germany) at 56°C. Peritoneal macrophages were incubated in lysis buffer at 56°C over night. Precipitation was performed by addition of one equivalent of isopropanol.
After centrifugation and a single washing step with 70% (v/v) ethanol, the DNA pellet was dried
at room temperature (RT) for 30 minutes and resuspended in double distilled water (ddH2O).
Materials and Methods
- 26 -
2.2.2 Quantification of Nucleic Acids
DNA and RNA concentrations were assessed by measuring the sample absorption at 260 nm with a NanoDrop
®ND-1000 UV-Vis Spectrophotometer (Peqlab, Erlangen, Germany). An optical density of 1 corresponds to approximately 50 µg/ml of double-stranded DNA and to 38 µg/ml of RNA.
2.2.3 Polymerase Chain Reaction (PCR)
The PCR method (Mullis and Faloona 1987; Saiki, Gelfand et al. 1988) was used to genotype mice for the presence of floxed alleles or transgenes with customized primers listed in Table 2.
Reactions were performed in a Thermocycler iCycler PCR machine (Bio-Rad, München, Germany) or in a Peltier Thermal Cycler PTC-200 (MJ Research, Waltham, USA). All amplifications were performed in a total reaction volume of 25 µl, containing a minimum of 50 ng template DNA, 25 pmol of each primer, 25 µM dNTP Mix, 10 x RedTaq reaction buffer and 1 unit of RedTaq DNA Polymerase. Standard PCR programs started with 4 minutes denaturation at 95°C (Abel, Peroni et al. 2001), followed by 30 cycles consisting of denaturation at 95°C for 45 seconds (sec), annealing at oligonucleotide-specific temperatures for 30 sec and elongation at 72°C for 30 sec and a final elongation step at 72°C for 7 min. PCR-amplified DNA fragments were applied to 1% - 2% (w/v) agarose gels (1 x TAE, 0.5 mg/ml ethidium bromide) and electrophoresed at 120 V.
Primer Sequence Orientation
LysMCre5’ CTC TAG TCA GCC AGC AGC TG Sense
LysMCre3’ ATG TTT AGC TGG CCC AAA TGT Antisense
p99 ATC CCA AGT TAC TGA GTT GTG TTG GAA G Sense
p100 TGT GGA CAA ACA GCA ATG AAC ATA CAC GC Antisense
p70 CAGTTCATCATTGCAAGAGTC Sense
Table 2. Oligonucleotides used for genotyping.
All primer sequences are displayed in 5’-3’ order. Primer orientation is designated “sense” when coinciding with transcriptional direction. All primers were purchased from Eurogentec, Cologne, Germany.
Materials and Methods
- 27 -
2.2.4 RNA Extraction, RT-PCR and Quantitative Realtime PCR
Total RNA from murine cells and tissues was extracted using the Qiagen RNeasy Kit (Qiagen, Hilden, Germany). 1 µg of each RNA sample was reversely transcribed using the Eurogentec RT Kit (Eurogentec, Cologne, Germany) according to manufacturer’s instructions. The cDNA was subsequently amplified using an ABI Prism 7900HT Fast Real-time PCR System (Applied Biosystems, Foster City, USA).
Probe Catalogue No.
CCl2 Mm00441242_m1
CCl3 Mm00441258_m1
CCl4 Mm0044311_m1
CCl5 Mm01302428_m1
CCl7 Mm0044113_m1
CXCl2 Mm00436450_m1
CXCl10 Mm00445235_m1
F4/80 Mm00802530_m1
Gusb Mm00446953_m1
Hprt1 Mm00446968_m1
IL6 Mm00446190_m1
MacII Mm00802901_m1
TNFα Mm00443258_m1
Table 3. Taqman Gene Expression Assays
All assays were purchased from Applied Biosystems, Foster City, USA.
Relative expression of mRNA was determined using standard curves based on cDNA isolated
from macrophages or adipose tissue. Samples were adjusted for total cDNA content by
Glucuronidase beta (Gusb) and hypoxanthine guanine phosphoribosyl transferase (Hprt-) 1
mRNA quantitative Realtime PCR. Calculations were performed by a comparative method (2-
ΔΔCT). In brief, the amplification plot is the plot of fluorescence versus PCR number. The
threshold cycle value (Ct) is the fractional PCR cycle number at which the fluorescent signal
Materials and Methods
- 28 -
reached the detection threshold. Therefore, the input cDNA copy number and Ct are inversely related.Data were analyzed with the Sequence Detector System (SDS) software version 2.1 (ABI) and Ct value was automatically converted to fold change RQ value ((RQ) = 2− (ΔΔCT)).
The RQ values from each gene were then used to compare the gene expression across all groups.
2.3 Biochemistry
2.3.1 Protein Extraction from cells
Cell pellets or snap-frozen tissues were disrupted in lysis buffer (50 mM HEPES (pH 7.4), 1%
(v/v) Triton X-100, 0.1 M sodium fluoride, 10 mM EDTA, 50 mM sodium chloride, 10 mM sodium orthovanadate, 0,1% (w/v) SDS, 10 µg/ml aprotinin, 2 mM benzamidine, 2 mM phenylmethylsulfonyl fluoride (PMSF)) by resuspension and gentle vortexing or by usage of a polytron homogenizer (IKA Werke, Staufen, Germany), respectively. Particulate matter was removed by centrifugation for 1 h at 4°C. The supernatant was transferred to a fresh vial and protein concentration was determined using a Bradford assay. Protein extracts were diluted to 5 mg/ml with lysis buffer and 4 x SDS sample buffer (125 mM Tris-HCl (pH 6.8), 5% (w/v) SDS, 43.5% (w/v) glycerol, 100 mM DTT, and 0.02% (v/v) bromophenol blue), incubated at 95°C over 5 min and stored at - 80°C.
2.3.2 Protein extraction from tissue
100-500 mg tissue were dissolved in 1 ml lysis buffer containing 50 mM HEPES [pH 7.4], 1%
Triton X-100, 0.1% SDS, 100 mM NaF, 10 mM Na3O4V, 250 mM EDTA, 50 mM NaCl, 10
µg/ml aprotinin, 2 mM benzamidin, 348 µg/ml PMSF, and homogenized using a Ultra Thurrax
homogenizer. Protein extracts were centrifuged for 45 min at 4°C to separate supernatants from
debris. Protein concentration was measured using a photometer and the Christian-Warburg
formula. 10 µg/µl protein stock solution was prepared in 1xSDS sample buffer and heated at
95°C for 5 min. 100µg protein were used for immunoblotting. Protein solutions were always
stored at -80°C.
Materials and Methods
- 29 -
2.3.3 Nuclear and cytoplasmic protein extraction
Peritoneal macrophages were washed with PBS. 106 cells were resuspended in 15 µl hypotonic buffer A containing 10 mM HEPES [pH 7.6], 10 mM KCl, 2 mM MgCl2, 0.5 mM DTT, 0.1 mM EDTA, and 1 tablet of Proteinase Inhibitor (Complete mini, Roche, Germany) and incubated for 10 min at 4°C. NP40 were added to a final concentration of 1% and incubated at 4°C for 1 min.
Cells were immediately collected by centrifugation at 13000rpm at 4°C for 1 min. The supernatant contained the cytoplasmic fraction. The pellet was washed with buffer A and resuspended in 10 µl high salt buffer B containing 50 mM HEPES [pH 7.8], 50 mM KCl, 300 mM NaCl, 0.5 mM DTT, 0.1 mM EDTA, 10% glycerol, and 1 tablet of Proteinase Inhibitor (Complete mini, Roche, Germany). The pellet was incubated at 4°C on a full speed shaker for 1 h. After incubation, the suspension was centrifuged at 13000 rpm at 4°C for 1 h. The supernatant contained the nuclear fraction.
2.3.4 Immunoprecipitation
500 µg nuclear proteins were incubated with 2.5 µg of antibody at 4°C on a rotator overnight.
Then, 100 µl of Protein A-Sepharose (100 mg/ml, Amersham, Freiburg, Germany) were added and incubated overnight. The suspension was washed 5 times with high salt buffer B, 50 µl 2xSDS loading buffer was added, and samples were incubated for 5 min at 95°C. The samples were separated on SDS-PAGE gels, and processed for western blot analysis.
2.3.5 IKK Kinase Assay
Freshly prepared whole cell lysates were immunoprecipitated with anti IKKγ antibody (SC-8330,
Santa cruz). Kinase activity of NEMO dependent IKK complex was determined using
biotinylated IκBα (Ser 32) peptide (#1146 cell signaling) as a substrate in a kinase reaction
comprising of kinase buffer 20mM HEPES pH 7.7, 2mM MgCl
2, 2mM MnCl
2, 1mM DTT,
γATP
32P and phosphatase inhibitors at 30
0C for 30 minutes. The phosphorylated biotinylated
IκBα (Ser 32) peptide was then purified from the kinase reaction buffer using streptavidin
Agarose beads (invitrogen) and incubating the reaction cocktail with beads at 4
0C for 30
minutes, accompanied by periodical shaking. The purified biotinylated IκBα (Ser 32) peptide
Materials and Methods
- 30 -
coupled to streptavidin beads were the transferred to scintillation vials containing 4ml of scintillating counting media and counted in a BD Scintillator counter.
2.3.6 Electrophoretic mobility-shift Assay
Nuclear extracts prepared from 5 X 10
6peritoneal macrophages stimulated with 1µg/ml of LPS.
4µg of nuclear extracts was incubated for 30 min at room temperature with 2µg poly (dI-dC) and 0.5ng of probe for NFκB consensus site (5′-CGGGCTGGGGATTCCCCATCTCGGTAC-3′) labeled with
32P. the reaction was performed in the following reaction buffer 100mM Tris HCl pH 7.5, 1M NaCl, 50mM DTT, 10mM EDTA, 40% glycerol, and 1mg/ml of BSA. The samples were fractionated on a 5% PAGE and visualized using autoradiography.
2.3.7 Western Blot Analysis
Frozen protein extracts were thawed at 95°C for 5 min, then separated on 10-15% (v/v) SDS polyacrylamide gels (Laemmli 1970) and blotted onto PVDF membranes (Bio-Rad, München, Germany). Membranes were then incubated with 1% (v/v) blocking reagent (Roche, Mannheim, Germany) for 1 h at RT. Subsequently, primary antibodies (Table 4) diluted in 0.5% (v/v) blocking solution were applied over night at 4°C. PVDF membranes were then washed four times for 5 min with 1 x TBS/0.01 (v/v) Tween. After 1 h incubation at RT with the respective secondary antibodies, membranes were washed 4 times for 10 min with 1 x TBS/0.01 (v/v) Tween, rinsed in 1 x TBS, incubated for 1 min in Pierce ECL Western Blotting Substrate (Perbio Science, Bonn, Germany), sealed in a plastic bag and exposed to chemiluminescence film (Amersham, Braunschweig,
Germany). Films were developed in an automatic developer.
Antibody Catalogue No. Company
Akt 9272 Cell Signaling
ß-Actin(clone AC-15) A5441 Sigma
GSKß 9315 Cell Signaling
IκBα 9246 Cell Signaling
IRAK 1 4362 Cell Signaling
insulin receptor β subunit sc-711 Santa Cruz Biotechnology Inc
Materials and Methods
- 31 -
PDK-1 611070 BD bioscience
Phospho-AKT (Ser 473) 9271 Cell Signaling
Phospho p44/42 9106 Cell Signaling
p44/42 9102 Cell Signaling
Phospho SAPK/JNK 9251 Cell Signaling
Phospho p38 9216 Cell Signaling
p38 9212 Cell Signaling
Phosho IκBα(Ser 32/36) 9246 Cell Signaling
Phospho IRAK 1 4361 Cell Signaling
SAPK/JNK 9252 Cell Signaling
TRAF 6 sc-7221 Santa Cruz Biotechnology Inc
Ub(n) sc-8017 Santa Cruz Biotechnology Inc
Table 4. List of antibodies used for western Blot Analysis.
2.3.8 Enzyme linked Immunosorbent Assay (ELISA)
Mouse insulin (Mouse/Rat Insulin ELISA; Crystal Chem, Downers Grove, IL,USA), leptin
(ACTIVE
®Murine Leptin ELISA; Diagnostics Systems Laboratories, Webster, TX, USA), TNF-
α (Quantikine Mouse TNF-alpha/TNFSF1A ELISA; R&D Systems, Wiesbaden, Germany), IL-6
(Quantikine Mouse IL-6 ELISA; R&D Systems, Wiesbaden, Germany), adiponectin (Quantikine
Mouse Adiponectin/Acrp30 ELISA; R&D Systems, Wiesbaden, Germany).Concentration in
serum or cell culture supernatant was determined using mouse standards according to
manufacturer’s guidelines and measured on a Precision Microplate Reader (Emax; Molecular
Devices GmbH, München, Germany).
Materials and Methods
- 32 -
2.4 Cell Culture and Tissue Analysis
2.4.1 Culture of Primary Murine Macrophages
Cells were plated at a density of 1*106/ml on tissue culture dishes (Greiner Bio-One GmbH, Frickenhausen, Germany) in RPMI 1640 (supplemented with 10% (v/v) heat inactivated FCS, 1% (v/v) glutamine, 1% (v/v) penicillin-streptomycin) and were allowed to adhere overnight at 37°C, 5% CO2 and 95% humidity. On the next day, adherent cells were washed once with PBS followed by further incubation in RPMI 1640. Preceding all the experiments, cells were washed two times with sterile PBS and, if stimulated with LPS (1µg/ml), serum-starved for 16-20 h.
2.4.2 TUNEL Assay
TUNEL assay was performed using manufacturer’s guidelines (Dead END
TMFluorometric TUNEL system, Promega). Briefly, dissected liver was snap-frozen in Jung Tissue Freezing Medium
®(Leica Microsystems Nussloch GmbH, Nussloch, Germany), transferred to a cryostat (Leica Microsystems Nussloch GmbH, Nussloch, Germany) and cut into 7µm thin sections.
Specimens were collected on clean poly-L-lysine-coated glass slides (Menzel GmbH, Braunschweig, Germany), dried at room temperature. After two washing steps with PBS, cells were permeabilized with 0.2% (v/v) Triton X-100 in PBS for 5 min at RT. Following two additional washing steps with PBS, equilibration buffer was added to the slides and incubated for 10 min at RT. After removal of equilibration buffer, incorporation of fluorescein-12-dUTP by rTdT enzyme was carried out at 37°C in the dark for 60 min. The reaction was stopped by addition of 2x SSC and after three washing steps with PBS, slides were mounted with Vectashield DAPI medium (# H-1200, Vector Laboratories Inc, Burlingame, CA, USA) and analyzed under a fluorescence microscope. Quantification of DAPI- and FITC-positive cells was performed using AxioVision 4.2 (Carl Zeiss MicroImaging GmbH, Oberkochen, Germany).
2.4.3 Histological Analysis and Immunohistochemistry
White adipose tissue of diet-induced obese Control and PDK-1
Δmyelmice was dissected, fixed
overnight in 4% (w/v) PFA and then embedded for paraffin sections. Subsequently, 7 µm thin
Materials and Methods
- 33 -