The role of inflammatory mediators in the development
of
insulin resistance
and hepatocellular carcinoma
I n a u g u r a l – D i s s e r t a t i o n zur
Erlangung des Doktorgrades
der Mathematisch-Naturwissenschaftlichen Fakultät der Universität zu Köln
vorgelegt von Peter Dirk Ströhle
aus Mutlangen
Köln 2011
Berichterstatter/in: Prof. Dr. Jens C. Brüning
Priv. Doz. Dr. F. Thomas Wunderlich
Tag der mündlichen Prüfung: 25.Januar 2012
„Jedem tiefen Naturforscher muß eine Art religiösen Gefühls naheliegen, weil er sich nicht vorzustellen vermag, daß die ungemein feinen Zusammenhänge, die er erschaut, von ihm zum erstenmal gedacht werden.“
Albert Einstein (1879 – 1955)
„Liebe Familie und Freunde, ich schätze eure Geduld und
Unterstützung, die ihr mir immer entgegengebracht habt. Damit habt ihr auch einen großen Teil zu dieser Arbeit beigetragen. Ihr seid
unbezahlbar!"
Table of contents
____________________________________________________________________________________________________________________________
Table of contents:
Table of contents: ... I Figure index:...V Table index: ...VII Abbreviations:...VIII
1. Introduction: ... 1
1.1 Obesity...1
1.2 Energy homeostasis...2
1.2.1 The role of insulin signaling in energy homeostasis ...2
1.2.2 The insulin signaling cascade ...3
1.2.3 The role of hepatic gluconeogenesis in glucose homeostasis...5
1.3 Obesity-associated inflammation and insulin resistance...6
1.3.1 IL-6 and insulin resistance ...7
1.3.2 TNF-
αand insulin resistance ...9
1.4 Cancer and hepatocellular carcinoma (HCC)...10
1.5 Linking inflammatory processes to HCC...11
1.5.1 Toll-like receptor (TLR) signaling in liver damage and HCC ...11
1.5.2 MyD88 dependent TLR signaling...13
1.5.3 MAPK signaling and HCC ...14
1.5.4 NF-κB signaling and HCC...15
1.6 Objectives...16
2. Materials and Methods: ... 17
2.1 Chemicals and enzymes ...17
2.2 Mouse experiments ...21
2.2.1 Animal care ...21
2.2.2 Generation of IL-6R
αL-KOand MyD88
L-KOmice...22
2.2.3 Body weight and body composition ...22
2.2.4 Collection of blood samples and determination of blood glucose levels...22
Table of contents
____________________________________________________________________________________________________________________________
2.2.6 Indirect calorimetry, locomoter activity and daily food intake ...23
2.2.7 Euglycemic-hyperinsulinemic clamp studies (EHCS) ...24
2.2.7.1 Implantation of the catheter...24
2.2.7.2 Radioactive EHCS procedure ...24
2.2.7.3 Determination of the glucose turnover rate (mg/[kg*min])...25
2.2.7.4 Calculation of the hepatic glucose production (HGP)...26
2.2.7.5 Determination of the in vivo glucose uptake in the tissues...26
2.2.8 Ablation of Kupffer cells (KCs) ...26
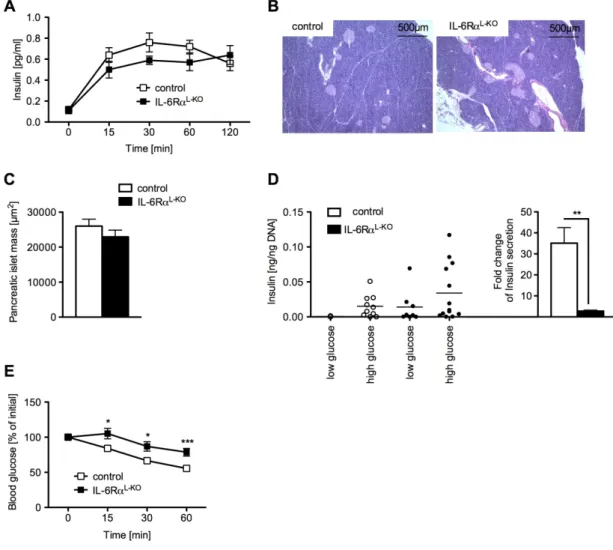
2.2.9 Glucose-induced insulin secretion of isolated pancreatic islets ...27
2.2.10 Diethylnitrosamine (DEN) treatment ...27
2.2.10.1 Long-term treatment:...27
2.2.10.2 Short-term treatment: ...28
2.2.11 Analysis of serum protein and cytokine concentrations ...28
2.3 Molecular biology ...29
2.3.1 Isolation of genomic DNA...29
2.3.2 Quantification of nucleic acids...29
2.3.3 Southern blot analysis...29
2.3.4 Polymerase chain reaction (PCR)...30
2.3.5 RNA extraction ...31
2.3.6 Quantitative real-time PCR ...32
2.4 Biochemistry ...34
2.4.1 Protein extraction ...34
2.4.2 Western blot analysis ...35
2.4.3 Electrophoretic mobility shift assay (EMSA) ...36
2.4.4 Enzyme-linked immunosorbent assay (ELISA)...36
2.4.5 Histological analysis and immunohistochemistry ...37
2.4.5.1 Immunohistochemistry ...37
2.5 Computer analysis...38
2.5.1 Densitometrical analysis ...38
2.5.2 Quantitation of pancreatic islet mass ...38
2.5.3 Statistical methods ...38
3. Results ... 39
3.1 The effect of hepatic IL-6Rα signal transduction on glucose homeostasis ...39
3.1.1 Generation of hepatocyte specific IL-6R
αknock out mice...39
Table of contents
____________________________________________________________________________________________________________________________
3.1.2 IL-6Rα
L-KOmice exhibit unaltered energy homeostasis ...41 3.1.3 IL-6Rα
L-KOmice exhibit impaired glucose homeostasis and insulin
sensitivity...44 3.1.4 IL-6R
αL-KOmice exhibit counteracting actions on hepatic glucose
metabolism...46 3.1.5 Mice lacking hepatic IL-6 signaling exhibit insulin resistance in skeletal muscle and WAT...50 3.1.6 Increased inflammatory tone in IL-6Rα
L-KOmice...52 3.1.7 Neutralization of TNF-α normalizes glucose homeostasis in IL-6Rα
L-KOmice...56
3.2 The effect of hepatic Myd88 signaltransduction on glucose homeostasis and HCC development...603.2.1 Generation of MyD88
L-KOmice ...60 3.2.2 Unaltered adiposity in mice lacking hepatic MyD88 signaling ...62 3.2.3 Glucose homeostasis and insulin sensitivity is unaltered in MyD88
L-KOmice...64 3.2.4 MyD88
L-KOmice exhibit reduced DEN-induced hepatocarcinogenesis ...65 3.2.5 Reduced expression of macrophage markers in HCC of mice lacking hepatic MyD88 signaling ...69 3.2.6 The mRNA expression of LIF in HCC is mediated by hepatic MyD88...71 3.2.7 Reduced NF-
κB activation in DEN-induced HCC of MyD88
L-KOmice ...74 3.2.8 MyD88
L-KOmice exhibit reduced hepatic JNK activation in DEN-induced HCC ...75
4. Discussion... 80
4.1 The ALFP-Cre transgene mediates specific inactivation of theloxP-flanked IL-6Rα or MyD88 alleles in hepatocytes...81 4.2 Hepatocyte specific disruption of the IL-6Rα impairs glucose
homeostasis and insulin sensitivity ...82 4.3 Crosstalk between hepatocytes and Kupffer cells through hepatic IL-6 signaling controls the inflammatory tone ...84 4.5 The role of hepatic MyD88 in energy homeostasis ...86 4.6 Hepatocyte specific disruption of MyD88 reduces chemically induced HCC ...87
Table of contents
____________________________________________________________________________________________________________________________
5. Summary... 90
6. Zusammenfassung ... 92
7. References... 94
8. Acknowledgements ... 113
9. Erklärung ... 114
10. Curriculum Vitae ... 115
Figure index
____________________________________________________________________________________________________________________________
Figure index:
Fig. 1: Prevalence of obesity in adults from 2001 and 2010 ...1
Fig. 2: Insulin signal transduction ...4
Fig. 3: The role of G6Pase and GK in the regulation of glucose homeostasis...5
Fig. 4: IL-6 signaling cascade...8
Fig. 5: Potential mechanisms for the inhibition of insulin signal transduction...9
Fig. 6: Cancer distibution and HCC incidence rates worldwide in 2011...10
Fig. 7: Toll-like receptors and their PAMP ligands ...12
Fig. 8: Toll-like receptor signaling cascade ...13
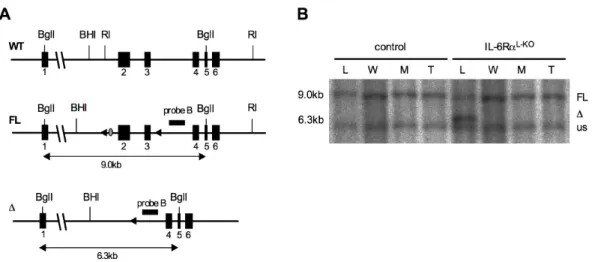
Fig. 9: Targeting strategy and confirmation of the IL-6RαFL/FL allele ...40
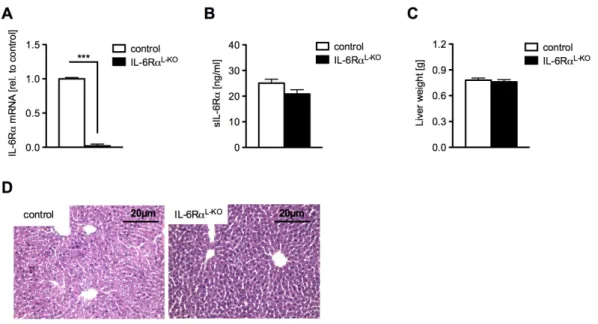
Fig. 10: Liver specific ablation of the IL-6Rα gene ...41
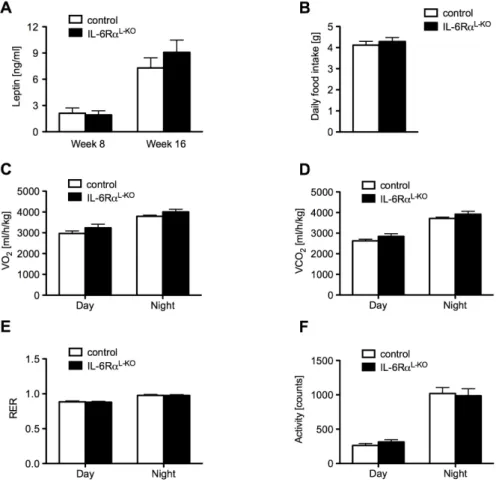
Fig. 11: IL-6RαL-KO mice show unaltered adiposity...42
Fig. 12: Unchanged energy homeostasis in mice lacking hepatic IL-6Rα signaling ...43
Fig. 13: IL-6RαL-KO mice exhibit decreased glucose tolerance...44
Fig. 14: Impaired insulin sensitivity in IL-6RαL-KO mice...45
Fig. 15: Altered regulation of glucose homeostasis in IL-6RαL-KO mice...47
Fig. 16: Counteracting actions on hepatic glucose metabolism in IL-6RαL-KO mice...49
Fig. 17: Decreased insulin sensitivity in liver, skeletal muscle and WAT of IL-6RαL-KO mice ..51
Fig. 18: Increased inflammation in livers of IL-6RαL-KO mice...53
Fig. 19: IL-6RαL-KO mice exhibit elevated inflammatory state in skeletal muscle...54
Fig. 20: IL-6RαL-KO mice exhibit enhanced systemic inflammation ...55
Fig. 21: Ablation of TNF-α lead to normalized glucose homeostasis in IL-6RαL-KO mice ...56
Fig. 22: Normalized glucose homeostasis in IL-6RαL-KO mice after depletion of Kupffer cells ...57
Fig. 23: Alterations of glucose stimulated insulin secretion after depletion of Kupffer cells in IL-6RαL-KO mice...58
Fig. 24: Targeting strategy and ablation of MyD88 specific in the liver ...61
Fig. 25: Similar bodyweight and body fat content between control and MyD88L-KO mice...63
Fig. 26: Unaltered cholesterol and lipid metabolism in MyD88L-KO mice ...63
Fig. 27: Unaltered glucose homeostasis and insulin sensitivity in MyD88L-KO mice ...65
Fig. 28: Reduced DEN-induced liver damage in MyD88L-KO mice...67
Fig. 29: Lower DEN-induced HCC incidence in MyD88L-KO mice ...68
Fig. 30: MyD88L-KO mice show reduced macrophage marker expression in the liver...70
Fig. 31: Unaltered mRNA expression of chemokines between control and MyD88L-KO mice ..71
Fig. 32: Elevated mRNA expression of LIF in MyD88L-KO mice compared to control mice...72 Fig. 33: Unaltered IL-6 signaling in MyD88L-KO mice compared to control mice upon acute
Figure index
____________________________________________________________________________________________________________________________
Fig. 34: MyD88L-KO mice exhibit reduced p65 activation upon DEN treatment...74
Fig. 35: Reduced JNK activation in HCC of MyD88L-KO mice compared to control mice...76
Fig. 36: Unaltered MAPK signaling in MyD88L-KO mice upon acute DEN treatment...77
Fig. 37: MyD88L-KO mice exhibit decreased pro-apoptotic marker expression ...78
Table index
____________________________________________________________________________________________________________________________
Table index:
Table 1: Chemicals...17
Table 2: Enzymes...21
Table 3: List of oligonucleotides used for Southern probe generation ...30
Table 4: List of oligonucleotides used for PCR ...31
Table 5: List of Taqman gene expression assays ...32
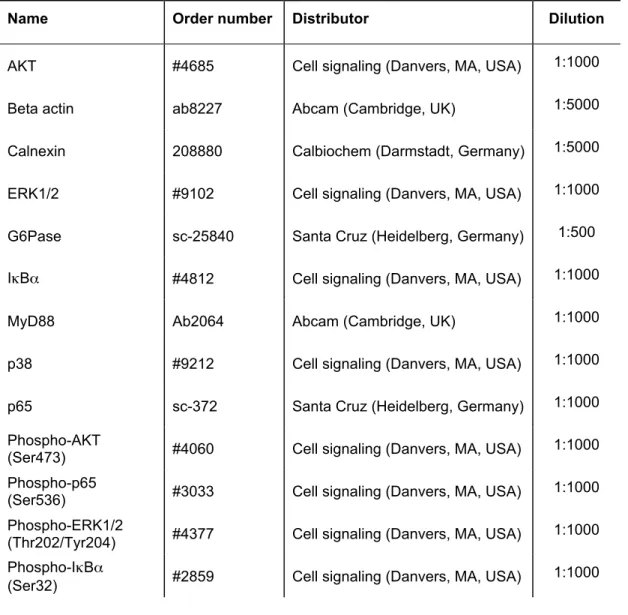
Table 6: List of primary antibodies used for Western blot analysis ...35
Table 7: EMSA probes ...36
Table 8: List of ELISA kits ...37
Abbreviations
____________________________________________________________________________________________________________________________
Abbreviations:
°C Degrees celsius
β-me β-mercaptoethanol
2DG 2-Deoxy-D-[1-14C] glucose
2DG6P 2-Deoxy-D-[1-14C] glucose-6-phosphate
3’ Three prime end of DNA sequences
5’ Five prime end of DNA sequences
A Adenosine
AKT Protein kinase B
ALFP Albumin promotor/α-fetoprotein enhancer
ALT Alanine transaminase
AMP Adenosinmonophosphat
AMPK AMP-dependent kinase
AP-1 Activator protein 1
APS Ammonium persulfate
ASR Age-standardized incidence rates
AST Aspartate transaminase
Ba(OH)2 Barium hydroxide
Bcl-2 B-cell lymphoma 2
BHI BamHI
bp Base pairs
BMI Body mass index
BSA Bovine serum albumine
Abbreviations
____________________________________________________________________________________________________________________________
C Cytosine
c-Jun Jun proto-oncogene
c-Rel V-rel reticuloendotheliosis viral oncogene homolog (avian)
CaCl2 Calcium chloride
CBA Cytometric bead array
CD-68 Cluster of differentiation 68
cDNA Complementary DNA
Ci Curie
CNS Central nervous system
CO2 Carbon dioxide
cps Counts per second
Cre Site-specific recombinase from phage P1 (causes recombination)
ct Threshold cycle value
CTP Cytosine triphosphate
DAMPS Damage-associated molecular patterns
DAPI 4',6-diamidino-2-phenylindole
DEN Diethylnitrosamine
DMSO Dimethylsulfoxide
DNA Desoxyribonucleic acid
DNase Desoxyribonuclease
dNTP Desoxyribonucleotide-triphosphate
dpm Disintegrations per minute
ds Double-stranded
DTT 1,4-Dithio-DL-threitol
Abbreviations
____________________________________________________________________________________________________________________________
e.g. exempli gratia
ECL Enhanced chemiluminescence
EDTA Ethylendiamine tetraacetate
EHCS Euglycemic-hyperinsulinemic clamp studies
ELISA Enzyme-linked immunosorbent assay
ERK Extracellular signal-regulated kinase
EtBr Ethidium bromide
EtOH Ethanol
F4/80 EGF-like module containing, mucin-like, hormone receptor-like sequence 1
FACS Fluorescence activated cell sorting
FCS Fetal calf serum
g Gram
G Guanine
G6P Glucose-6-phosphate
G6Pase Glucose-6-phosphatase
GIR Glucose infusion rate
GK Glucokinase
Grb2 Growth factor receptor-bound-2 protein
GSIS Glucose stimulated insulin secretion
GTP Guanosine triphosphate
GTT Glucose tolerance test
Gusb Glucuronidase beta
h Hour
H2O Water
Abbreviations
____________________________________________________________________________________________________________________________
HCC Hepatocellular carcinoma
HCl Hydrochloric acid
H&E Hematoxylin/eosin
HEPES N-2-hydroxyethylpiperazine-N’-2-ethansulfonic acid
HGP Hepatic glucose production
HFD High fat diet
HMGB1 High mobility group box 1
HPRT-1 Hypoxanthine guanine phosphoribosyl transferase-1
i.e. id est
i.p. Intraperetoneal
i.v. Intravenous
IκB Inhibitor of κB
IKK IκB kinase
IL-10 Interleukin 10
IL-1Ra IL-1 receptor antagonist
IL-6 Interleukin 6
IL-6Rα Interleukin 6 receptor α
IR Insulin receptor
IRAK Interleukin-1 receptor-associated kinase
IRS Insulin receptor substrate
ITGAM Integrin-α-M
ITGAX Integrin-α-X
ITT Insulin tolerance test
JNK C-Jun-N-terminal kinase
Abbreviations
____________________________________________________________________________________________________________________________
k Kilo
kb Kilobase
KC Kupffer cell
KCl Potassium chloride
KOH Potassium hydroxide
l Liter
LIF Leukemia inhibitory factor
loxP Recognition sequence for Cre (locus of crossing over phage P1)
LPS Lipopolysaccharide
m Milli
M Mol
MAC-2 Galectin-3
MAPK Mitogen-activated protein kinase
MCP-1 Monocyte chemo-attractant protein 1
MCP-3 Monocyte chemo-attractant protein 3
MgCl2 Magnesium chloride
min Minute
MIP-1α Macrophage inflammatory protein 1α
MIP-1β Macrophage inflammatory protein 1β
MKK MAPK kinase
MKKK MAPK kinase kinase
MyD88 Myeloid differentiation primary response gene 88
mRNA Messenger ribonucleic acid
NaCl Sodium chloride
Abbreviations
____________________________________________________________________________________________________________________________
n Nano
NaF Sodium fluoride
NaOH Sodium hydroxide
NCD Normal chow diet
NF-κB Nuclear factor 'kappa-light-chain-enhancer' of activated B-cells
NMR Nuclear magnetic resonance
O2 Oxygen
OD Optical density
P Phosphorylation
p Pico
p38 Mitogen-activated protein kinase 14
p53 Tumor protein p53
PAGE Polyacrylamid gel electrophoresis
PAMPS Pathogen-associated patterns
PBS Phosphate buffered saline
PCR Polymerase chain reaction
PDK1 Phosphoinositide-dependent protein kinase 1
PEPCK Phosphoenolpyruvate carboxykinase
PFA Paraformaldehyde
PH Pleckstrin homology
PI3K Phosphatidylinositol 3 kinase
PIP2 Phosphatidylinositol-4,5-bisphosphate PIP3 Phosphatidylinositol-3,4,5-trisphosphate
PKB Protein kinase B
Abbreviations
____________________________________________________________________________________________________________________________
PMSF Phenylmethylsulfonylfluoride
PTB Phosphotyrosine binding
PVDF Polyvinylidene fluoride
RI EcoRI
RANTES Regulated upon activation, normally T-expressed, and presumably secreted
Ras Rat sarcoma
RD Glucose disposal rate
RelA V-rel reticuloendotheliosis viral oncogene homolog A RelB V-rel reticuloendotheliosis viral oncogene homolog B
RER Respiratory exchange ratio
RIP1 Receptor interacting protein 1
RNA Ribonucleic acid
RNase Ribonuclease
ROS Reactive oxygen species
rpm Rounds per minute
RT Room temperature
SAPK Stress-activated protein kinases
SDS Sodiumdodecylsulfate
sec Second
SEM Standard error of the mean
Ser Serin
SH2 Src-homology 2
SHP2 SH2-domain-containing phosphatase
SOCS3 Suppressor of cytokine signalling 3
Abbreviations
____________________________________________________________________________________________________________________________
SOS Son of sevenless homolog
Src Sarcoma
ss Single-stranded
SSC Sodium chloride/ sodium citrate buffer
STAT-3 Signal transducer and activator of transcription 3
T Thymine
TAE Tris-acetic acid-EDTA buffer
Taq Pol Polymerase from Thermus aquaticus
TBE Tris/borate/EDTA buffer
TBK1 TANK-binding kinase 1
TBS Tris buffered saline
TE Tris-EDTA buffer
TEMED Tetramethylethylenediamine
TG Triglyceride
Thr Threonine
TIR Toll/interleukin-1 receptor
TIRAP TIR domain-containing adapter protein
TLR Toll-like receptor
TNF Tumor necrosis factor
TNFsRp55 Soluble TNF receptor p55
TRAF6 Tumor necrosis factor receptor-associated factor 6
TRAM TRIF-related adapter molecule
TRIF TIR domain–containing adapter–inducing IFNβ
Tris 2-amino-2-(hydroxymethyl-)1,3-propandiol
Abbreviations
____________________________________________________________________________________________________________________________
TWEEN Polyoxethylene-sorbitan-monolaureate
Tyr Tyrosine
U Unit
UV Ultraviolet
V Volt
v/v Volume per volume
W Watt
w/o Without
w/v Weight per volume
WHO World Health Organization
wt Wild-type
ZnSO4 Zinc sulfate
µ Micro
Introduction
____________________________________________________________________________________________________________________________
1. Introduction:
1.1 Obesity
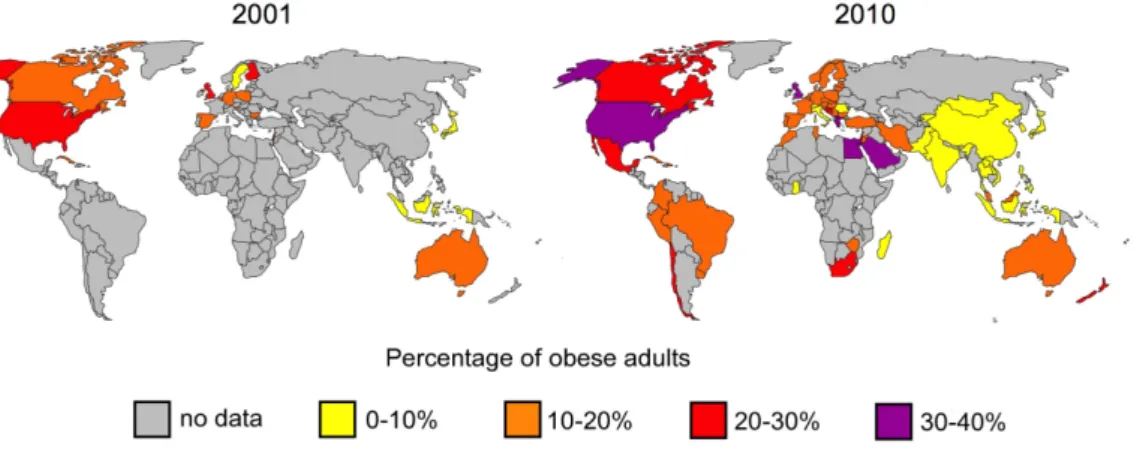
Obesity is defined as a condition of abnormal or excessive bodyfat accumulation that may have adverse effects on health. It is one of the biggest public health threats of the 21
stcentury and its prevalence is steadily increasing woldwide (Fig. 1). In 2008, approximately 1.5 billion adults were overweight. Of these adults, over 200 million men and approximately 300 million women were obese. Following recordings of each country in the WHO European Region from 2008, over 50% of both men and women have a body mass index (BMI = weight in kilograms / size in meters
2) higher than 25 and are thus considered overweight. Nearly 23% of these were obese indicated by a BMI above 30 (1).
Fig. 1: Prevalence of obesity in adults from 2001 and 2010
The worldwide prevalence of obese adults (BMI >30) compared from 2001 and 2010. Datas were obtained from the WHO.
Obesity is known to increase the risk of developing various diseases, such as
cardiovascular diseases, diabetes mellitus, atherosclerosis and certain types
of cancer (2-5). As a consequence, approximately 0.7% to 2.8% of a country's
total healthcare expenditures are associated with overweight and obesity and
thus place a significant financial burden on the healthcare system (6, 7). Due
to these facts, remarkable efforts have been conducted to understand the
regulatory mechanisms of energy homeostasis, insulin action and body weight
Introduction
____________________________________________________________________________________________________________________________
1.2 Energy homeostasis
The relationship between daily energy expenditure and bodyweight regulation was first demonstrated 50 years ago (8). To maintain stable body mass and body composition, the balance between energy intake and energy expenditure is essential and tightly regulated by physiological signals within the organism (9-14). These signals include fat mass gain during overabundance or increased calorie intake in case of depleted energy (9, 15).
Malfunction of the regulatory system, either due to genetic predisposition or environmental factors or a combination of both, are presumably leading to the development of obesity (16-18). Importantly, almost unlimited access to high caloric food and the trend to reduced physical activity in industrialized countries results in a positive energy balance, ultimately leading to overweight and obesity.
In the last decade, numerous studies investigated the underlying regulatory mechanisms of energy homeostasis and identified the metabolic hormones insulin and leptin as two of the central regulators of body weight control, energy homeostasis and glucose metabolism (19, 20).
1.2.1 The role of insulin signaling in energy homeostasis
The peptide hormone insulin is secreted by β-cells, which are exclusively
located on the pancreatic islets of Langerhans. Its active form is derived from
cleavage of the inactive precursor proinsulin in the β-cells (21). As response
to rising blood glucose levels, insulin is released into the circulation, and
subsequently stimulates glucose uptake in peripheral tissues (22, 23). After
being taken up into the cell, glucose is either directly metabolized to generate
energy in the form of adenosine-5'-triphosphate (ATP) or, especially in liver
and muscle, stored as glycogen. Furthermore, insulin is also involved in the
control of different metabolic processes, such as the stimulation of amino acid
uptake and glycolysis, as well as the inhibition of catabolic processes, such as
Introduction
____________________________________________________________________________________________________________________________
glycogenolysis, gluconeogenesis and hepatic glucose production (24, 25).
The amino acid sequence of insulin is highly conserved among vertebrates and some other species, emphasizing the importance of this hormone and its pleiotropic effects (26).
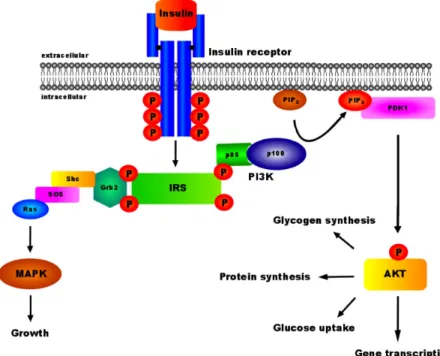
1.2.2 The insulin signaling cascade
Upon release, insulin binds to its receptor and initiates an intracellular signaling cascade (Fig. 2) resulting in the regulation of various cellular functions (27). Like other receptors for protein hormones, the insulin receptor (IR) is a membrane-bound receptor and belongs to the family of receptor tyrosine kinases. The IR comprises two extracellular α- and two intracellular β-subunits, which are linked by disulfide bridges. Binding of insulin to the α-subunits induces a conformational change of the receptor, leading to the activation of the intrinsic tyrosine kinase activity of the β-subunits and thus to autophosphorylation of multiple tyrosine residues (28-30). Due to these phosphorylations, intracellular signaling molecules, such as the four closely related insulin receptor substrates (IRS 1-4) are recruited to the IR via the phospho-tyrosine binding (PTB) domain, resulting in their activation by tyrosine phosphorylation (31, 32). Additionally, most of the IRS proteins contain a N-terminal pleckstrin homology (PH) domain, allowing the localization of the IR and its downstream targets to the membrane by interactions with inositol phosphates in the cell membrane (33, 34). After activation and localization to the membrane, the IRS proteins serve as docking platforms for proteins containing a rous sarcoma virus (Src)-homology 2 (SH2) domain. Different signaling molecules, such as growth factor receptor-bound-2 protein (Grb2), the protein tyrosine phosphatase 2 (Shp2) and the regulatory subunit p85 of phosphatidylinositol 3 kinase (PI3K), contain a SH2 domain and interact with IRS proteins (35-38).
Whereas Grb2 subsequently mediates activation of the mitogen activated
protein kinase (MAPK) pathway, responsible for regulating cell growth and
mitosis (39), PI3K activation mediates the majority of insulin’s effects on
Introduction
____________________________________________________________________________________________________________________________
glucose and lipid metabolism (40-42). The PI3K primarily catalyzes the phosphorylation of phosphatidylinositol (4,5) bisphophate (PIP
2) to phosphatidylinositol (3,4,5) trisphosphate (PIP
3). PIP
3in turn translocates the protein kinase B (PKB, also known as AKT), co-localized with the phosphoinositide-dependent protein kinase 1 (PDK1), to the cell membrane and leading to the activation of AKT (43, 44). AKT then regulates the activation of downstream targets (45).
Fig. 2: Insulin signal transduction
Binding of insulin to the insulin receptor results in a conformational change of the receptor and autophosphorylation of the intracellular β-subunits. This leads to recruitment and activation of IRS proteins, which in turn serve as docking platforms for other SH2 domain containing proteins, e.g. Grb2 or PI3K. Activation of these proteins subsequently drives further downstream signaling pathways, such as MAPK or AKT, responsible for growth and glucose homeostasis.
Resistance to the metabolic effects of insulin represents one of the major
consequences of excessive weight gain and obesity. It is characterized by a
reduced ability of insulin to activate its downstream signaling cascade, thus
leading to disturbed glucose clearance from the blood.
Introduction
____________________________________________________________________________________________________________________________
1.2.3 The role of hepatic gluconeogenesis in glucose homeostasis
One of the most strictly controlled processes in energy homeostasis is the maintainance of steady blood glucose levels. In response to a high blood glucose concentration, insulin is released and promotes hepatic glucose storage in form of glycogen. Conversely, if blood glucose levels drop, catabolic pathways promote the breakdown of glycogen to glucose and its subsequent release into the bloodstream. Since the generation of glucose from glycogen is rather short-lived, long-term energy supply, e.g. during long fasting periods, is highly dependent on hepatic gluconeogenesis (46-48).
Therefore, hepatic gluconeogenesis is of central importance to maintain constant blood glucose levels (49). Notably, obesity-associated insulin resistance and subsequent hyperglycemia is thought to arise, at least partially, from a deregulation of hepatic glucose production due to the reduced ability of insulin to inhibit gluconeogenesis (50-53).
During gluconeogenesis, glucose is generated from non-carbohydrate substrates in a cascade of enzymatic reactions. Rate-limiting enzymes, such as glucose-6-phosphatase (G6Pase) and phosphoenolpyruvate carboxykinase (PEPCK), control important nodes of this pathway and therefore can adjust its activity in response to hormonal stimuli, e.g. insulin or glucagon (Fig. 3) (54, 55).
Fig. 3: The role of G6Pase and GK in the regulation of glucose homeostasis
Insulin is released in response to high blood glucose level, which stimulates glucose uptake in peripheral tissues. There, glucokinase catalyzes the phosphorylation of glucose into G6P, which is used for glycogenesis or glycolysis. On the other hand, gluconeogenesis generates glucose from non-carbohydrate substrates by synthesis of G6P. As a rate-limiting enzyme, G6Pase is required for the convertion of glucose-6-phosphate into glucose, which is
then released into the bloodstream.
Introduction
____________________________________________________________________________________________________________________________
G6Pase is required for the conversion of glucose-6-phosphate (G6P) into glucose, and its inactivation or inhibition leads to poor fasting tolerance, accumulation of glycogen in the liver and ultimately to metabolic disorders (56). In contrast, the insulin-regulated glucokinase (GK) acts antagonistically to G6Pase by catalyzing the phosphorylation of glucose to produce G6P, thus preventing glucose to be released from the cell (Fig. 3) (57-59). After phosphorylation to G6P, glucose is able to enter the glycolysis or glycogenesis.
In summary, hepatic glucose output is regulated by the rates of hepatic glucose production (HGP) and hepatic glucose utilization. Thus, glycogenolysis, gluconeogenesis, and glucose cycling between glucose and G6P are important mechanisms in regulating glucose homeostasis.
1.3 Obesity-associated inflammation and insulin resistance
The concept of chronic, low level inflammation in response to obesity was first shown by markedly increased expression of the pro-inflammatory cytokine tumor necrosis factor α (TNF- α ) in adipose tissue of obese rodents.
Administration of a recombinant soluble TNF-α receptor (TNFR)
immunoglobulin neutralized TNF- α in these rodents and ameliorates insulin
sensitivity (60). Thus, the first link between an increase in pro-inflammatory
cytokines and insulin resistance was established. Follow-up studies confirmed
this observation in humans, where adipose tissue also increasingly expressed
TNF- α upon obesity, which was decreased after weight loss, together with a
restoration of insulin sensitivity (61-64). Additional work demonstrated that
obesity is associated with a state of chronic, low-grade inflammation not only
locally in adipose tissue, but also systemically, indicated by elevated plasma
concentrations of other inflammation-associated factors despite TNF-α, such
as interleukin-6 (IL-6) and interleukin-10 (IL-10) (65-68). During the
development of obesity, immune cells, e.g. macrophages, infiltrate tissues,
such as white adipose tissue (WAT) and lead to increased secretion of TNF- α
Introduction
____________________________________________________________________________________________________________________________
and IL-6 (69, 70). Furthermore, chronic inflammation in WAT, liver and skeletal muscle plays a crucial role in the development of obesity-induced insulin resistance (69, 71, 72). In the liver, Kupffer cells (KC) represent the population of resident macrophages, which are derived from circulating monocytes and line the sinusoid walls of the liver (73, 74). They are thought to be the main source of hepatic TNF-α, although other local types of cells are also able to produce this pro-inflammatory cytokine.
1.3.1 IL-6 and insulin resistance
IL-6 is a pleiotropic cytokine that not only affects the immune system, but also drives many physiological events in various tissues. Binding of IL-6 to its receptor complex, comprising of IL-6Rα and gp130, leads to the phosphorylation of the Janus kinase (JAK) and subsequent phosphorylation of the receptor complex. This phosphorylation interacts with proteins harbouring a SH2 domain. Signal transducer and activator of transcription (STAT) and tyrosine-protein phosphatase non-receptor type 11 (SHP-2) contain SH2 domains and are capable of binding to the receptors, resulting in the phosphorylation of specific tyrosine residues by JAK. Activated STATs form dimers and activate transcription of their target genes, such as suppressor of cytokine signaling 3 (SOCS-3) (75). An alternative IL-6 signaling branch results in the phosphorylation of SHP-2 that leads to rat sarcoma (ras)-mediated activation of mitogen-activated protein kinase (MAPK) signaling (Fig. 4) (76).
Currently, the function of IL-6 as mediator of obesity-induced insulin
resistance is controversially discussed (77). Due to the observation that IL-6,
along with the pro-inflammatory cytokine TNF- α , is often elevated in serum
during obesity or in patients with metabolic diseases, it has been suggested
that IL-6 signaling promotes insulin resistance (78, 79). Consistently, IL-6
treatment induces cellular insulin resistance in hepatocytes and injection of
IL-6 triggers expression of suppressor of cytokine signaling 3 (SOCS-3),
Introduction
____________________________________________________________________________________________________________________________
which can potentially inhibit insulin action (80, 81). Moreover, IL-6 infusion during euglycemic-hyperinsulinemic clamp studies markedly blunts insulin response, reflected by a lower glucose infusion rate, indicating that IL-6 indeed causes insulin resistance (82).
Fig. 4: IL-6 signaling cascade
Binding of IL-6 to its receptor complex, comprising of IL-6Rα and gp130, leads to the phosphorylation of JAK and subsequent phosphorylation of the receptor complex.
Recruitment of STAT-3 or SHP-2 to the receptor leads to their activation by phosphorylation through JAK. Active STAT-3 forms dimers, whereas SHP-2 leads first to the activation of ERK, which in turn dimerize. These dimers then translocate into the nucleus and activate the transcription of target genes.
Whereas these studies suggest a harmful role of IL-6 action in the development of obesity-associated insulin resistance, other reports could demonstrate a positive effect of IL-6 on glucose metabolism. Acute treatment with IL-6 increases insulin-stimulated glucose disposal rate in healthy humans, without affecting endogenous glucose production, by an AMP-dependent kinase (AMPK) mediated mechanism (83). Additional findings reveal that IL-6 injection increases systemic insulin sensitivity and improves glucose tolerance (84). A connection between insulin action in the central nervous system (CNS) and hepatic IL-6 release was also shown.
Following activation of signal transducer and activator of transcription
(STAT-3) in hepatocytes (Fig. 4) leads to inhibition of G6Pase and PEPCK
expression (85).
Introduction
____________________________________________________________________________________________________________________________
1.3.2 TNF- α and insulin resistance
The role of TNF-α in developing obesity-associated insulin resistance is object of many observations and an increased expression of TNF- α in skeletal muscle from insulin-resistant humans has also been noted (86). Additionally, prolonged infusion of TNF- α impairs insulin-mediated glucose disposal and insulin-stimulated suppression of total hepatic glucose output, whereas HGP and glucose utilization were elevated (87).
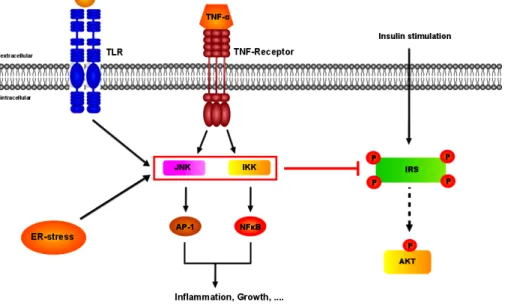
Fig. 5: Potential mechanisms for the inhibition of insulin signal transduction
Activation of cell surface receptors, which induce serine kinases, such as c-Jun N-terminal kinase (JNK) and inhibitor of NF-κB kinase (IKK) complex, mediate inhibitory serine (S307) phosphorylation events on insulin receptor substrates (IRS) and thereby blocking insulin action. Furthermore, endoplasmatic reticulum (ER) stress and intermediates of fatty acid metabolism may activate stress kinases.
It was also shown that inhibition of TNF-α improves hepatic and peripheral
insulin sensitivity in vivo (88). Finally, activation of TNF-α downstream kinases
(Fig. 5), such as inhibitor of nuclear factor κ B (NF- κ B) kinases (IKK) and
c-Jun amino-terminal kinases (JNK), reveal impaired insulin signal
transduction in peripheral tissues (71, 89-91).
Introduction
____________________________________________________________________________________________________________________________
1.4 Cancer and hepatocellular carcinoma (HCC)
Cancer is a generic term for a large group of diseases that can occur in alomost all parts of the body. It is characterized by an uncontrolled cell growth that leads to tumor formation and invasion of these cells into nearby tissues (92). The surrounding tissue is often destroyed by the cancer growth and invasion. Influenced by an increasing and aging population, the World Health Organization (WHO) estimates that the global cancer-related mortality rate will increase from 7.9 million (2007) to 11.5 million (2030) incidents per year. The WHO also suggests that the majority of all cancer cases occurs in low- and middle-income countries, such as Asia and South America. Nevertheless, in most industrialized countries, cancer is the second most frequent cause of death after cardiovascular diseases (93).
Hepatocellular carcinoma (HCC) represents approximately 85%-90% of primary liver cancers (94), with an average mortality of 95% within 5 years.
Since it often remains unnoticed in the early stages, HCC is usually advanced when the patients exhibit clinical symptoms. Due to this fact, it represents the third largest cause of cancer deaths worldwide, particularly in Africa and Eastern Asia (Fig. 6). However, the incidence of HCC in Western countries cannot be ignored, as it is rising constantly (95).
Fig. 6: Cancer distibution and HCC incidence rates worldwide in 2011
(A) Worldwide distribution of different cancer forms of both genders in percentage of total cancer numbers from 2011. (B) Distribution of HCC incidence in 2011 (ASR per 100000).
Data from (A) and (B) are documented by the WHO globocan project.
Introduction
____________________________________________________________________________________________________________________________
A variety of genetic predispositions, such as mutations in tumor suppressor genes, are linked to HCC, as well as cirrhosis which is caused by chronic hepatitis infections, alcohol abuse or metabolic disorders, e.g. due to obesity (96-102). Strikingly, male individuals have a 4 times higher risk to develop liver cancer than women.
1.5 Linking inflammatory processes to HCC
The observation that leukocytes are highly abundant in neoplastic tissue was the first indicator for a connection between inflammation and cancer (103).
Over the last decades, several reports raised the hypothesis of inflammation-mediated oncogenesis (104). HCC represents a classic case of inflammation-associated cancer, since it is promoted by chronic hepatic inflammation due to hepatic injury (105, 106). A response mechanism to this chronic inflammation is the compensatory proliferation of hepatocytes, which may ultimately lead to HCC (107).
1.5.1 Toll-like receptor (TLR) signaling in liver damage and HCC
The toll-like receptor (TLR) signaling pathway represents a classic signaling
cascade in innate immune cells and its activation is thought to be linked to the
development of HCC as result of chronic liver diseases (108). Exogenous
ligands, such as microbial components, known as pathogen-associated
molecular patterns (PAMPS), specifically activate their corresponding TLR
(Fig. 7) (109). Furthermore, endogenous TLR ligands, so called
damage-associated molecular patterns (DAMPS), are able to trigger TLR
signaling (110). The majority of these ligands, such as high mobility group box
1 (HMGB1), heat shock proteins and free fatty acids, are predominantly
released from dying cells (111-113).
Introduction
____________________________________________________________________________________________________________________________
Fig. 7: Toll-like receptors and their PAMP ligands
The family of mammalian TLRs, their microbial component ligands and the used adaptor proteins for activation and proper signal transduction.
TLRs are highly dependent on specific adapter molecules and kinases, such as myeloid differentiation primary response gene 88 (MyD88), TIR domain- containing adapter protein (TIRAP), TIR domain-containing adapter inducing interferon-β (TRIF) and TIR domain-containing adapter protein (TRAM) (Fig. 7) (114-116). These adaptor molecules activate downstream targets upon binding of DAMPS or PAMPS to their corresponding TLRs, which ultimately triggers the transcription of cytokines or chemokines, among others (117).
Mice deficient in MyD88 are highly resistant to chemically induced HCC (e.g.
by administration of diethylnitrosamine (DEN)), indicating a strong connection between TLR signaling and hepatocarcinogenesis (118). Presumably, DEN induces cell death in hepatocytes, which in turn activates KCs via TLRs and induces expression of pro-inflammatory cytokines, eventually enhancing the development of HCC (119). Although KCs are the initial cells responding to PAMPS in the liver, recent studies provide evidence for an active TLR signaling cascade in hepatic nonimmune cells, e.g. hepatocytes (120, 121).
However, MyD88 deficient cells are still able to activate JNK and NF- κ B in
Introduction
____________________________________________________________________________________________________________________________
response to the TLR-4 ligand lipopolysaccharide (LPS), indicating signal activation in a MyD88 independent manner (Fig. 8) (122).
1.5.2 MyD88 dependent TLR signaling
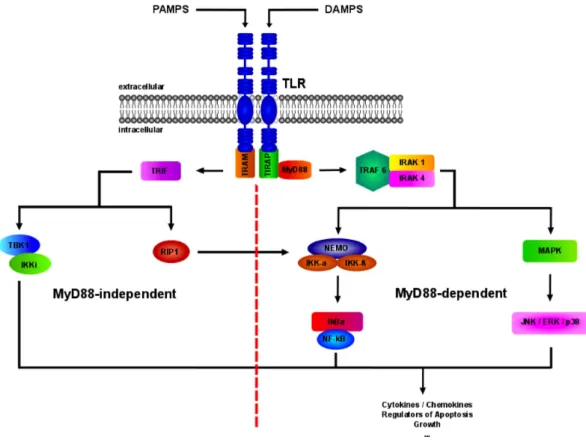
MyD88 is a central adaptor protein, used by almost all TLRs for intracellular signaling (Fig. 7). Upon activation of TLRs by specific stimuli, toll/interleukin-1 receptor (TIR) domain containing adaptors, such as MyD88 and TIR domain-containing adapter protein (TIRAP), interact with the TIR domain of TLRs. This association recruits members of the interleukin-1 receptor-associated kinase (IRAK) family, followed by their phosphorylation and dissociation from MyD88. Active IRAKs then associtate with tumor necrosis factor receptor-associated factor 6 (TRAF6), leading to the activation of two distinct signaling pathways and finally to the activation of JNK and NF- κ B (Fig. 8) (117).
Fig. 8: Toll-like receptor signaling cascade
The intracellular TLR-signaling cascade in a MyD88 dependent (right) and independent (left)
Introduction
____________________________________________________________________________________________________________________________
1.5.3 MAPK signaling and HCC
The mammalian family of mitogen-activated protein kinases (MAPKs) consists of extracellular signal-regulated kinase (ERK), p38, and JNK, and each of these exists in several isoforms. For intact MAPK signaling, the induction of at least three kinases is necessary to establish the sequential activation pathway, the MAPK kinase kinase (MKKK), MAPK kinase (MKK), and MAPK itself. Generally, these signaling components are expressed in all cell types and transduce signaling upon stimulation with cytokines, growth factors and stress signals (123). Moreover, the MAPK signaling pathways are often deregulated in various types of cancers, including HCC (124).
ERK1 and ERK2 are highly homologous and display overlapping regulatory mechanisms (125). They are activated by a wide variety of receptors, particularly receptor tyrosine kinases. Alterations of the ERK pathway are contributed to the development of HCC, especially elevated levels of active ERK were observed in hepatocellular carcinomas (126).
The p38 subfamily consists of four different isoforms (p38 α , p38 β , p38 γ and p38σ) and their activation is mediated by the upstream kinases MKK3, MKK4, and MKK6 (127-131). Published studies about p38 MAPK mostly refer to p38 α , which is involved in inflammation induced apoptosis as well as various types of stresses (132-134). An important role in suppression of HCC tumorgenesis has also been demonstrated. Mice lacking hepatic p38 α exhibit enhanced HCC development, triggered by accumulation of reactive oxygen species (ROS), which leads to enhanced liver injury (135).
JNK proteins are encoded by three genes: JNK1, JNK2 and JNK3. JNK1 and
JNK2 are ubiquitously expressed, whereas JNK3 is mainly found in brain,
heart and testis (136, 137). Their regulation is mediated by the upstream
MAPK kinases, MKK4 and MKK7, which are activated upon stimulation with
stress signals and pro-inflammatory stimuli (138, 139). During HCC
development, the JNK pathway was assigned a pro-oncogenic role. Increased
Introduction
____________________________________________________________________________________________________________________________
JNK1 activity was observed in human HCC and mice lacking JNK1 exhibit reduced liver carcinogenesis (140, 141). Additionally, the downstream target c-Jun promotes chemically induced liver cancer through suppression of the p53 pathway (142).
1.5.4 NF- κ B signaling and HCC
The mammalian family of NF- κ B transcription factors consists of five members (RelA, RelB, c-Rel, NF-κB1, and NF-κB2), which are assembled by dimerization (143). Among the inflammatory signaling pathways that are associated with cancer development, the transcription factor NF- κ B is of central importance in the promotion of tumor development (144), since it is involved in the regulation of immune responses, inflammation and cell survival (145). Various pro-inflammatory stimuli are able to activate NF- κ B, mainly via activation of IKK. IKK in turn phosphorylates IκB proteins, which keep NF-κB in an inactive state, leading to the degradation of I κ B (146). The most prominent I κ B protein is I κ B α . Since NF- κ B is a major activator of anti-apoptotic gene expression, it is thought to play a key role in tumorgenesis (147, 148). Evidence for the involvement in mouse carcinogenesis in vivo was shown by the promotion of inflammation-induced cancer by NF-κB (149-151).
In contrast, other published studies showed that inactivation of hepatic NF- κ B
increases HCC incidence, indicating a suppressive role in tumor development
(152, 153).
Introduction
____________________________________________________________________________________________________________________________
1.6 Objectives
Obesity-associated insulin resistance as well as hepatocellular carcinoma are steadily increasing diseases worldwide and both are somehow related with inflammation. Additionally, epidemiological studies have shown that obesity is a risk factor for hepatocellular carcinoma, indicating related mechanisms in the development of both diseases. Understanding the underlying mechanisms involved in the development of obesity and hepatocellular carcinoma is a first step to find therapeutical approaches to treat this diseases. The liver, affected in both, is known to play a key role and is subject of many studies. The aim of this study was to analyse inflammatory pathways in the development of obesity-associated insulin resistance and chemically induced hepatocellular carcinoma in vivo. Therefore, mice with conditional disruption of either the IL-6Rα or the TLR adaptor protein MyD88 in hepatocytes were generated.
Mice lacking hepatic IL-6 signaling served for the analysis of energy
homeostasis, glucose metabolism and insulin signaling. For the analysis of
hepatic inflammatory processes in the development of chemically induced
hepatocellular carcinoma, mice lacking MyD88 in the liver were used.
Materials and Methods
____________________________________________________________________________________________________________________________
2. Materials and Methods:
2.1 Chemicals and enzymes
Size markers for agarose gel electrophoresis (Gene Ruler DNA ladder mix) and for SDS-PAGE (Prestained protein ladder Mix) were got from Fermentas (St. Leon-Rot, Germany). For polymerase chain reactions, RedTaq polymerase (Sigma-Aldrich, Seelze, Germany) or DreamTaq (Fermentas, St.
Leon-Rot, Germany) were used. Chemicals and enzymes used in this work are listed in table 1 and 2, respectively. All solutions were prepared with double distilled water.
Table 1: Chemicals
Chemical Distributor
α[32P]-dCTPs Amersham, Freiburg, Germany
β-Mercaptoethanol (β-ME) AppliChem, Darmstadt, Germany
γ[32P]-dATP Amersham, Freiburg, Germany
ε-Aminocaproic acid Sigma-Aldrich, Seelze, Germany 0.9% Saline (sterile) Delta Select, Pfullingen, Germany 2,2,2-Tribromoethanol (Avertin®) Sigma-Aldrich, Seelze, Germany 2-Deoxy-D-[1-14C]-Glucose Amersham, Freiburg, Germany
Acetic acid Merck, Darmstadt, Germany
Acrylamide Roth, Karlsruhe, Germany
Agarose Peqlab, Erlangen, Germany
Ammonium acetate Merck, Darmstadt, Germany
Ammoniumpersulfat (APS) Sigma-Aldrich, Seelze, Germany
Aprotinin Sigma-Aldrich, Seelze, Germany
Materials and Methods
____________________________________________________________________________________________________________________________
Biotin Bode Chemie, Hamburg, Germany
Complex-Vectastain Elite Fluka, Sigma-Aldrich, Seelze, Germany
Bacillol® Sigma-Aldrich, Seelze, Germany
Barium hydroxide (Ba(OH)2) Sigma-Aldrich, Seelze, Germany
Benzamidine Merck, Darmstadt, Germany
Bovine serum albumin (BSA) Merck, Darmstadt, Germany
Bradford reagent Bio-Rad, München, Germany
Bromphenol blue Merck, Darmstadt, Germany
Calcium chloride (CaCl2) AppliChem, Darmstadt, Germany
Chloroform Sigma-Aldrich, Seelze, Germany
Count offTM NEN® Research Products, Boston, USA
D-[3-3H]-Glucose Amersham, Freiburg, Germany
Desoxy-ribonucleotid-triphosphates (dNTPs) Amersham, Freiburg, Germany
Dextrane sulfate Sigma-Aldrich, Seelze, Germany
Dimethylsulfoxide (DMSO) Merck, Darmstadt, Germany Di-sodiumhydrogenphosphate Merck, Darmstadt, Germany
Dithiothreitol (DTT) Boehringer, Mannheim, Germany
Enhanced chemiluminescence (ECL) Kit Perbio Science, Bonn, Germany
Ethanol, absolute AppliChem, Darmstadt, Germany
Ethidium bromide Sigma-Aldrich, Seelze, Germany
Ethylendiamine tetraacetate (EDTA) AppliChem, Darmstadt, Germany Fetal calf serum (FCS) Gibco BRL, Eggenstein, Germany Forene® (isoflurane) Abbot GmbH, Wiesbaden, Germany
Glucose (20%) DeltaSelect, Pfullingen, Germany
Materials and Methods
____________________________________________________________________________________________________________________________
Glutamine Invitrogen, Karlsruhe, Germany
Glycerol Serva, Heidelberg, Germany
Glycine Applichem, Darmstadt, Germany
HEPES Applichem, Darmstadt, Germany
Hydrochloric acid (37%) (HCl) KMF Laborchemie, Lohmar, Germany
Hydrogen peroxide Sigma-Aldrich, Seelze, Germany
Insulin Novo Nordisk, Bagsværd, Denmark
Isopropanol (2-propanol) Roth, Karlsruhe, Germany
Magnesium chloride Merck, Darmstadt, Germany
Methanol Roth, Karlsruhe, Germany
N-Nitrosodiethylamine (DEN) Sigma-Aldrich, Seelze, Germany
Nitrogen (liquid) Linde, Pullach, Germany
NP-40 Merck, Darmstadt, Germany
Octenisept® Schülke & Mayr, Norderstedt, Germany Paraformaldehyde (PFA) Fluka, Sigma-Aldrich, Seelze, Germany Penicillin/Streptomycin solution Gibco BRL, Eggenstein, Germany Phenol-chloroform-isoamyl alcohol AppliChem, Darmstadt, Germany Phenylmethylsulfonylfluoride (PMSF) Sigma-Aldrich, Seelze,
Phosphate buffered saline (PBS) Germany Gibco BRL, Eggenstein, Germany
Poly (dI-dC) Amersham Pharmacia Biotec, Uppsala,
Sweden
Potassium chloride Merck, Darmstadt, Germany
Potassium hydroxide Merck, Darmstadt, Germany
Protease inhibitor cocktail Roche, Mannheim, Germany
RPMI 1640 medium Gibco BRL, Eggenstein, Germany
Materials and Methods
____________________________________________________________________________________________________________________________
Ready SafeTM, liquid scintillation cocktail Beckman Coulter, Fullerton, USA
Sodium acetate AppliChem, Darmstadt, Germany
Sodium chloride (NaCl) AppliChem, Darmstadt, Germany
Sodium citrate Merck, Darmstadt, Germany
Sodium dodecyl sulfate (SDS) AppliChem, Darmstadt, Germany
Sodium fluoride (NaF) Merck, Darmstadt, Germany
Sodium heparin (Liquemin®) Roche, Grenzach-Wyhlen, Switzerland Sodium hydroxide (NaOH) AppliChem, Darmstadt, Germany Sodium orthovanadate Sigma-Aldrich, Seelze, Germany Tetramethylethylenediamine (TEMED) Sigma-Aldrich, Seelze, Germany Tissue freezing medium Jung, Heidelberg, Germany Tramadolhydrochlorid (Tramal®) Grünenthal, Aachen, Germany
TriFast™ Peqlab, Erlangen, Germany
Trishydroxymethylaminomethane (Tris) AppliChem, Darmstadt, Germany
Triton X-100 Applichem, Darmstadt, Germany
Tween 20 Applichem, Darmstadt, Germany
Vectashield® mountin medium with DAPI Applichem, Darmstadt, Germany Western blocking reagent Vector, Burlingame, USA
Xylene cyanol Sigma-Aldrich, Seelze, Germany
Zinc sulfate (ZnSO4) Roche, Mannheim, Germany
Materials and Methods
____________________________________________________________________________________________________________________________
Table 2: Enzymes
Enzyme Distributor
BglI NEB, Schwalbach, Germany
DNase, RNase-free Promega, Madison, WI, USA
EuroScript reverse transcriptase Eurogentec, Seraing, Belgium
Proteinase K Roche, Mannheim, Germany
RNAseI Fermentas, St. Leon-Rot, Germany
T4 polynucleotide kinase NEB, Schwalbach, Germany
2.2 Mouse experiments
General animal handling was performed as described by Hogan (154) and Silver (155).
2.2.1 Animal care
Care and procedures of all animals was approved by local government authorities (Bezirksregierung Köln, Cologne, Germany) and reviewed by the animal care committee of the University of Cologne in accordance with National Institutes of Health guidelines. Animals were kept in groups of 3 to 5 animals (depending on weight) or individually (depending on the experiment).
Mice were housed at 22°C – 24°C using a 12 h light / 12 h dark cycle with
lights on at 7 AM. Animals were fed regular chow food (NCD; Teklad Global
Rodent 2018; Harlan) containing 53.5% carbohydrates, 18.5% protein, and
5.5% fat (12% of calories from fat) and had ad libitum access to water at all
times. Food was only withdrawn if required for an experiment. Mice were
sacrificed at the end of the study period by lethal CO
2anaesthesia, the
relevant organs were dissected, snap-frozen and stored at -80°C until further
Materials and Methods
____________________________________________________________________________________________________________________________
2.2.2 Generation of IL-6R α
L-KOand MyD88
L-KOmice
For the generation of IL-6Rα
L-KOand MyD88
L-KOmice, albumin promotor/ α -fetoprotein enhancer (ALFP)-Cre
+/-mice were mated with either MyD88
FL/FLor IL-6R α
FL/FLmice (generated and kindly provided by PD Dr. F.
Thomas Wunderlich from the laboratory of Prof. Dr. Jens C. Brüning in the Institute for Genetics, University of Cologne, Germany) and double heterozygous mice were further intercrossed to yield hepatocyte specific IL-6Rα or MyD88 knockout mice (IL-6Rα
L-KOand MyD88
L-KO).
The breeding colonies were maintained by mating either MyD88
FL/FLor IL-6R α
FL/FLmice with ALFP-Cre
+/-MyD88
FL/FLor ALFP-Cre
+/-IL-6R α
FL/FLmice, respectively. All mice had been backcrossed for 10 generations on a C57BL/6 background before used for experiments and the background was unchanged throughout all experiments. Littermates were used for analysis at all times and were genotyped by PCR using genomic DNA isolated from tail tips.
2.2.3 Body weight and body composition
Body weight was measured once a week and body composition was measured in vivo by nuclear magnetic resonance using the minispec mq 7.5 (Bruker Optik, Ettlingen, Germany) at the end of the study period.
2.2.4 Collection of blood samples and determination of blood glucose levels
The collection of blood samples was performed according to guidelines (154,
155) in the morning to avoid variations by the circadian rhythm. The blood
cells and platelets were separated from serum by centrifugation of the blood
samples for 30 min at 4°C. The obtained serum was stored at -20°C.
Materials and Methods
____________________________________________________________________________________________________________________________
The determination of blood glucose levels was performed from whole venous blood using an automatic glucose monitor (GlucoMen® GlycÓ; A. Menarini Diagnostics).
2.2.5 Glucose and insulin tolerance test
Glucose tolerance tests (GTT) were performed on animals after a fasting period of 16 h over night. Insulin tolerance tests (ITT) were performed on random fed mice. The animals received an i.p. injection of either 2 g/kg body weight of glucose or 0.75 U/kg body weight of human regular insulin, respectively. Glucose levels were determined in blood collected from the tail tip immediately before and 15, 30 and 60 min after the injection of insulin, with an additional measurement after 120 min for the GTT.
2.2.6 Indirect calorimetry, locomoter activity and daily food intake
The measurements for indirect calorimetry, locomoter activity and daily food intake over 48 h were performed in 7.1-l chambers of the PhenoMaster System (TSE systems, Bad Homburg, Germany) at room temperature (22 - 24°C). For the adaptation, the mice were placed in the chambers for 48 h before the experiment. The food and water were provided ad libitum in appropriate devices and daily food intake was measured through the PhenoMaster System as well as VO
2and VCO
2by indirect calorimetry. To monitor the locomotor activity, an infrared light-beam frame was used.
Materials and Methods
____________________________________________________________________________________________________________________________
2.2.7 Euglycemic-hyperinsulinemic clamp studies (EHCS)
2.2.7.1 Implantation of the catheter
Male mice at the age of 10 weeks were anesthetized by an intraperetoneal injection of 240 mg/kg avertin and adequacy of the anesthesia was ensured by the loss of pedal reflexes. After the loss of pedal reflexes, a Micro-Renathane catheter (Micro-Renathane, MRE 025; Braintree Scientific Inc., Braintree, Massachusetts, USA) was inserted into the right internal jugular vein and advanced to the level of the superior vena cava. After the irrigation with 0.9% saline solution, the catheter was filled with heparin solution, sealed at its distal end and left in a subcutaneous pocket at the back of the neck. The cutaneous incisions were closed with a 4-0 silk suture and the free end of the catheter was attached to the suture in the neck in such a fashion as to allow the retrieval of the catheter on the day of the experiment.
After the implantation of the catheter the mice received an intraperitoneal injection of 1 ml saline solution (0.9%) containing 15 µg/g body weight of tramadol and were placed on a heating pad in order to facilitate recovery.
2.2.7.2 Radioactive EHCS procedure
After 6 days of recovery, only mice that had lost less than 10% of their preoperative weight were studied and included in the experimental groups.
Each animal was fasted for 16 h and placed into restrainers for the whole
duration of the clamp experiment. After an infusion of a 5 µCi D-[3-
3H] glucose
tracer bolus solution at the beginning of the experiment, a tracer solution
(0.05 µCi/min) was infused continuously for the whole experiment. At the end
of the basal period (40 min), a blood sample (60 µl) was collected to
determine the basal parameters and a 40 µU/g insulin bolus solution was
infused, followed by the infusion of a 4 µU/g/min insulin solution containing
0.1% BSA at a fixed rate. To minimize blood loss, red blood cells were
Materials and Methods
____________________________________________________________________________________________________________________________