• Keine Ergebnisse gefunden

This study illuminates the role of client-vendor communication in relation to project

N/A
N/A
Protected

Academic year: 2021

Aktie "This study illuminates the role of client-vendor communication in relation to project "

Copied!
40
0
0

Wird geladen.... (Jetzt Volltext ansehen)

Volltext

(1)

I NFLUENCE OF C OMMUNICATION ON C LIENT S ATISFACTION IN

I NFORMATION S YSTEM P ROJECTS – A Q UANTITATIVE F IELD S TUDY

A BSTRACT

This study illuminates the role of client-vendor communication in relation to project

performance and client satisfaction in information system projects. Results from a field study with managers on the client side suggest that both process and product performance positively influence the confirmation of expectations. However, process expectations do not – which might be due to the normality of budget and schedule overruns – whereas communication wields an important influence on client satisfaction. Future research should address the contribution of different communication mediums and contrast agile and non-agile projects.

K EYWORDS

Information systems, project success, expectation-confirmation theory, client-vendor

communication, quantitative field study.

(2)

I NTRODUCTION

The unsettled question of how to assess IS project success is reflected in research and might require new theory (Barclay & Osei-Bryson, 2009; Cuellar, 2010; Glass, 1999). In general, a holistic IS project success measurement has to encompass the development process as well as the developed product (Saarinen & Sääksjärvi, 1992; Thomas & Fernández, 2008;

Wateridge, 1998). As such, it is important to know whether to prioritize the process (i.e., budget and schedule) or the product (i.e., requirements).

Despite calls for an extended set of criteria (Ika, 2009; Jugdev & Müller, 2005),

companies continue to assess success of IS projects in terms of adherence to planning (ATP), that is, adherence to budget, adherence to schedule, and conformance with requirements (Collins & Baccarini, 2004; Joosten, Basten, & Mellis, 2014; Thomas & Fernández, 2008), thereby neglecting the relevance of the clients contracting such projects (Anderson, Fornell, &

Lehmann, 1994; Anderson & Sullivan, 1993; Nelson, 2005). The ATP approach as a rather objective assessment is opposed to assessing success in terms of stakeholder satisfaction, which is substantiated by projects that are perceived as failures despite satisfying the ATP criteria and vice versa (Anderson et al., 1994; Anderson & Sullivan, 1993; Nelson, 2005).

Considering success to be a matter of perception is in accordance with the hermeneutical view of Myers (1995). As client satisfaction is crucial for vendor’s reputation and decisions about follow-up projects (Anderson et al., 1994; Anderson & Sullivan, 1993), we suggest the client to be the most important stakeholder and, accordingly, client satisfaction to be the uppermost success criterion.

To differentiate between these two types of success – ATP and perceived success – we

now denote the former as project performance and the latter as client satisfaction. While

project performance refers to the overall, aggregated performance regarding the project, we

differentiate further between product performance (i.e., the performance regarding the final

(3)

product), and process performance (i.e., the performance regarding the process of creating the final product).

In this context, Expectation-Confirmation Theory (ECT) is an adequate means for a theoretical explanation of satisfaction (Bhattacherjee, 2001). According to the ECT, satisfaction depends on confirmation (or disconfirmation in case of dissatisfaction) of

expectations towards the outcome compared to the actual outcome as perceived subjectively.

In IS projects, this corresponds to client satisfaction with the project, depending on the degree to which initial expectations are confirmed by final performance perceptions.

Understanding and managing expectations is supposed to be an important management objective (Mintzberg, 1971; Parasuraman, Berry, & Zeithaml, 1991). Since we assume client satisfaction to depend on the confirmation of expectations, the vendor should manage client expectations. For managing client expectations, communication needs to be designed in a way that ensures that the client is well informed about the project state at any time during the project. To keep the client well informed, qualified and regular client-vendor communication (CVC) has been suggested as suitable means (Pankratz & Loebbecke, 2011). In line with research calling for an explicit analysis of the linkage between success factors (i.e., the perceived quality of CVC) and success criteria (Siau, Long, & Ling, 2010), we state our research questions (RQs) as follows:

RQ1: To which extent does ECT explain client satisfaction in IS projects?

RQ2: To which extent does CVC influence project performance and satisfaction in IS projects?

We answer these RQs by developing a research model based on ECT, which we test with data from a field study from the client perspective. Our findings indicate that

expectations towards the process are not relevant for client satisfaction. Moreover, our study

confirms that both product and process performances positively influence the confirmation of

(4)

expectations. Our results thus advance theory concerning IS project success and provide helpful guidance for managers of IS projects.

This paper proceeds as follows. First, we reflect upon prior research on IS project success, ECT, and CVC. Second, we argue for our hypotheses and develop our research model. Third, we explain our research design. Fourth, we describe our data analysis and results. Fifth, we discuss our findings, followed by a short conclusion.

T HEORETICAL B ACKGROUND AND R ELATED WORK

Measuring Information System Project Success

A project is generally defined as “a temporary endeavor undertaken to create a unique product, service, or result” (Project Management Institute, 2013, p. 3). An IS can be defined as “a work system whose processes and activities are devoted to processing information, that is, capturing, transmitting, storing, retrieving, manipulating, and displaying information.

Thus, an IS is a system in which human participants and/or machines perform work (processes and activities) using information, technology, and other resources to produce informational products and/or services for internal or external customers” (Alter, 2008, p.

451). An IS includes both information technology (IT) artifacts, that is, hardware and software, and business artifacts, that is, processes, organizational structures, informational flows, etc. (Aier, Bucher, & Winter, 2011). Combining these definitions, an IS project can be seen as a project in above terms to develop, extend, or adapt an IS.

Scholars have controversially discussed the definition and measurement of IS project success for decades. Varying approaches demonstrate that there is no consensus concerning the definition and understanding of IS project success (e.g., Agarwal & Rathod, 2006; Baker, Murphy, & Fisher, 1988; Barclay & Osei-Bryson, 2009; Cuellar, 2010; Wateridge, 1998;

Yetton, Martin, Sharma, & Johnston, 2000). Ika (2009) provides a comprehensive overview

of research concerning (IS) project success over the past decades.

(5)

Measuring success and failure of IS projects as of today is traditionally often equated with adherence to budget and schedule as well as fulfillment of requirements (Ika, 2009;

Joosten et al., 2014; Pinto & Slevin, 1988; Thomas & Fernández, 2008). Nevertheless, many scholars consider this ATP approach inappropriate (Agarwal & Rathod, 2006; Baker et al., 1988) or at least insufficient (Dvir, Lipovetsky, Shenhar, & Tishler, 1998; Jugdev & Müller, 2005; Pinto & Slevin, 1988; Shenhar, Levy, & Dvir, 1997; Shenhar, Dvir, Levy, & Maltz, 2001). It is argued that this measurement approach leads to an inadequate evaluation of (IS) project success (Dvir et al., 1998; Shenhar et al., 2001). Nevertheless, ATP is in many cases the sole or main criterion used (Joosten et al., 2014; Thomas & Fernández, 2008). Reasons for using these simplified measurement methods and rules of thumb are assumed to be the lack of a clear definition of project success and the easy measurability of ATP (Pinto & Slevin, 1988).

Empirical research provides extensive evidence for projects failing to meet the traditional criteria and nevertheless being considered successful or satisfying the traditional criteria but being perceived as failures (Baker et al., 1988; Ika, 2009; Pinto & Slevin, 1988).

Nelson (2005) denotes such projects as successful failures or failed successes, respectively. In

this context, many researchers emphasize (IS) project success to be a matter of perspective

(Jugdev & Müller, 2005; Shenhar et al., 1997). Nelson (2005) equates (IS) project success to

stakeholder satisfaction. As client satisfaction is crucial for vendor’s reputation and decisions

about follow-up projects (Anderson et al., 1994; Anderson & Sullivan, 1993), we suggest

client satisfaction to be the uppermost criterion. This criterion can only be met if the client

perceives the course of a project to be frictionless, that is, without unsolved problems. We

therefore distinguish between project performance measured in terms of ATP and satisfaction

of the client organization measured in terms of client’s subjective performance perceptions.

(6)

Expectation-Confirmation Theory

A framework centering on client satisfaction is ECT, which is rooted in the theory of cognitive dissonance (Festinger, 1957). The theory of cognitive dissonance rests upon the idea that information or knowledge can be contradicting. Festinger (1957) calls these pieces of knowledge cognitions and emphasizes contradicting cognitions as inconsistent. If cognitions are not only inconsistent but also relevant to each other, they cause psychological dissonance.

The level of dissonance – or as Harmon-Jones, Harmon-Jones, and Levy (2015) label it, psychological discomfort – depends on the importance of the cognitions in question to the subject. In the context of ECT, this theory becomes relevant for understanding the evaluation of expectations and project performance as well as their influence on satisfaction as the construct of confirmation. Aronson and Carlsmith (1962) show that unmet expectations or disconfirmation of expectations lead to a higher amount of discomfort, which is similar to lower satisfaction. While they focus on expectations regarding one’s own performance rather than performance of others, subsequent research applied ECT to consumer satisfaction (Engel, Kollat, & Blackwell, 1968; Howard & Sheth, 1969; Oliver, 1980).

Bhattacherjee (2001) integrated ideas from this consumer-behavior-centric literature as well as from preceding IS research into a new model explaining continuous usage of IS.

Narrowing the field of study to IS, Bhattacherjee (2001) takes ECT to the context of IS usage.

The author states that user intention to continue using a certain IS is based on user satisfaction, which is influenced by the satisfaction of users’ a priori expectations (here:

client’s initial performance expectation of the project) and the users’ a posteriori perceived performance of the product or service (here: perceived actual performance of the project).

Figure 1 illustrates the baseline of Bhattacherjee’s model.

A recent review concerning the use of ECT in IS research reveals the diverse domains

of its application (Hossain & Quaddus, 2012). Predominantly, ECT has been applied to

explain IS user satisfaction and continuance intentions. It has been used to explain

(7)

information systems continuance in regard to habit forming (Limayem, Hirt, & Cheung, 2007), and has been further refined, for instance regarding application service provision (Susarla, Barua, & Whinston, 2003). Additionally, attitudes and beliefs were integrated (Bhattacherjee & Premkumar, 2004). ECT has also been combined with prominent research streams such as technology acceptance (Venkatesh & Goyal, 2010). In the context of information system development (ISD) projects, exemplary applications of ECT include analyzing personnel skill discrepancies (Tesch et al., 2003) and managing user expectations towards the product (Petter, 2008) as well as client expectations towards the process (Basten, Stavrou, & Pankratz, 2016).

(INSERT FIGURE 1 ABOUT HERE)

Following ECT, higher expectations have a negative influence on confirmation since they are more difficult to fulfill. A positive relation is found for project performance. The higher product or service performance is perceived, the more likely expectations are fulfilled or even exceeded and the higher the level of confirmation will be. In sum, confirmation is influenced positively if expectations are met or exceeded by project performance, and influenced negatively if the project performance is below expectations. The level of confirmation positively influences user satisfaction, with a higher level of confirmation leading to increased satisfaction and a lower level of confirmation to a lower level of satisfaction.

Client-Vendor Collaboration and Communication

For achieving sustainable competitive advantage, research has identified inter-

organizational relationships as one of the most important resources (Claycomb & Frankwick,

2010; Dyer & Singh, 1998). Successful inter-organizational relationships involve

(8)

organizations that collaborate to reach high communication quality (Claycomb & Frankwick, 2010; Mohr, Fisher, & Nevin, 1996; Nunlee, 2005). Thus, communication is seen as critical for the effectiveness of such relationships (Celuch, Bantham, & Kasouf, 2011; Claycomb &

Frankwick, 2004, 2010). Based on seminal works (Mohr et al., 1996; Mohr & Nevin, 1990), communication in this context can be defined as “the extent to which manufacturers

communicate with their suppliers on a frequent, formal, and reciprocal basis while using rationality as a means by which to influence them” (Joshi, 2009, p. 134). Such collaborative communication drives performance of business partners, is critical for strategic collaboration (Paulraj, Lado, & Chen, 2008) and establishing value-enhancing inter-organizational

relationships in the long-term perspective (Powers & Reagan, 2007), enhances the knowledge base of the business partners (Joshi, 2009), and helps resolve conflicts (Celuch et al., 2011;

Claycomb & Frankwick, 2004).

Inter-organizational communication, to which we refer as client-vendor

communication (CVC), is suggested to be particularly important in the IS industry (Hyväri, 2006; Mohr et al., 1996; Pankratz & Basten, 2013) due to the technical nature of products, technological changes, and dynamic competitive environments (Mohr et al., 1996). Close inter-organizational relationship helps foster information sharing between clients and vendors in order to both correctly reflect business needs and achieve business goals (Han, Lee, Chun,

& Seo, 2013).

An exploratory study concerning the interrelatedness of IS project success factors indicates the relevance of qualified and regular CVC for clients to be satisfied in IS projects (Pankratz & Loebbecke, 2011). In particular, the quality and temporal dimension of

communication is supposed to contribute to making projects transparent to clients, thus improving clients’ perceptions concerning IS projects. Communication as an integral part of software development, especially in IT outsourcing, helps define needs and reduces

misunderstandings (Pettit, Goris, & Vaught, 1997; Poston, Simon, & Jain, 2010; Sharma,

(9)

Apoorva, Madireddy, & Jain, 2008). Sharma et al. (2008) state that especially in IT

environments inadequate communication might increase the risk of failing and is therefore a crucial aspect of (project) management. In general, more open and supportive communication is seen as beneficial for building trust and reducing misunderstandings (Walton & McKersie, 1965). If the vendor communicates and justifies reasons for deviations from the project plan in an open and comprehensible way, the client might be satisfied with the overall project despite budget and schedule overruns. While this study focuses on the importance of the vendor keeping the client well informed, we acknowledge that communication in a client- vendor relationship is of collaborative, two-way nature.

Considering the relevance of CVC in the context of ECT, we propose that CVC has a positive influence on client satisfaction in ISD projects. This positive influence results from the role of CVC for managing client expectations towards the process and product dimensions in ISD projects.

R ESEARCH M ODEL AND H YPOTHESES

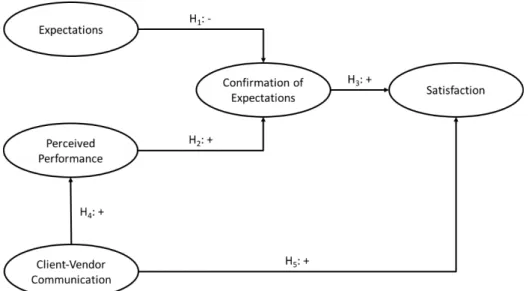
Figure 2 illustrates our hypothesized research model, which is based on the work by Bhattacherjee (2001) and extended by CVC (Lee & Kim, 1999). In the following, we argue for the respective hypotheses in the context of IS projects.

(INSERT FIGURE 2 ABOUT HERE)

Hypotheses H

1 Process

, H

1 Product

, H

2 Process

, H

2 Product

, H

3 Process,

and H

3 Product

describe ECT’s

bottom line that confirmation positively relates to satisfaction. Based on the initial model of

expectation confirmation by Bhattacherjee (2001), ECT has been used in a variety of studies

in IS research (Hossain & Quaddus, 2012). While this theoretical model has been primarily

used to explain IS user satisfaction and continuance intentions, several examples suggest

(10)

ECT’s applicability to context of managing IS projects (e.g., Petter, 2008; Tesch, Jiang, &

Klein, 2003). Accordingly, we postulate that high expectations have a negative influence on confirmation, while low expectations have a positive influence on confirmation. We also propose that if client’s performance expectations concerning the project are met or exceeded by a perceived performance of the project, satisfaction is increased, otherwise decreased.

Therefore, we postulate project performance having a positive influence on confirmation of expectations. Additionally, confirmation has a positive influence on satisfaction. The three hypotheses are specified as follows.

H

1 Process

: Process expectations are negatively associated with confirmation of these expectations.

H

1 Product

: Product expectations are negatively associated with confirmation of these expectations.

H

2 Process

: Process performance is positively associated with confirmation of client expectations.

H

2 Product

: Product performance is positively associated with confirmation of client expectations.

H

3 Process

: Confirmation of process expectations is positively associated with process satisfaction.

H

3 Product

: Confirmation of product expectations is positively associated with product satisfaction.

Although Bhattacherjee (2001) already specified influences concerning initial

performance expectations and perceived actual performance in ECT, and therefore also the

possibility of change during the usage, these influences are not further investigated in his

work. Our line of reasoning takes into account that communication might not moderate or

influence expectations but rather directly influence project performance. We assume this

relation because moderation of both – expectations during the evaluation of initial

(11)

expectations and project performance – suggests an active recalling of memories of

communication. With a direct influence of CVC on project performance, we rather suggest an influence on attitudes during the execution of the project. This means that while attitudes are formed and adjusted throughout, people do not actively and precisely recall their expectations and project performance but rather their more abstract and fuzzy attitudes towards the process or product during overall evaluation. Attitudes influence one’s decisions and other evaluative actions or responses consciously as well as unconsciously, based on cognitive, affective, and behavioral information if the evaluation is only needed on a general and abstract level, while detailed remembrance of expectations and project performance is triggered only for more specific evaluation (Eagly & Chaiken, 1993, 2007; Fennis & Stroebe, 2010; Zanna & Rempel, 1988). CVC can serve as information on all three levels: it can be cognitively processed and it can trigger affective responses as well as behavioral actions and responses. These reactions might be memorized by altering existing attitudes towards the process or product or by forming new attitudes. Sharma et al. (2008) state that especially in IT environments

inadequate communication (i.e., of low quality) might increase risk of failing and is therefore a crucial aspect of project management. Similarly, Walton and McKersie (1965) state that supportive and open communication (i.e., high quality) is beneficial for building trust and reducing misunderstandings. In general, regular and qualified CVC is seen as relevant for IS project success (Pankratz & Loebbecke, 2011). We therefore assume that high quality CVC reduces risks, leading to better performance, improved client-vendor relationship, client’s benevolence, and therefore improved project performance. Hypothesis H

4

covers this

assumption and addresses CVC’s positive influence on project performance, meaning that if the client perceives CVC positively, process and product performance are perceived

positively as well.

H

4 Process

: CVC is positively associated with process performance.

H

4 Product

: CVC is positively associated with product performance.

(12)

Furthermore, CVC might influence satisfaction directly. If communication by the vendor is perceived to be on time, trustworthy, helpful, or of positive quality in general, this might positively influence client’s overall satisfaction similarly as it influences attitudes towards the process and product. Another argument for the direct influence of CVC on satisfaction might be the fact that research sees communication as an integral part of a manager’s role or responsibility (Mintzberg, 1971). If CVC is perceived negatively, for instance, untimely or untruthful, the project performance might be lowered as well as the client’s overall satisfaction. Similarly, as Walton and McKersie (1965) state, CVC is important to build trust, which in turn influences the client’s benevolence and the client’s overall satisfaction as it improves the client-vendor relationship. Thus, our fifth hypothesis reads as follows.

H

5 Process

: CVC is positively associated with process satisfaction.

H

5 Product

: CVC is positively associated with product satisfaction.

We differentiate between two models, one for the process component (henceforth process model) and one for the product component (henceforth product model) of IS projects (e.g., Saarinen & Sääksjärvi, 1992; Wallace, Keil, & Rai, 2004). We thereby account for participants mentioning that they had nuanced perceptions regarding process and product performance.

R ESEARCH D ESIGN

Data Collection

We set our sample to contain project managers or other executives in charge of IS projects on the client’s side. We looked for participants with the following characteristics.

First, potential participants had to be working for a client in a client-vendor relationship, that

is, the organization consuming the IS. Second, participants needed to have an overview of the

project regarding the different stages of planning, development, and usage, but also regarding

(13)

budget and schedule. This implied the third characteristic. We aimed for participants who were in charge of a project. All participants were asked to recall the most recently completed project. Table 11 in Appendix C lists all positions or roles occupied by our participants.

We chose a two-fold approach for participant acquisition. First, we used the Hoppenstedt Hochschuldatenbank (http://www.hoppenstedt-hochschuldatenbank.de) by Bisnode (http://www.bisnode.de) to retrieve data of potential participants in private organizations. Hoppenstedt is one of the largest commercial business data providers in Germany. It contains over 300,000 profiles of German companies with information about their size, industry, and contact information, and has been used by recent studies (Benlian &

Hess, 2011; Benlian, Hess, & Buxmann, 2009). We extracted a general overview by searching for companies from different branches such as manufacturing, trade, automobile, and

services. Next, we checked for contact persons in these organizations, whose job titles or departments were related to IS. We sent an email inviting this person to participate in our study. If no valid email address could be found, we searched for another contact person from this organization. Second, we contacted persons working at government organizations. For this purpose, we randomly selected city administrations on a map to be roughly equally distributed geographically. Additionally, we picked some country councils. We searched online for contact information of persons with matching job descriptions or responsibilities within these administrations. If none was found, this administration was excluded. We

preferred to contact administrations by phone as most of them did not provide email addresses

online. If either a telephone number or an email address was found, we contacted this person

and invited him or her to participate in our study. If no contact information was found, we

looked for a different person of this administration and repeated this loop or excluded this

administration if no alternative person was found. In both regards, we focused on German

organizations since the Hoppenstedt Hochschuldatenbank lists only German companies and

contacting German administrations is preferable when being located in Germany.

(14)

Regarding the forms of communication studied, our sample includes face-to-face communication as well as remote communication, both asynchronous (e.g., e-mail) and synchronous (e.g., video conferences) forms. In total, 75 complete answers were collected, from which we omitted one. In this case, the respondent stated the project’s status to be “in preparation” which cannot lead to valid answers regarding a satisfaction with the actual performance and the communication during the development process. We collected data only from the client’s perspective, that is, all construct assessments are as perceived by the client.

Appendix A shows descriptive statistics for our sample.

Measurement Scales

Table 1 provides an overview of the applied constructs, the respective items, and according references. For process performance and product performance, we used measures that are typically used in IS research (Keil, Rai, & Liu, 2013; Wallace et al., 2004). We also used the differentiation between process and product, when adapting items for expectations (Bhattacherjee, 2001). Measures for confirmation are adapted from research concerning ECT in the IS domain (Bhattacherjee, 2001). Satisfaction and CVC are measured in accordance to research concerning client-vendor relations (Lee & Kim, 1999).

In line with previous research (Bhattacherjee, 2001; Wallace et al., 2004), the items for expectations (both process and product), project performance (both process and product), and confirmation were assessed on seven-point Likert scales, ranging from 1 (“I strongly

disagree”) to 7 (“I strongly agree”). Items related to CVC and satisfaction (both process and product) were assessed on seven-point semantic differential scales (cf. Bhattacherjee, 2001;

Lee & Kim, 1999). The scales used ranges from 1 to 7 between listed adjectives.

All latent variables were modeled to have reflective indicators, since all items describe

the underlying phenomenon and are expected to behave in the same way. We followed the

(15)

literature on which the items are based regarding their modeling as reflective indicators

1

(Bhattacherjee, 2001; Lee & Kim, 1999; Wallace et al., 2004).

Additionally, we collected further information about the projects, which we used as control variables in our analysis. This information includes deadline pressure (low, medium, high), novelty of the developed application (an extension to an already existing application, a new generation, or an innovative application), the complexity in regard to required

organizational change (low, medium, high), as well as the project’s necessity and whether the project was conducted voluntarily. Furthermore, we asked whether the contact to the vendor was direct or via an intermediate, whether the vendor was familiar to the client from previous projects, the level of trust towards the vendor (low, medium, high), and the level of

involvement during the project (low, medium, high).

(INSERT TABLE 1 ABOUT HERE)

D ATA A NALYSIS AND R ESULTS

In contrast to covariance-based modeling approaches, partial least squares (PLS) path modeling inhibits minimal limitations on sample size and residual distribution (Chin, Marcolin, & Newsted, 2003). While ECT has a strong theory, our holistic model, consisting of the ECT and CVC, does not have a strong theory and can therefore be argued to be exploratory. Due to this explorative approach and our sample size (Hair, Ringle, & Sarstedt, 2011), we applied PLS path modeling by using SmartPLS 3.0 (Ringle, Wende, & Becker, 2015). As we were especially interested in the strength and direction of relationships between

1

While literature suggests a reflective measurement model, one could argue for a formative modeling of project

performance and CVC. Arguments raised by Fornell and Bookstein (1982) on trait characteristics of reflective

measures, Rossiter (2002) arguments on reflective measured indicators causing the construct’s underlying

concept and interchangeability of reflective indicators as proposed by Jarvis, Mackenzie, and Podsakoff (2003)

are arguments for a formative modeling of project performance and expectations. While we chose a reflective

measurement model, we conducted our analysis with formative measures as well and did not find substantial

differences. To be in line with previous research on which our items are based, we chose to rely on the reflective

measurement model.

(16)

our constructs, we follow the arguments of Calantone, Graham, and Mintu-Wimsatt (1998, p.

28): “The PLS parameter estimates better reveal the strength and direction (i.e., positive vs.

negative) of the relationships among variables compared to correlation coefficients”. In addition to our interest in strength and direction of relationships, we were interested in prediction and exploratory model validation, for which PLS is suited as well (Birkinshaw, Morrison, & Hulland, 1995; Green & Ryans, 1990; Mahmood, Bagchi, & Ford, 2004).

Furthermore, PLS “is more robust with small sample sizes” (Green & Ryans, 1990, p. 53).

While our measures are already tested and verified, the relations are not, for which PLS is especially suited (Ainuddin, Beamish, Hulland, & Rouse, 2007). As pointed out before, we aimed to validate our findings with project performance and CVC as formative constructs as well (see footnote 1), for which PLS is better suited than a covariance-based approach (Hair, Sarstedt, Ringle, & Mena, 2012; Reinartz, Haenlein, & Henseler, 2009). Although

covariance-based approaches often do not provide more precise results, we validated our results by utilizing a covariance-based approach, which showed similar results.

2

This

calculation can only provide weak support for our results, as a sample size of 74 is rather low for a covariance-based SEM. We validated our scales’ psychometric properties to measure the constructs and falsify the hypothesized relations as stated above.

Measurement Model

Since our measurement model contains reflective indicators only, we consider the following four reliability and validity criteria: internal consistency, indicator reliability, convergent validity, and discriminant validity.

First, two criteria can be used to evaluate internal consistency. Cronbach’s alpha and composite reliability need to exceed 0.700 for each construct (Nunnally, 1978; Werts, Linn, &

2

The results calculated by AMOS for SPSS can be obtained from the authors. Similarly to our study, others

(e.g., Sideridis, Simos, Papanicolaou, & Fletcher, 2014) found that designs with more than 20 items and between

4 and 10 latent variables were sufficiently strong with less than 100 participants.

(17)

Jöreskog, 1974). Our two models fulfill both criteria since the respective values are above the recommended threshold (see Table 2 for process model and Table 3 for product model).

Second, indicators are considered reliable if the associated latent construct explains more than half of the indicator’s variance (Henseler, Ringle, & Sinkovics, 2009). Indicators are reliable if they have a t-value equal to 1.66 or higher (level of significance 5%) and a loading of 0.700 or higher. The process model passed the criterion of indicator reliability with the lowest loading being 0.742 (CONF2) and lowest t-value being 4.049 (EPROC2). While all indicators of the product model fulfilled the t-value criterion, we removed two indicators (EPROD1 and EPROD5) since they showed a loading below 0.700.

Third, three criteria can be applied to assess convergent validity (Fornell & Larcker, 1981): all item factor loadings should exceed 0.700, composite construct reliabilities should exceed 0.800, and average variance extracted (AVE) should exceed 0.500 for each construct.

As Table 4 (process model) and Table 5 (product model) show, standardized item loadings exceed the threshold of 0.700. Additionally, Tables 2 and 3 demonstrate the composite

reliabilities of all constructs exceed the required minimum of 0.800. The tables also show that AVE values of all constructs exceed the threshold of 0.500. Thus, convergent validity

conditions are met.

Fourth, to confirm discriminant validity latent variables need to explain their indicators’

variances to a higher degree than the variances of other latent variables (Fornell & Larcker,

1981). Accordingly, the square root of each construct’s AVE needs to exceed the correlations

with the other constructs. As can be seen in Table 2 and Table 3, all latent variables in both

models fulfill this criterion. Moreover, we evaluated discriminant validity by examining the

factor loadings of each indicator. According to Chin (1998), each indicator needs to load

higher on the associated construct compared to all other constructs. In our case, discriminant

validity is confirmed by factor loadings and cross-loadings (see Tables 4 and 5). In addition to

the Fornell-Larcker criterion, Henseler, Ringle, and Sarstedt (2015) propose Heterotrait-

(18)

monotrait (HTMT) ratio of correlations as a new criterion to assess discriminant validity.

Table 9 and 10 in Appendix C show the calculated HTMT values for both models. The highest HTMT values of 0.793 for the process model and 0.678 for the product model are below a conservative threshold of 0.850 (Henseler et al., 2015). Combining the results from the HTMT criterion and the Fornell-Larcker criterion is seen as a promising approach to assess discriminant validity (Voorhees, Brady, Calantone, & Ramirez, 2015).

(INSERT TABLE 2 ABOUT HERE)

(INSERT TABLE 3 ABOUT HERE)

(INSERT TABLE 4 ABOUT HERE)

(INSERT TABLE 5 ABOUT HERE)

Common Method Bias

Common method bias (CMB) is a potential threat to internal validity, that is, CMB connotes that empirical evidence for a hypothesis is more a matter of research methods applied and less a reflection of actual affairs (Gregor & Klein, 2014; Sharma, Yetton, &

Crawford, 2009). While method biases are presumed to be less serious in IS research

compared to other disciplines (Malhotra, Kim, & Patil, 2006), we designed our study in a way

that reduces the risk of increased correlations due to a single data collection method. In

particular, we followed recommendations (Burton-Jones, 2009; Gregor & Klein, 2014)

concerning study design (i.e., to reduce the likelihood of CMB) and data evaluation (i.e., to

lessen concerns of CMB) as follows. Concerning the former, we needed to collect information

for both the dependent and independent variables from the same key informants since we

(19)

were interested in the perception of client managers in both regards to assess the relation between their expectations and performance perceptions. However, we avoided the use of question blocks and guaranteed participants anonymity to encourage them to answer honestly.

We took no means to link questionnaires to specific organizations, mail accounts, or persons.

Additionally, we did not promise rewards for participating in our study. Our only offer concerned a free copy of our study once finished, regardless of participation (for respective recommendations see Lindell & Whitney, 2001; Podsakoff, Mackenzie, Lee, & Podsakoff, 2003). Concerning the latter, we conducted Harmon’s single-factor test, following Malhotra et al. (2006). We performed an exploratory factor analysis of all items (Podsakoff et al., 2003).

Since none of the resulting factors accounted for a majority of the variance, we assume no substantial CMB to exist. Moreover, we applied the marker-variable technique in a post hoc fashion to check for the correlation between theoretically uncorrelated dimensions (Malhotra et al., 2006). According to Lindell and Whitney (2001), the second-smallest positive

correlation between manifest variables can be used as an indicator to assess CMB as it provides an adequate proxy. Considering that the second-smallest correlation between manifest variables in our sample amounts 0.005, it can be argued that CMB is not prevalent (Malhotra et al., 2006) in our study.

Hypotheses Testing

Evaluation of structural models with PLS requires a sample size of at least ten cases per predictor (Chin, 1998). More concretely, the sample size should be at least ten times larger than either the highest number of indicators per scale or the highest number of paths directed at any construct in the structural model (for more information on PLS estimation quality and sample size requirements, see Barclay, Higgins, & Thompson, 1995; Chin, 1998; Chin et al., 2003; Chin & Newsted, 1999; Goodhue, Lewis, & Thompson, 2012; Marcoulides &

Saunders, 2006). Since the highest number of indicators per construct is five and the highest

(20)

number of paths to any construct is two, our sample (n = 74) is sufficient to adequately calculate the models. In addition, other recent studies rely on rather low sample sizes as well (e.g., Keil et al., 2013). As commonly applied, we evaluate our structural model in terms of path coefficients and explained variance (R

2

). Whereas path coefficients represent the strength of relationships between independent and dependent variables, R

2

values indicate the

predictive power of the model. We used SmartPLS 3 (Ringle et al., 2015) to calculate path coefficients and applied SmartPLS’s bootstrapping (5,000 samples) to retrieve the respective t-values. Figures 3 and 4 show the overall result for the process and product model,

respectively. Our models are in line with the recommendation by Falk and Miller (1992), suggesting that for nomological validity endogenous latent constructs should provide an R

2

of at least 0.10 to be adequately judged.

(INSERT FIGURE 3 ABOUT HERE)

(INSERT FIGURE 4 ABOUT HERE)

According to Hair et al. (2011) and Henseler et al. (2009), the R

2

values of satisfaction (0.49 and 0.43) are close to being moderate (the threshold being 0.5). Whereas the value for confirmation in case of the product model is similar (0.43), the value for confirmation in case of the process model is considerably lower (0.20). The R

2

values of project performance (0.13 and 0.10) are rather low. However, concerning factors associated with process and product performance in IS projects (Kendra & Taplin, 2004; Nelson, 2007; Reel, 1999), CVC is only one of many factors and explaining these constructs was not our primary purpose.

Except for one hypothesis (i.e., the association between process expectations and confirmation; see Figure 3 and Table 6), the estimated models corroborate our hypotheses.

The path coefficients are supported by the effect sizes as calculated according to Cohen

(21)

(1988). Table 6 provides an overview of the respective indices. Finally, we performed post- hoc power analyses for the endogenous constructs in our models. Considering the

recommended threshold of 0.8, the respective results show a sufficient power level for confirmation (0.98 and 0.99), project performance (0.92 and 0.81), and client satisfaction (1.00 and 0.99). Only one of our control variables (see ‘Measurement Scales’) showed a significant effect with process satisfaction or product satisfaction (trust towards the vendor, p

< 0.05).

(INSERT TABLE 6 ABOUT HERE)

S UMMARY AND D ISCUSSION

We developed and empirically tested a model of IS project success that is based on ECT and that explicitly considers CVC. The model suggests client satisfaction to be the uppermost criterion that is associated with process performance (i.e., budget and schedule) and product performance (i.e., functional and non-functional requirements). While we differentiate between project success concerning the process and the product, the data from a questionnaire survey with people in charge of IS projects on behalf of clients contracting the projects widely corroborate the hypothesized models (see Table 6). We thus advance the understanding of measuring IS project success, contribute to a better understanding of IS development, and explicitly link a success factor (i.e., the perceived quality of CVC) to success criteria (Siau et al., 2010). While previous studies have mostly dealt with vendors’

perspectives, our study uses data collected from project managers on behalf of clients. In the following, we discuss implications of our findings, address the study’s limitations, and provide guidance for future research.

(22)

Implications for Research

Our study is in line with previous research analyzing the role of process and product for achieving client satisfaction (Basten & Pankratz, 2015). While previous research analyzed the perspective of project managers on behalf of the vendor, we now complement the picture by explicitly taking client perceptions into account. In general, our study contributes to the development of IS project management theory, offering several insights.

First, we found that the perceived quality of CVC has an influence on the client’s evaluation process. Our results show that CVC influences the client perceptions of process and product performance. Furthermore, CVC is positively associated with satisfaction

concerning the process and the product (see Figures 3 and 4). However, the relevance of CVC for satisfaction concerning the process seems to be more important. Finally, we emphasize that the improvement of project performance or satisfaction might only be partially related to managed perception due to the communication itself. Nevertheless, improved CVC is likely to result in objectively improved process and product performance, as better and more efficient communication (that is, an improvement in communication quality) is likely to lead to fewer misunderstandings and clearer definitions, ultimately resulting in better products and

processes (Basten et al., 2016; Petter, 2008; Poston et al., 2010; Sharma et al., 2008; Walton

& McKersie, 1965). Our results also support the claim by Lee and Kim (1999) regarding the importance of strengthening communication between client and vendor for building

confidence to prevent opportunism in IS projects.

Second, by using ECT and observing the client perceptions of ISD projects, we show

that client satisfaction in IS projects can be explained by confirmation of expectations to a

large extent. The effect of project performance in the product model is stronger than the effect

of project performance in the process model. We presume that clients tend to value the final

product higher than the process leading to the product. Accordingly, long-term objectives

such as achieving business goals seem to be considered more important than adherence to

(23)

budget and schedule as short-term goals. Nevertheless, the perceived process performance has shown to have a positive effect on the confirmation of expectations, therefore still

contributing to client satisfaction. And while the final product might be valued higher than the process itself, both are linked to each other, as the process leads to the product and flaws and improvements of the process can rub off onto the product.

Third, expectations towards the process do not affect the confirmation of expectations.

The respective hypothesis H

1 Process

is the only one that is not supported by our data. In our view, a plausible explanation is the large degree of budget and schedule overruns typically reported in IS projects (e.g., Sonnekus & Labuschagne, 2003). Since overruns are common, expectations might be rather low, thus not affecting the confirmation of expectations in general. Our control variables measuring complexity, novelty, and deadline pressure showed no significant correlation towards satisfaction regarding process or product (see Appendix B).

As regards avenues for future research, we encourage scholars to replicate and extend our study, especially concerning different cultures and contexts. Similarly, an independent observer (e.g., a matched pair survey conducted on both sides, client and vendor) reporting about projects instead of self-administered questionnaires for data gathering would further minimize social desirability bias. As we did not ask specifically for the usage of agile development practices, future research might also investigate the role of communication in agile versus non-agile projects, since agile development practices often rely on a high level of communication and face-to-face meetings (Inayat, Salim, Marczak, Daneva, & Shamshirband, 2015; Khan & Khan, 2013; Sundararajan, Bhasi, & Vijayaraghavan, 2014). As indicated by our results, this might lead to further insights regarding CVC as well as process and product satisfaction. Especially short development cycles, and therefore regular and frequent

feedback, might result in an increased importance of CVC and therefore higher impact on

satisfaction.

(24)

Implications for Practice

Our results indicate strong correlations between client satisfaction and client performance perceptions regarding both the process and the product. While studies

concerning ISD project success/failure commonly refer to budget and schedule overruns, our results suggest that process expectations (i.e., time and budget) are less influential compared to product expectations. Accordingly, we suggest that project evaluations should emphasize the product component. Additionally, we question the validity of ISD project failure rates that focus on process performance. A project that does not meet process performance

expectations, but manages to satisfy the client due to high product performance might lead to follow-up projects and should thus be considered a success for both client and vendor.

However, practitioners should also be aware that the relevance of success criteria can differ depending on project type and context (Pankratz & Basten, 2015). For instance, adherence to schedule is more critical in projects with a fixed deadline (e.g., regulatory requirements that need to be implemented at a specific point in time). In such projects, the relevance of adherence to schedule naturally increases (Pankratz & Basten, 2015); however, meeting a critical deadline is likely to affect client satisfaction as well. Furthermore, practitioners should be aware that a clear distinction between process performance and product performance is not always evident. A recent case study on a failed ISD project suggests that lack of transparent communication (process-related) about fundamental product issues (product-related)

contributed to project failure (van Ekris, 2016). Nevertheless, taking client satisfaction explicitly into account will improve project evaluation and project performance.

While the differentiation into long-term and short-term relationships between client and vendor had no effect on client satisfaction in our study, communication quality is seen as an important part of collaboration, especially for long-term relationships (Claycomb &

Frankwick, 2010). In offshored and outsourced projects, communication becomes even more

important. Research reveals that in distributed ISD projects, communication is crucial for

(25)

efficiency and, ultimately, success (Herbsleb & Mockus, 2003). However, research also points out that communication can be harmful – if the ideal level of communication is exceeded. For instance, too much communication might drive the clients away from the company rather than pulling them closer (Godfrey, Seiders, & Voss, 2011). While these findings are observed in the field of marketing, similar effects are possible in IS projects as well – if clients are too busy, scheduling meetings for every step in the process could be time consuming and perceived as annoying and counterproductive (Basten et al., 2016). Following, practitioners should focus on the quality of CVC and not (only) its quantity.

Finally, our study indicates that trust in vendor influences clients’ overall satisfaction, which is in line with previous research suggesting that communication and conflict

management are important for building trust (Celuch et al., 2011) and ultimately client satisfaction. While trust is thus considered important for successful projects and should be considered by stakeholders on both client and vendor side, clients should not rely on the vendor too extensively. Previous research on failed ISD projects suggests that too much trust in the vendor can be problematic (Pankratz & Basten, 2013). If the client is not engaged at all, vendors are unlikely to develop a system that satisfies the client. In distributed ISD projects, the buyer-supplier-supplier relationships triad (Wu & Choi, 2005; Wu, Choi, &

Rungtusanatham, 2010) is important to consider because additional influences and dependencies arise. In such triads, not only the relation between vendor and client is important, but the relationship among vendors needs to be taken into account as well.

Limitations

One limitation of our study is the sample size (n = 74). However, our sample size is

above the level required to retrieve statistically significant results. Moreover, our analysis

yielded a satisfying level of power and our results seem to be robust despite the exploratory

character of our study since the influence of the control variables is insignificant. Moreover,

(26)

our sample comprises organizations residing in Germany only. While some of the

participants’ companies act internationally, the responses stem from the German branches only. This might result in missing or insufficient transferability to other countries and cultures.

Our study might also suffer from social desirability bias. Social desirability is the

“tendency on behalf of the subjects to deny socially undesirable traits and claim socially desirable ones, and the tendency to say things which place the speaker in a favourable light”

(Nederhof, 1985, p. 264). This bias is likely to occur in studies such as ours, because it is generally more socially desirable to report a successful project compared to the opposite.

Nederhof (1985) proposes to use forced-choice items, that is, to utilize items in which participants have to choose between two approximately similar attractive items of different topics. While Nederhof already mentions this method’s downsides such as an increased complexity of creating matching items and individual differences in attitudes and therefore preferences, we were not able to apply this approach in our study due to clear and judgmental scale of performance measures such as budget and schedule. Furthermore, Nederhof suggests postulating questions which are neutral concerning social desirability. Similar to forced- choice items, we tried to minimize the social desirability emerging from our questions.

However, due to the clear preference of success compared to failure, social desirability is still likely to emerge from questions posted in our questionnaire. Self-administered questionnaires did not always actively reduce social desirability bias, but it is likely that anonymous and self- administered questionnaires have less distortion. Since our questionnaire was both

anonymous and online available at any place and any time, we suggest that our way of data collection reduces the influence of social desirability bias.

As our study was based on self-administered questionnaires from the client perspective

only, deviations between reported and actual ATP might occur. However, we believe that the

discrepancy between actual ATP and client perceptions of it should be minimal, if at all

(27)

present, for two reasons. First, the ATP measures are said to be objective (Joosten et al., 2014;

Karlsen, Andersen, Birkely, & Ødegård, 2005), especially regarding keeping the budget and schedule measures (which is one of the reasons for ATP’s popularity as success criteria in the first place). Second, the client should not be tempted lying about plans being met because meeting them is vendors’ responsibility.

C ONCLUSION

With our study, we advance the understanding of expectations, communication, and client satisfaction IS projects in the following ways. First, based on ECT, we have analyzed how CVC relates to project performance and satisfaction concerning the development process as well as the developed product on behalf of clients in IS projects. Increased communication quality is likely to improve client perceptions concerning process and product performance and to increase client satisfaction concerning both dimensions of IS project success. Second, our study is in line with research considering client satisfaction the uppermost criterion of IS project success. Our results suggests that both process and product performance are relevant for the confirmation of expectations in IS projects. While this insight has primarily been assessed from the projects managers’ perspective on behalf of vendors, our study

complements the picture by using data obtained from the managers’ counterparts on behalf of the client. Finally, expectations concerning the development process are not relevant for client satisfaction, which we explain by the common overruns of related indices in many IS projects.

Future research might dig deeper into the contribution of different communication mediums.

To strengthen our findings, future research should attempt to replicate our study in different

settings and investigate differences concerning communication mediums by contrasting agile

and non-agile development projects.

(28)

R EFERENCES

Agarwal, N., & Rathod, U. (2006). Defining ‘Success’ for Software Projects: An Exploratory Revelation.

International Journal of Project Management, 24(4), 358-370.

Aier, S., Bucher, T., & Winter, R. (2011). Critical Success Factors of Service Orientation in Information Systems Engineering. Business & Information Systems Engineering, 3(2), 77–88.

Ainuddin, R. A., Beamish, P. W., Hulland, J. S., & Rouse, M. J. (2007). Resource attributes and firm performance in international joint ventures. Journal of World Business, 42(1), 47-60.

Alter, S. (2008). Defining Information Systems as Work Systems: Implications for the IS Field. European Journal of Information Systems, 17(5), 448-469.

Anderson, E. W., Fornell, C., & Lehmann, D. R. (1994). Customer Satisfaction, Market Share, and Profitability:

Findings from Sweden. Journal of Marketing, 58(3), 53–66. doi:10.2307/1252310

Anderson, E. W., & Sullivan, M. W. (1993). The Antecedents and Consequences of Customer Satisfaction for Firms. Marketing Science, 12(2), 125–143. doi:10.2307/184036

Aronson, E., & Carlsmith, J. M. (1962). Performance Expectancy as a Determinant of Actual Performance. The Journal of Abnormal and Social Psychology, 65(3), 178 - 182.

Baker, B. N., Murphy, D. C., & Fisher, D. (1988). Factors Affecting Project Success. Hoboken, NJ, USA: John Wiley & Sons.

Barclay, C., & Osei-Bryson, K.-M. (2009). Determining the Contribution of IS Projects: An Approach to Measure Performance. Paper presented at the Proceedings of the 42nd Annual Hawaii International Conference on System Sciences, Piscataway.

Barclay, D., Higgins, C., & Thompson, R. (1995). The Partial Least Squares (PLS) Approach to Causal Modeling: Personal Computer Adoption and Use as an Illustration. Technology studies, 2(2), 285-309.

Basten, D., & Pankratz, O. (2015). Customer Satisfaction in IS Projects: Assessing the Role of Process and Product Performance. Communications of the Association for Information Systems, 37(Paper 22), 430- 447.

Basten, D., Stavrou, G., & Pankratz, O. (2016). Closing the Stakeholder Expectation Gap: Managing Customer Expectations Toward the Process of Developing Information Systems. Project Management Journal, 47(5).

Benlian, A., & Hess, T. (2011). Opportunities and risks of software-as-a-service: Findings from a survey of IT executives. Decision Support Systems, 52(1), 232-246.

Benlian, A., Hess, T., & Buxmann, P. (2009). Drivers of SaaS-adoption – an Empirical Study of Different Application Types. Business & Information Systems Engineering, 1(5), 357-369.

Bhattacherjee, A. (2001). Understanding Information Systems Continuance: An Expectation-Confirmation Model. MIS Quarterly, 25(3), 351–370.

Bhattacherjee, A., & Premkumar, G. (2004). Understanding Changes in Belief and Attitude toward Information Technology Usage: A Theoretical Model and Longitudinal Test. MIS Quarterly, 229-254.

Birkinshaw, J., Morrison, A., & Hulland, J. (1995). Structural and competitive determinants of a global integration strategy. Strategic Management Journal, 16(8), 637-655.

Burton-Jones, A. (2009). Minimizing method bias through programmatic research. MIS Quarterly, 33(3), 445- 471.

Calantone, R. J., Graham, J. L., & Mintu-Wimsatt, A. (1998). Problem-solving approach in an international context: Antecedents and outcomes. International Journal of Research in Marketing Science, 15(1), 19- 35.

Celuch, K., Bantham, J. H., & Kasouf, C. J. (2011). The Role of Trust in Buyer–seller Conflict Management.

Journal of Business Research, 64(10), 1082-1088.

Chin, W. W. (1998). The partial least squares approach to structural equation modeling. In G. A. Marcoulides (Ed.), Modern methods for business research (pp. 295–358). Mahwah: Erlbaum.

Chin, W. W., Marcolin, B. L., & Newsted, P. R. (2003). A Partial Least Squares Latent Modeling Approach for Measuring Interaction Effects. Results from a Monte Carlo Simulation Study and an Electronic-Mail Emotion / Adoption Study. Information Systems Research, 14(2), 189–217.

Chin, W. W., & Newsted, P. R. (1999). Structural Equation Modeling Analysis with Small Samples Using Partial Least Squares. Statistical strategies for small sample research, 2, 307-342.

Claycomb, C., & Frankwick, G. L. (2004). A Contingency Perspective of Communication, Conflict Resolution and Buyer Search Effort in Buyer- Supplier Relationships. The Journal of Supply Chain Management, 18-34.

Claycomb, C., & Frankwick, G. L. (2010). Buyers' Perspectives of Buyer–seller Relationship Development.

Industrial Marketing Management, 39, 252-263.

Cohen, J. W. (1988). Statistical Power Analysis for the Behavioral Sciences (2 ed.). Hillsdale: Erlbaum.

Collins, A., & Baccarini, D. (2004). Project Success - A Survey. Journal of Construction Research, 5(2), 211–

231.

(29)

Cuellar, M. (2010). Assessing Project Success: Moving Beyond the Triple Constraint. Paper presented at the International Research Workshop on IT Project Management.

Dvir, D., Lipovetsky, S., Shenhar, A. J., & Tishler, A. (1998). In Search of Project Classification: A Non- Universal Approach to Project Success Factors. Research Policy, 27(9), 915–935.

Dyer, J. H., & Singh, H. (1998). The Relational View: Cooperative Strategy and Sources of Interorganizational Competitive Advantage. Academy of Management Review, 23(4), 660-679.

Eagly, A. H., & Chaiken, S. (1993). The Psychology of Attitudes. Fort Worth, TX: Harcourt Brace Jovanovich College Publishers.

Eagly, A. H., & Chaiken, S. (2007). The Advantages of an Inclusive Definition of Attitude. Social Cognition, 25(5), 582-602.

Engel, J. F., Kollat, D. T., & Blackwell, R. D. (1968). Consumer Behavior. New York: Holt and Rinehart and Winston.

Falk, R. F., & Miller, N. B. (1992). A Primer for Soft Modeling (1 ed.). Akron, Ohio: University of Akron Press.

Fennis, B. M., & Stroebe, W. (2010). The Psychology of Advertising: Psychology Press.

Festinger, L. (1957). A Theory of Cognitive Dissonance. Stanford, CA: Stanford University Press.

Fornell, C., & Bookstein, F. L. (1982). Two Structural Equation Models: LISREL and PLS Applied to Consumer Exit-Voice Theory. Journal of Marketing Research, 19(4), 440-452. doi:10.2307/3151718

Fornell, C., & Larcker, D. F. (1981). Evaluating Structural Equation Models with Unobservable Variables and Measurement Error. Journal of Marketing Research, 18(1), 39–50.

Glass, R. L. (1999). Evolving a New Theory of Project Success. Communications of the ACM, 42(11), 17–19.

Godfrey, A., Seiders, K., & Voss, G. B. (2011). Enough is Enough! The Fine Line in Executing Multichannel Relational Communication. Journal of Marketing, 75(4), 94-109.

Goodhue, D. L., Lewis, W., & Thompson, R. (2012). Does PLS have Advantages for Small Sample Size or Non- Normal Data? MIS Quarterly, 36(3), 891-1001.

Green, D. H., & Ryans, A. B. (1990). Entry strategies and market performance: Causal modeling of a business simulation. Journal of Product Innovation Management, 7(1), 45-58.

Gregor, S., & Klein, G. (2014). Eight Obstacles to Overcome in the Theory Testing Genre. Journal of the Association for Information Systems, 15(11), i-xix.

Hair, J. F., Ringle, C. M., & Sarstedt, M. (2011). PLS-SEM: Indeed a Silver Bullet. The Journal of Marketing Theory and Practice, 19(2), 139–152. doi:10.2753/mtp1069-6679190202

Hair, J. F., Sarstedt, M., Ringle, C. M., & Mena, J. A. (2012). An assessment of the use of partial least squares structural equation modeling in marketing research. Journal of the Academy of Marketing Science, 40(3), 414-433.

Han, H.-S., Lee, J.-N., Chun, J. U., & Seo, Y.-W. (2013). Complementarity between Client and Vendor IT Capabilities: An Empirical Investigation in IT Outsourcing Projects. Decision Support Systems, 55(3), 777-791. doi:10.1016/j.dss.2013.03.003

Harmon-Jones, E., Harmon-Jones, C., & Levy, N. (2015). An Action-Based Model of Cognitive-Dissonance Processes. Current Directions in Psychological Science, 24(3), 184 - 189.

Henseler, J., Ringle, C. M., & Sarstedt, M. (2015). Testing measurement invariance of composites using partial least squares. Forthcoming in: International Marketing Review.

Henseler, J., Ringle, C. M., & Sinkovics, R. R. (2009). The Use of Partial Least Squares Path Modeling in International Marketing. Advances in International Marketing, 20(IV), 277–319.

Herbsleb, J. D., & Mockus, A. (2003). An Empirical Study of Speed and Communication in Globally Distributed Software Development. IEEE Transactions on Software Engineering, 29(6), 481-494.

doi:10.1109/TSE.2003.1205177

Hossain, M. A., & Quaddus, M. (2012). Expectation–Confirmation Theory in Information System Research: A Review and Analysis. In Y. K. Dwivedi, M. R. Wade, & S. L. Schneberger (Eds.), Information Systems Theory. Explaining and Predicting our Digital Society (pp. 441–469). New York: Springer.

Howard, J. A., & Sheth, J. N. (1969). The Theory of Buyer Behavior. New York: Wiley.

Hyväri, I. (2006). Success of Projects in Different Organizational Conditions. Project Management Journal, 37(4), 31–41.

Ika, L. A. (2009). Project Success as a Topic in Project Management Journals. Project Management Journal, 40(4), 6–19.

Inayat, I., Salim, S. S., Marczak, S., Daneva, M., & Shamshirband, S. (2015). A Systematic Literature Review on Agile Requirements Engineering Practices and Challenges. Computers in Human Behavior, 51, Part B, 915 - 929.

Jarvis, C. B., Mackenzie, S. B., & Podsakoff, P. M. (2003). A Critical Review of Construct Indicators and Measurement Model Misspecification in Marketing and Consumer Research. Journal of Consumer Research, 30(2), 199–218.

Joosten, D., Basten, D., & Mellis, W. (2014). Measurement of Information System Project Success in German

Organizations. International Journal of Information Technology Project Management, 5(3), 1–20.

Abbildung

Fig. 2. Proposed Research Model
Fig. 3. Estimated Model (Process) of Client Satisfaction (n = 74)

Referenzen

ÄHNLICHE DOKUMENTE

The Conference is firmly convinced that if people in all walks of life, nongovernmental and voluntary organizations, governments, the World Health Organization and all other

In a first step, slabs of different steel grades were investigated to determine the prior austenite grain size, followed by a feasibility study on the simulation of austenite

public static void main(String args[]) throws Exception {.

public static void main(String[] argv) { Socket socket;..

public static void main(String[] argv) { Socket socket;.

Parallel database systems consist of multiple processors and multiple disks connected by a fast interconnection network. A coarse-grain parallel machine consists of a small number

 A typical transaction server consists of multiple processes accessing data in shared memory.. 

It owns an instance of MysqlIO and uses it to provide connection spe- cific methods like opening and closing a connection and changing the database.. It also works as factory