Genetic Analysis of Insulin and
Insulin-like Growth Factor-1 Signaling in the Central Nervous System
Inaugural-Dissertation zur
Erlangung des Doktorgrades
der Mathematisch-Naturwissenschaftlichen Fakultät der Universität zu Köln
vorgelegt von
Linda Koch
aus Köln
Köln 2007
Berichterstatter: Prof. Dr. Jens Brüning Prof. Dr. Thomas Langer
Tag der mündlichen Prüfung: 06.02.2008
Figure Index _________________________________________________________ VI Table Index __________________________________________________________ IX Abbreviations__________________________________________________________X 1 Introduction ______________________________________________________ 1 1.1 Diabetes mellitus ________________________________________________________1 1.2 Insulin ________________________________________________________________2 1.2.1 Structure and Biosynthesis ________________________________________________________2 1.2.2 Metabolic Effects _______________________________________________________________2 1.3 The Insulin Receptor ____________________________________________________3 1.3.1 Molecular Mechanisms of Insulin Signaling __________________________________________4 1.4 Conditional Gene Targeting ______________________________________________6 1.4.1 Generation of loxP-flanked Alleles _________________________________________________6 1.4.2 Cre-transgenic Mice _____________________________________________________________7 1.5 RNA interference _______________________________________________________9 1.5.1 Small hairpin RNAs ____________________________________________________________10 1.6 Mouse Mutants of Insulin and IGF-1 Receptor Signaling _____________________11 1.7 Insulin and IGF-1 Receptor Signaling Redundancy __________________________12 1.7.1 Insulin and IGF-1 Signaling in the CNS_____________________________________________14 1.7.2 IGF-1 Signaling in Learning and Memory Formation __________________________________15 1.8 Objectives ____________________________________________________________16 2 Material and Methods _____________________________________________ 17 2.1 Chemicals_____________________________________________________________17 2.2 Molecular Biology ______________________________________________________19 2.2.1 Isolation of Genomic DNA_______________________________________________________19 2.2.2 Quantification of Nucleic Acids ___________________________________________________19 2.2.3 Polymerase Chain Reaction (PCR)_________________________________________________20 2.2.4 Southern Blot Analysis__________________________________________________________20 2.2.5 RNA Extraction, RT PCR and Quantitative Realtime PCR ______________________________21 2.2.6 ELISA_______________________________________________________________________22 2.3 Cell Biology ___________________________________________________________23 2.3.1 Gene Targeting and Generation of IGF-1RΔSyn Mice ___________________________________23 2.3.2 Histological Analysis and Immunohistochemistry _____________________________________24 2.4 Biochemistry __________________________________________________________25 2.4.1 Protein Extraction______________________________________________________________25 2.4.2 Western Blot Analysis __________________________________________________________25 2.5 Mouse Experiments ____________________________________________________26 2.5.1 Animals _____________________________________________________________________26 2.5.2 Experimental Setup ____________________________________________________________27 2.5.3 Body Weight and Blood Glucose Levels ____________________________________________28 2.5.4 Food Intake___________________________________________________________________28 2.5.5 Glucose and Insulin Tolerance Test ________________________________________________28 2.5.6 Glucose-stimulated Insulin Secretion _______________________________________________28 2.5.7 Insulin Signaling_______________________________________________________________28 2.5.8 Intracerebroventricular Insulin Infusion _____________________________________________29 2.5.9 Leptin Restoration _____________________________________________________________29 2.5.10Kainic Acid-induced Seizures ____________________________________________________29 2.5.11Analysis of Body Composition____________________________________________________30 2.5.12Behavioral Analysis ____________________________________________________________30 2.6 Computer Analysis _____________________________________________________32
2.6.1 Densitometrical Analysis________________________________________________________ 32 2.6.2 Statistical Methods_____________________________________________________________ 32
3 Results _________________________________________________________ 33 3.1 Inducible inactivation of the insulin receptor gene in peripheral tissues of adult mice _____________________________________________________________________ 33 3.2 Inducible inactivation of the insulin receptor in peripheral tissues and the central
nervous system of adult mice ____________________________________________ 39 3.3 Combined central and peripheral insulin resistance leads to a more severe
lipodystrophy than peripheral insulin resistance____________________________ 41 3.4 Intracerebroventricular infusion of insulin leads to increased lipogenesis _______ 43 3.5 Insulin inhibits adipocyte-autonomous leptin secretion ______________________ 46 3.6 Peripheral and central insulin action regulate hepatic ObRb expression ________ 48 3.7 Central insulin action regulates hepatic IL-6 mRNA levels ___________________ 51 3.8 IRΔwb mice display a higher degree of impaired peripheral glucose metabolism __ 52 3.9 Leptin administration improves glucose metabolism in IRΔwb mice_____________ 54 3.10 Peripheral insulin resistance results in β cell hyperplasia but unaltered insulin
secretion _____________________________________________________________ 56 3.11 Targeted disruption of the IGF-1 receptor allele ____________________________ 59 3.12 Conditional inactivation of the IGF-1 receptor gene in the central nervous system 62 3.13 Physiological characterization of IGF-1RΔSyn mice __________________________ 66 3.13.1Energy homeostasis ____________________________________________________________ 66 3.13.2Glucose homeostasis ___________________________________________________________ 68 3.14 Brain weight is unaffected by central IGF-1R deficiency _____________________ 70 3.15 Unaltered susceptibility to kainic acid of IGF-1RΔSyn mice ____________________ 71 3.16 Central IGF-1 receptor deficiency results in loss of spatial memory formation and
anxiety-like behavior___________________________________________________ 73 4 Discussion ______________________________________________________ 77 4.1 Inducible mouse models of insulin resistance _______________________________ 77 4.2 Peripheral versus central insulin signaling_________________________________ 78 4.2.1 The role of central insulin action in lipogenesis ______________________________________ 78 4.2.2 Insulin-mediated inhibition of adipocyte-autonomous leptin secretion _____________________ 80 4.2.3 Hepatic Stat-3 activation and its role in peripheral glucose homeostasis ___________________ 82 4.2.4 Effects of peripheral and central insulin deficiency on insulin concentrations and its secretion from the pancreatic β cell ____________________________________________________________ 83 4.3 IGF-1 receptor signaling in the central nervous system ______________________ 84 4.3.1 Contribution of central IGF-1 receptor signaling to insulin-mediated effects in the periphery ___ 84 4.3.2 Neuroprotective effects of IGF-1 receptor signaling ___________________________________ 85 4.3.3 IGF-1 receptor signaling in learning and memory formation ____________________________ 86 4.4 Perspectives and experimental approaches ________________________________ 86 5 Summary _______________________________________________________ 88 6 Zusammenfassung _______________________________________________ 89 7 References ______________________________________________________ 91 8 Acknowledgements ______________________________________________ 113
9 Erklärung______________________________________________________ 114 10 Curriculum Vitae________________________________________________ 115
Figure Index
Fig. 1: Metabolic effects of insulin signaling... 3
Fig. 2: Insulin signal transduction pathway... 5
Fig. 3: General scheme of the ligand-activated CreLBD fusion protein. ... 8
Fig. 4: RNA interference. ... 10
Fig. 5: General scheme of the inducible peripheral insulin receptor knockout mouse (IRΔper). .. 33
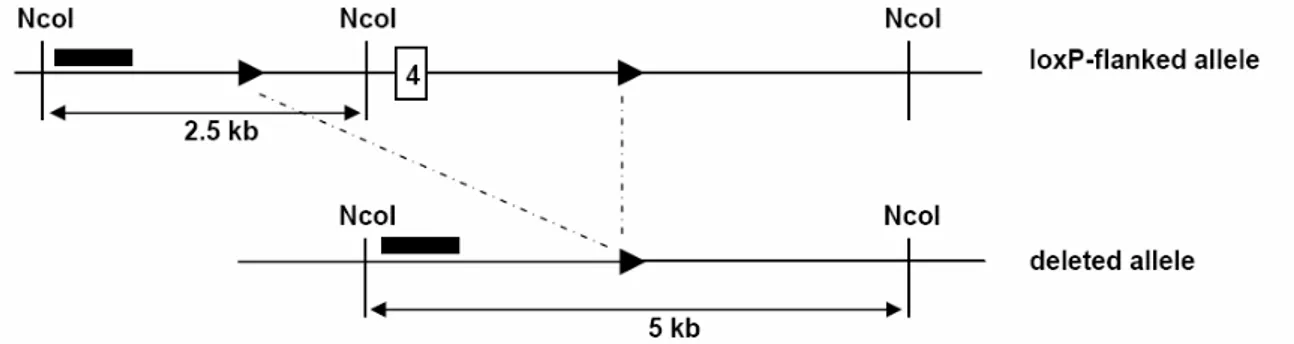
Fig. 6: Genomic map of the mouse insulin receptor locus surrounding exon 4. ... 34
Fig. 7: Southern blot analysis of insulin receptor recombination... 34
Fig. 8: Western blot analysis of insulin receptor expression... 36
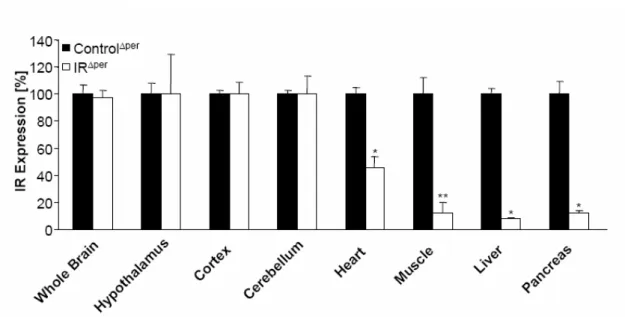
Fig. 9: Insulin receptor deficiency in peripheral organs of IRΔper mice. ... 37
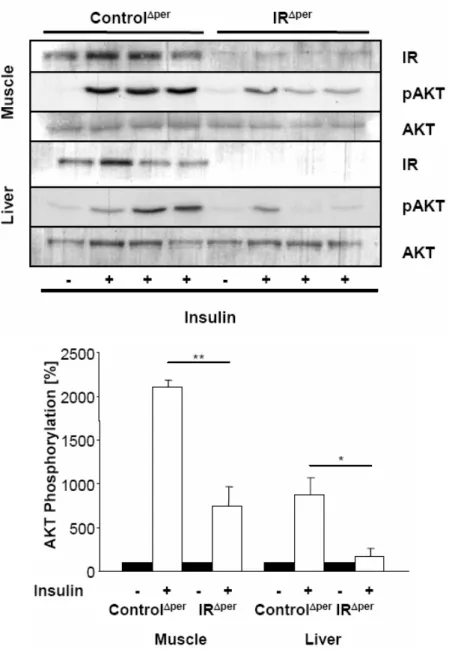
Fig. 10: Abrogated insulin signaling in peripheral organs of IRΔper mice. ... 38
Fig. 11: General scheme of the inducible whole body insulin receptor knockout mouse (IRΔwb). ... 39
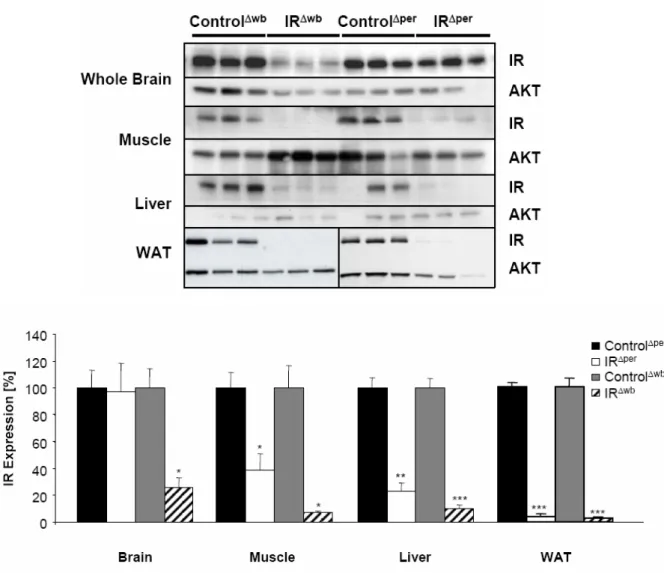
Fig. 12: Insulin receptor deficiency in central and peripheral organs of IRΔwb mice... 40
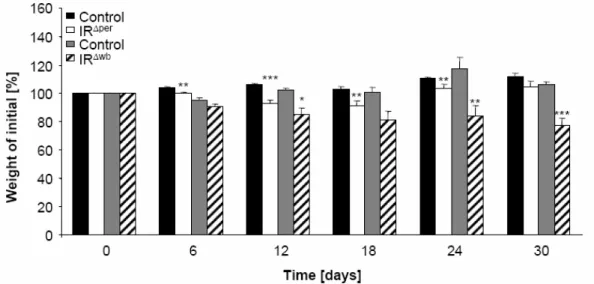
Fig. 13 Changes in body weight in insulin receptor deficient mice. ... 41
Fig. 14: Reduction of white adipose tissue mass in insulin receptor deficient mice. ... 42
Fig. 15: Body composition in insulin receptor deficient mice. ... 42
Fig. 16: Adipose tissue-specific hypoplasia in IRΔwb mice... 43
Fig. 17: Chronic icv infusion of insulin has no effect on peripheral insulin concentrations in C57BL/6 mice. ... 44
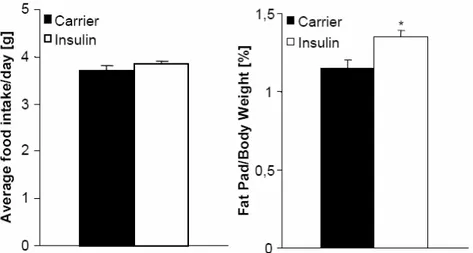
Fig. 18: Chronic icv infusion of insulin increases adipose tissue mass without changes in body weight or food intake in C57BL/6 mice. ... 45
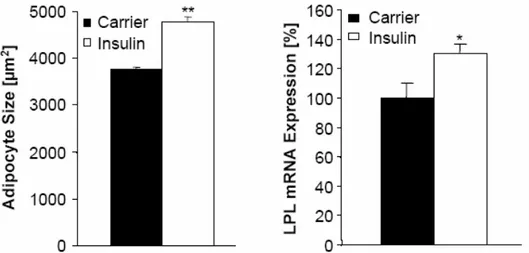
Fig. 19: Chronic icv infusion of insulin increases lipogenesis in C57BL/6 mice. ... 46
Fig. 20: Peripheral insulin resistance results in an increase in total serum leptin concentrations. ... 46
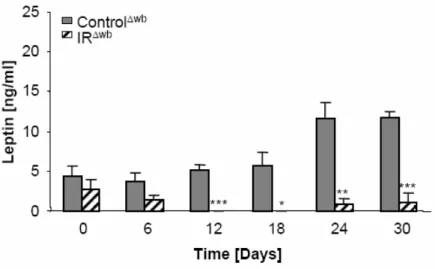
Fig. 21: Whole body insulin resistance results in a decrease in total serum leptin concentrations. ... 47
Fig. 22: Serum adipokine levels correlated with white adipose tissue mass in insulin receptor deficient mice. ... 47
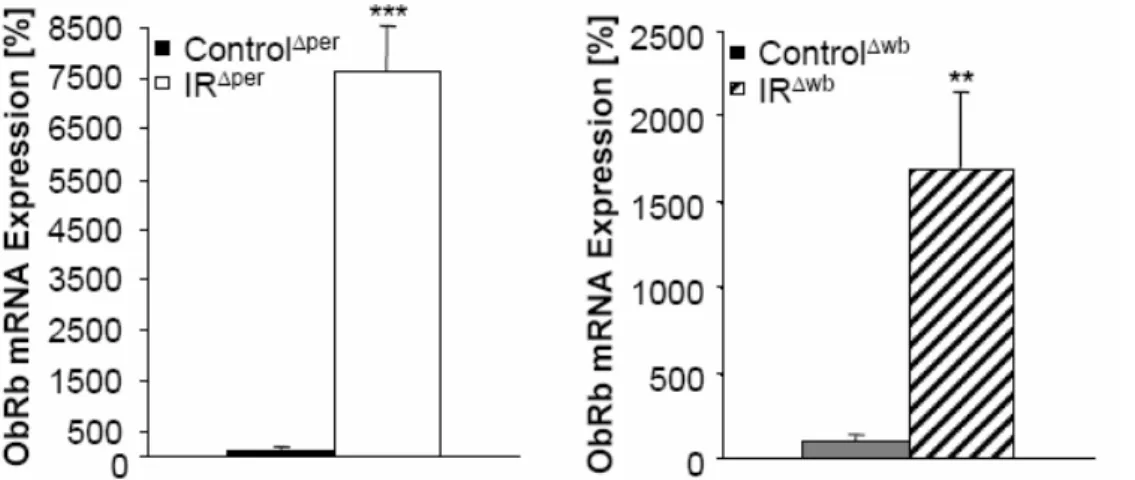
Fig. 23: Peripheral and central insulin receptor deficiency increases hepatic ObRb mRNA expression... 48
Fig. 24: Peripheral and central insulin receptor deficiency increases hepatic ObRb protein expression... 49
Fig. 25: Peripheral but not central insulin receptor deficiency results in an increase in hepatic Stat-3 phosphorylation. ... 50
Fig. 26: Peripheral insulin receptor deficiency results in an increase in hepatic IL-6 mRNA
expression... 51
Fig. 27: Unaltered IL-6 mRNA expression in the liver of IRΔwb mice... 52
Fig. 28: Loss of central insulin receptor signaling results in more pronounced hyperglycemia. 53 Fig. 29: Impaired glucose tolerance in IRΔper mice... 53
Fig. 30: Impaired glucose tolerance in IRΔwb mice... 54
Fig. 31: Restoration of serum leptin concentrations of IRΔwb mice... 55
Fig. 32: Chronic infusion of leptin increases hepatic Stat-3 phosporylation in IRΔwb mice... 55
Fig. 33: Restoration of hepatic Stat-3 phosporylation ameliorates blood glucose concentrations. ... 56
Fig. 34: Peripheral and whole body insulin receptor deficiency results in hyperinsulinemia... 57
Fig. 35: Glucose-stimulated insulin secretion in IRΔper and IRΔwb mice. ... 57
Fig. 36: Peripheral and central insulin resistance results in β cell hyperplasia... 58
Fig. 37: Increased β cell mass in IRΔper and IRΔwb mice. ... 59
Fig. 38: Conditional gene targeting strategy. ... 60
Fig. 39: Correct construct integration into the endogenous IGF-1 receptor locus. ... 60
Fig. 40: Chimeras heterozygous for the mutated IGF-1 receptor allele... 61
Fig. 41: Germline transmission of the mutated IGF-1 receptor allele... 61
Fig. 42: Central IGF-1 receptor protein expression. ... 63
Fig. 43: Peripheral IGF-1 receptor protein expression... 64
Fig. 44: Synapsin Cre expression in brain regions of SynCre-LacZ mice. ... 65
Fig. 45: Reduced IGF-1 receptor expression in the dentate gyrus of IGF1RΔSyn mice... 66
Fig. 46: Body weight of IGF-1RΔSyn mice... 67
Fig. 47: Unaltered body composition of IGF-1RΔSyn mice... 67
Fig. 48: Central IGF-1 receptor deficiency has no impact on adipose tissue mass or serum leptin and insulin concentrations... 68
Fig. 49: Loss of central IGF-1 receptor signaling has no impact on blood glucose concentrations. ... 69
Fig. 50: Unaltered glucose tolerance in IGF-1RΔSyn mice. ... 69
Fig. 51: Unaltered insulin sensitivity in IGF-1RΔSyn mice... 70
Fig. 52: Unaltered brain weight of IGF-1RΔSyn mice. ... 71
Fig. 53: Central IGF-1 receptor deficiency has no impact on kainic acid-induced seizures... 72
Fig. 54: Kainic acid-induced neuronal damage occurs to similar extent in IGF-1RΔSyn and control mice... 73
Fig. 55: Spatial navigation working memory is impaired in IGF-1RΔSyn mice. ... 74
Fig. 56: IGF-1RΔSyn mice do not display signs of anxiety... 74
Fig. 57: Unaltered motor coordination in IGF-1RΔSyn mice. ... 75 Fig. 58: Unaltered spontaneous novelty preference and exploratory activity in IGF-1RΔSyn mice.
... 76 Fig. 59: Proposed model for insulin action in the CNS and in the periphery in the regulation of glucose and adipose tissue metabolism. ... 80 Fig. 60: Proposed model for the effects of insulin resistance on circulating leptin levels. ... 81
Table Index
Table 1: Excerpt of transgenic and knockout mouse models involving genes of the insulin or
IGF-1 receptor signaling pathway...12
Table 2: Chemicals...19
Table 3: Oligonucleotides used for genotyping. ...20
Table 4: Oligonucleotides used to amplify the Southern blot probes. ...21
Table 5: Probes used for Realtime PCR...22
Table 6: Primary antibodies used for Western blot analysis...26
Abbreviations
aa amino acid
Akt proteinkinase B
Avertin tribromoethyl alcohol and tert-amyl alcohol β-me β-mercaptoethanol
bp base pair
c DNA concentration
C cytosine
°C degrees Celsius
cDNA complementary DNA
cpm counts per minute
Cre site-specific recombinase (causes recombination) CreERT2 Cre recombinase and mutated ER-LBD fusion protein
Ctrl Control
ddH2O double destilled water
DEPC diethylpyrocarbonate
dNTP desoxynucleotide-triphosphate
DMSO dimethylsulfoxide
DNA desoxyribonucleic acid
ds doublestranded
DTT 1,4-Dithio-DL-threitol
E2 17-β-estradiol
ECL enhanced chemiluminescence
EDTA ethylene-diaminetetraacetic acid
EF embryonic fibroblasts
ER estrogen receptor
ERT2 mutated ligand binding domain of the human ER
ES embryonic stem
EtBr ethidium bromide
G guanine
G418 geneticin
GTT glucose tolerance test h hour
HEPES N-2-hydroxyethylpiperazine-N’-2-ethansulfonic acid
HR homologous recombinant
HRE hormone response element
HSV-tk thymidine kinase of the Herpes simplex virus
icv intracerebroventricular
IGF-1R insulin-like growth factor-1 receptor
i.p. intraperitoneal
IR insulin receptor
IRS insulin receptor substrate ITT insulin tolerance test
KA kainic acid
kbp kilobase pairs
kDa kilodalton
loxP locus of x (crossing) over of P1
min minute
NaCl sodium chloride
NaOH sodium hydroxide
neor neomycine resistance gene
LBD ligand binding domain
NLS nuclear localization sequence
OD optical density
PBS phosphate buffered saline PCR polymerase chain reaction
per peripheral
PH pleckstrin homology
PI3K phosphatidylinositol-3 kinase
PIP2 phosphatidylinositol-4,5-biphosphate PIP3 phosphatidylinositol-3,4,5-triphosphate
p.o. per os
PTB phosphotyrosine binding
RNA ribonucleic acid
RNAi RNA interference
rpm rounds per minute
RT room temperature
sec second
s.c. subcutaneous
SDS sodium dodecyl sulfate
SH src homology
shRNA small/short hairpin RNA
siRNA small interfering RNA
ss singlestranded
SSC sodium chloride/ sodium citrate buffer TAE Tris-acetic acid-EDTA buffer Taq Pol polymerase from Thermus aquaticus
TE Tris-EDTA buffer
Tris 2-amino-2-(hydroxymethyl-)1,3-propandiole TWEEN polyoxethylene-sorbitan-monolaureate
U units
v/v volume per volume
WAT white adipose tissue
wb whole body
w/v weight per volume
wt wildtype
5’ five prime end of DNA sequences 3’ three prime end of DNA sequences
1 Introduction
1.1 Diabetes mellitus
Diabetes mellitus is a chronic disease, accounting for an estimated 224.000 deaths every year in the United States (US) alone, establishing itself as the 6th leading cause of death. As of 2005, an estimate of 7% of the US population, approximately 20.8 million people, suffers from diabetes. Diabetes and complications arising from it cost an estimated $132 billion each year in terms of healthcare and lost productivity in the US (1).
The first reference to diabetes is attributed to an Egyptian papyrus, written as early as 1550 BC, which describes remedies for the treatment of excessive urination.
Around 100 AD, Areteus, a disciple of Hippocrates, provided the first accurate description of the disease and termed it “diabetes”, based on the Greek word diabainein,
“to pass through”, a reference to the polyuria, one of its major symptoms (for review see (2, 3)). Not until the late 18th century, the physicians Johann Peter Frank and John Rollo appended the Latin term “mellitus”, for honey, to distinguish diabetes from other diseases causing polyuria (for review see (4)).
In the early modern period, one of the first publicized works relating to diabetes originates from 1675, when the British physician Thomas Willis found the urine of diabetic patients to be abnormally sweet (5), an observation which was confirmed a century later, in 1776, by his compatriot and colleague Matthew Dobson. Dobson also found that sugar was not only present in the urine but in the blood of patients, thereby establishing the systemic nature of the disorder (6). Twelve years later, the physician Thomas Cawley first noted a correlation between diabetes and damaged pancreas while performing an autopsy on a diabetic patient, yet his observation would not be acknowledged for another hundred years (7). In 1889, the Polish-German physician Oscar Minkowski and his German colleague Joseph von Mering discovered that after surgical removal of the pancreas, dogs displayed all symptoms associated with diabetes and died shortly afterwards, providing the first link between the pancreas and diabetes ((8), (for review see (9)). However, although it had been deduced by several scientists that a substance must be secreted from the pancreas to regulate carbohydrate metabolism and that loss of this substance causes diabetes (10), it was not until 1921 that physician Frederick Banting and medical student Charles Best in the lab of J.J.R.
MacLeod at the University of Toronto finally made the discovery which would revolutionize the treatment of diabetes mellitus (11). In 1923, Banting and MacLeod were awarded the Nobel Prize in Medicine for their discovery of insulin.
1.2 Insulin
1.2.1 Structure and Biosynthesis
Insulin is synthesized in the β cells of the pancreatic islets of Langerhans, endocrine cells within the predominantly exocrine pancreatic tissue. It is cleaved from an inactive precursor, proinsulin, consisting of two peptide chains linked by a third, the so-called C-peptide (12). Proinsulin is synthesized in the endoplasmatic reticulum, then transported to the Golgi apparatus where it is packed into secretory granules (13).
Within these vesicles, it is processed to insulin through site-specific proteolytic cleavage by two endopeptidases and one carboxypeptidase (14-16). The C-peptide is removed from proinsulin, leading to a conformational change of the protein which enables the interaction of the mature molecule with its receptor, the insulin receptor (17). After binding to and activating its receptor, insulin is either returned into the circulation intact or internalized and degraded by the Insulin-degrading enzyme (for review see (18)).
1.2.2 Metabolic Effects
Elevated plasma glucose concentration (hyperglycemia) is the predominant stimulus causing insulin secretion from the pancreatic β cells into the bloodstream, although insulin is also secreted in response to glucagon, adrenalin or increased amino acid concentrations. Activation of insulin signaling results in the translocation of the glucose transporter GLUT-4 into the cell membrane of skeletal muscle cells and adipocytes, thereby increasing glucose uptake into these tissues (19-21). In addition to glucose clearance from the blood, insulin increases glycolysis and inhibits its reverse process, gluconeogenesis (for review see (22)). Concomitantly, insulin promotes the storage of substrates by stimulating amino acid uptake and protein synthesis in muscle, glycogen synthesis in liver and lipogenesis in adipose tissue. Catabolic processes, on the
other hand, such as glycogenolysis, lipolysis and proteolysis are inhibited by insulin (Fig. 1).
Fig. 1: Metabolic effects of insulin signaling.
Overview of insulin’s effects on the cellular level. Insulin signaling results in the increase of glucose and amino acid uptake, glycogen and protein synthesis, lipogenesis and glycolysis, while it inhibits gluconeogenesis, lipolysis and proteolysis (adapted from (23)).
1.3 The Insulin Receptor
The family of ligand-activated receptor tyrosine kinases represents the connecting link between extra- and intracellular signal transduction of insulin and insulin-like peptides. This subfamily of receptor kinases comprises the insulin receptor, the insulin- like growth factor (IGF)-1 receptor and an orphan receptor, known as the insulin receptor-related receptor (24-26). These receptors are heterotetrameric proteins, consisting of two αβ-dimers connected by disulfide bridges (27, 28). The α-subunits form an extracellular ligand binding domain, while the transmembrane region and the intracellular C-terminal part encompassing the intrinsic receptor tyrosine kinase activity are formed by the β-subunit (29-32). Each receptor is the product of a separate gene, whose transcript is translated into a precursor or proreceptor that, after removal of the precursor signaling peptide, is post-translationally processed by a furin-like enzyme to yield a single αβ-dimer (33).
In humans, the gene encoding the insulin receptor is located on the short arm of chromosome 19, spanning a region of more than 120 kilobase pairs (kbp) which
comprise a total of 22 exons (34, 35). In mammals, insulin receptors are expressed in all tissues, including classic insulin responsive tissues such as skeletal muscle, liver and adipose tissue, as well as tissues previously thought to be unresponsive to insulin like the central nervous system, the pancreas or lymphatic cells (36-38).
1.3.1 Molecular Mechanisms of Insulin Signaling
Insulin and the related insulin-like growth factor (IGF)-1 exert their pleiotropic functions by binding to and activating their membrane-bound tyrosine kinase receptors (25, 39, 40) (Fig. 2). Functionally, the insulin receptor acts as a classical allosteric enzyme. Ligand binding results in receptor autophosphorylation on three intracellular tyrosine residues of the β-subunits, thereby activating the intrinsic tyrosine kinase activity in the C-terminal region of the receptor (41). Upon autophosphorylation, intracellular signaling proteins are recruited to the receptor through their phosphotyrosine binding (PTB) domain and there become tyrosine phosphorylated (42- 44). In addition to the PTB domain, intracellular substrates contain an N-terminal Pleckstrin homology (PH) domain which, through interaction with inositol phosphates in the cell membrane, allows for the localization of the substrate to the membrane (45- 47). Intracellular signaling molecules of the insulin receptor are the insulin receptor substrates (IRS)-1-4 and the Grb2-associated binder (Gab)-1-4 proteins (48-54). These substrates, when tyrosine phosphorylated, serve as docking platforms for Src-homology (SH)-2 domain containing proteins such as the regulatory subunit of the phosphatidylinositol 3 kinase (PI3K), the growth factor receptor binding protein (Grb)-2 and the SH-2 domain containing phosphatase (Shp)-2, among others, resulting in the activation of the PI3K and the Ras/Raf Mitogen-activated protein (MAP)-kinase pathway (55-59). The PI3K is a heterodimer consisting of a catalytic subunit, p110, constitutively associated with a regulatory subunit (for review see (60)). When activated, PI3K catalyzes the conversion of phosphatidylinositol-4,5-biphosphate (PIP2) to phosphatidylinositol-3,4,5-triphosphate (PIP3) (61, 62). PIP2 and PIP3 bind the PH domain of the serine/threonine kinase proteinkinase B, also termed Akt. This results in the recruitment of Akt from the cytosol to the membrane and a conformational change, which converts Akt into a substrate for the phosphoinositide-dependent kinase (Pdk)-1 (for review see (63)). Activation of Akt controls a broad variety of biological functions such as the regulation of glycogen and protein synthesis, protection from apoptosis,
stimulation of glucose transport and the regulation of gene transcription (for review see (64)).
Fig. 2: Insulin signal transduction pathway.
Binding of insulin to the insulin receptor results in receptor trans-phosphorylation and activation leading to the recruitment and subsequent phosphorylation of insulin receptor substrates. This enables the binding of SH-2 domain containing proteins, which ultimately leads to the activation of downstream signaling pathways such as the PI3K or the MAPK signaling pathway. IR = insulin receptor, IRS = insulin receptor substrate, PI = Phosphatidylinositol, Pdk = phosphoinositide-dependent kinase, Akt = Proteinkinase B, FoxO1 = Forkhead transcription factor O1, Gsk3β = glycogen synthase kinase 3β, eIF2 = eukaryotic translation inititation factor 2, PDE3B = phosphodiesterase 3B, PKA = Proteinkinase A, HSL = hormone sensitive lipase = mTOR = mammalian target of rapamycin, p70S6K = p70 S6 kinase, Grb2 = growth factor receptor binding protein, SOS = son of sevenless, Ras = rat sarcoma, Raf = v-raf-leukemia viral oncogene, MEK = Mitogen-activated protein kinase kinase, ERK = extracellular signal-regulated kinase
1.4 Conditional Gene Targeting
Manipulating the mouse genome using homologous recombination in embryonic stem cells has now been recognized as a technique so valuable for the analysis of gene function that its discoverers Mario R. Capecchi, Sir Martin J. Evans and Oliver Smithies were awarded the Nobel Prize in Physiology or Medicine 2007 ((65-67), for review see (68)). However, since this process involves the manipulation of the murine germline, conventional gene targeting results in the loss of gene function in all cells during pre- and postnatal development. Consequences to be considered are the occurrence of embryonic lethality, compensatory effects by redundant genes and side effects caused by the inserted selection marker. To circumvent these potential drawbacks, gene inactivation in a spatially and temporally controlled manner can be achieved by conditional gene targeting, a more sophisticated method based on sequence-specific DNA recombinases as tools for genetic engineering (for review see (69, 70). One of these site-specific DNA recombinases, the Cre (causes recombination) recombinase, is a 38 kDa protein of the bacteriophage P1 that recognizes specific 34 bp palindromic sequences, termed loxP (locus of crossing (x) over in P1) sites (71, 72). Depending on the orientation of the loxP sites the Cre recombinase mediates the inversion, excision or translocation of the DNA sequence that is flanked by the two loxP sequences (73-76).
DNA sequences flanked by directly repeating loxP sites are excised as a circular molecule, leaving a single loxP sequence at the site of recombination (73, 77).
1.4.1 Generation of loxP-flanked Alleles
Whereas conventional gene targeting results in the inactivation of a gene already in embryonic stem (ES) cells, the strategy of conditional mutagenesis is based on the flanking of an essential region in a gene of interest by loxP sequences in ES cells without interfering with the original gene function (70, 78). This approach requires the construction of a gene targeting vector, in which two loxP sites are flanking an indispensable gene segment, in most cases one or more exons. The loxP sites are placed within non-coding sequences to preserve gene integrity. Insertion of a selection marker is necessary for subsequent selection of homologous recombinants. The selection marker in turn is flanked by so-called FRT sequences, to later enable its excision from the genome of the ES cells by a transient transfection of the cells with a Flp recombinase-coding plasmid (79). Alternatively, mice still containing the selection
marker within their DNA can be crossed to mice expressing the Flp recombinase in their germline. The Flp/FRT system is the eukaryotic homolog of the Cre/loxP system, originating from the yeast Saccharomyces cerevisiae. FRT sites consist of two 13 bp long sequences immediately flanking an 8 bp long asymmetrical core sequence (80).
Hence, the final gene targeting construct consists of, from 5’ to 3’, a sequence homologous to the target gene sequence, a loxP site, an FRT-flanked selection marker cassette, a second homologous sequence that contains essential regions of the targeted gene, a second loxP site, and a third homologous gene sequence.
The construct is introduced into murine ES cells via electroporation. Cells that have integrated the construct through homologous recombination can be selected for with the help of the selection marker and determined by Southern blot and PCR analyses (81, 82). The construct is integrated only into one of the two alleles of a gene, rendering ES cells heterozygous for the desired mutation. A homologous recombinant ES cell clone is injected into a murine embryo at the blastocyst stage, where it integrates into the inner cell mass of the embryo and participates in the continuing embryonic development (83-85). The blastocysts are implanted into the uterus of pseudopregnant mice. Since the injected ES cell clones can partake in the development of all organs, they can also differentiate into germ cells. All tissues of the resulting offspring, so- called chimeras, consist of two cell types of different origin. When mutated ES cells make up the chimeras germline, the mutation is passed on to its offspring. Further intercrosses yield mice homozygous for the recombinant locus (83, 84, 86, 87).
1.4.2 Cre-transgenic Mice
Cre-transgenic mouse strains are generated either by conventional random transgenics, targeted insertion into a gene (knock-in) or by generating bacterial artificial chromosome (BAC)-transgenic mice (88, 89). Regardless of the strategy, the promotor which drives Cre expression determines onset and cell type-specificity of the Cre- mediated recombination. By crossing mice carrying a loxP-flanked mutation of the gene of interest with mice expressing the Cre recombinase restricted to specific tissues, a conditional mouse mutant is generated that lacks the target gene only in the cells in which Cre is expressed.
To analyze gene function at a certain developmental stage, Cre expression can be temporally controlled either in a transcriptional or in a post-translational manner (for
review see (90)). Post-translational control of Cre expression involves the use of steroid hormone receptors. In the absence of their respective hormone ligands, these intracellular receptors are retained in the cytoplasm by the heatshock protein hsp90 (91).
Binding of the respective hormones to the ligand binding domain (LBD) of the receptor leads to a conformational change, resulting in the dissociation of the multiprotein complex, thereby unmasking a nuclear localization sequence (NLS) which leads to the nuclear import of the receptor. In the nucleus, the receptor homodimerizes and binds specific hormone response elements (HRE) in the promoter of the target genes, thus either activating or repressing their transcription (92-94).
Temporally controlled Cre expression can be achieved by fusing the Cre recombinase to the mutated LBD of a steroid hormone receptor. This fusion protein can be expressed from any cell type-specific promoter. Mutations in the LBD prevent binding and activation of the fusion protein by endogenous steroids (95-97). Upon binding of a synthetic ligand specific for the mutated ligand binding domain of the CreLBD fusion protein, heatshock proteins detach and the fusion protein is transported into the nucleus, where the Cre recombinase mediates the deletion of all loxP-flanked alleles (Fig. 3) (for review see (98)).
Fig. 3: General scheme of the ligand-activated CreLBD fusion protein.
The CreLBD fusion protein is sequestered by heatshock protein hsp90 in the cytoplasm. Binding of a synthetic ligand (T) to the mutated LBD promotes dissociation of hsp90 and nuclear import of the fusion protein, where the Cre recombinase (Cre) mediates recombination of the loxP (triangle) sites flanking an exon (4) of the gene of interest.
A mutant LBD of the human estrogen receptor (ER), ERT2, has been generated, containing three amino acid substitutions, resulting in the inability of the estrogen receptor to be activated by its endogenous ligand, 17-β-estradiol (E2). The result is a 10- fold higher affinity to synthetic ligands, such as the estrogen antagonists tamoxifen or 4-
hydroxy-tamoxifen, compared to former single mutants of the ER-LBD (99). Numerous transgenic mouse strains carrying a chimeric protein consisting of the Cre recombinase and the triple mutant ERT2 (CreERT2) have been generated. Cre activity can be modulated in these mice by per os (p.o.) or intraperitoneal (i.p.) administration of tamoxifen, resulting in the highly efficient recombination of loxP-flanked target genes either ubiquitously or restricted to specific tissues (100-103). One of these mouse strains uses the ubiquitously expressed Rosa26 locus to drive expression of the CreERT2 fusion protein (RosaCreERT2). As previously described for the RosaCreERT2 mice, upon tamoxifen administration, recombination occurs with high efficiency only in peripheral tissues, due to a lower local concentration of tamoxifen in the brain (100).
1.5 RNA interference
RNA interference (RNAi) is based on gene silencing using doublestranded RNA (dsRNA) (104). RNAi is mediated by short interfering RNAs (siRNAs), consisting of two 21 nucleotide single-stranded RNAs that form a 19 bp duplex with a 2 nucleotide 3’overhang on each strand (105). dsRNA is cleaved by the enzyme Dicer to form siRNAs (106). Dicer is a highly conserved protein, consisting of two RNAse III domains, a double-stranded RNA binding domain and a long N-terminal region containing a DEAD-Box RNA helicase domain and a Piwi Argonaute Zwille (PAZ) domain (106-108). The PAZ domain has been shown to bind the 3’ overhang of small RNA molecules (109, 110). One protein family, after which the PAZ domain was named, consists of the Argonaute proteins. These are, together with Dicer, part of the RNA-induced silencing complex (RISC), which binds the antisense strand of the siRNA and uses it to guide mRNA cleavage, resulting in mRNA degradation (111) (Fig. 4).
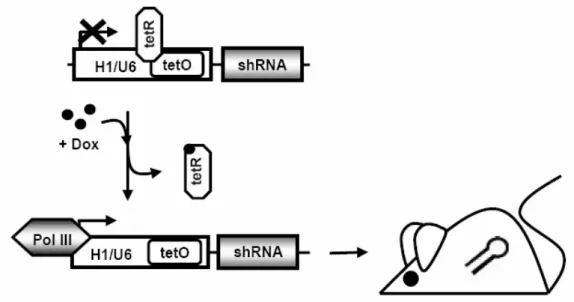
Fig. 4: RNA interference.
dsRNA is cleaved by Dicer into siRNAs. These bind to RISC and mediate mRNA degradation (adapted from (112)).
1.5.1 Small hairpin RNAs
In mammals, injection of long dsRNA to induce gene silencing leads to the activation of an antiviral response, resulting in translational repression and apoptosis in somatic cells (113, 114). These nonspecific dsRNA responses can be prevented by creating dsRNA triggers of less than 30 bp. In vivo expression constructs have been developed for so-called short hairpin RNAs (shRNAs), which resemble endogenously expressed hairpin RNAs and mediate sequence-specific gene silencing in mammalian cells without activating antiviral responses (115, 116). This approach uses small inverted repeats of 19 – 29 nt expressed under the control of an RNA polymerase III promoter to create shRNAs that are then processed by Dicer and shunted into the RNAi pathway. Conditional shRNA-mediated gene silencing in mice has been achieved by employing the Cre/loxP-System to induce tissue-specific control of shRNA expression (117-119). Temporal modulation of ubiquitous shRNA expression has been demonstrated in mice expressing a shRNA against the mRNA of the insulin receptor under the control of a modified RNA polymerase III-dependent promoter containing operator sequences from the E. coli tetracycline resistance operon from the ubiquitously expressed Rosa26 locus (120).
1.6 Mouse Mutants of Insulin and IGF-1 Receptor Signaling
Many insights into the molecular mechanisms of insulin action and its role in individual tissues of the mammalian organism have been gained from the in vivo inactivation of genes pivotal for insulin action, such as insulin, the insulin receptor, as well as downstream signaling molecules such as the IRS proteins, Gab-1, glucose transporter (GLUT)-2 and -4 and metabolic effector molecules like glucokinase (GK).
Genes encoding insulin- like growth factors (IGF-1 and IGF-2) and their type I receptor (IGF-1R) have also been disrupted. A brief summary of the phenotypes is given in Table 1.
Mutation Viable DM Phenotype Reference
Insulin - + intrauterine growth retardation, death within 2 days
of diabetic ketoacidosis and liver steatosis (121) IR - + normal intrauterine growth and development, death
within 3 days of diabetic ketoacidosis (122) IRS-1 + - insulin resistance, hypertension,
hypertriglyceridemia, impaired vascular relaxation
(123-125) IRS-2 + + intrauterine and postnatal growth retardation (126) IRS-3 + n.d. normal glucose tolerance and growth (127) IRS-4 + - mild defects in growth, reproduction and glucose
homeostasis (128)
Gab-1 - - intrauterine death,
developmentaldefects in heart, placenta, and skin (129) LGKO + - improved hepatic insulin sensitivity, reduced
glycemia, improved glucose tolerance (130) βIRKO + + impaired insulin secretion (131) FIRKO + + reduced fat mass, protection against obesity and
glucose intolerance, altered adipose tissue morphology
(132)
MIRKO + - increased adiposity (133)
NIRKO + - normal brain development, mild insulin resistance,
diet-sensitive obesity (134)
LIRKO + + progressive liver failure (135)
IRS-1, GK + + growth retardation (136)
FoxO1, IRS-
1 + - improved insulin sensitivity (137)
GLUT-2 - mild death within 2-3 weeks,
postnatal growth retardation (138) GLUT-4 + - reduced fat mass, growth retardation,
mild impairment of glucose homeostasis (139) IR, IRS-1 + + hyperinsulinemia, β cell hyperplasia (140)
IGF-1 +/- - viability depends on background, dwarfism (141, 142) IGF-1R - - death within 2-3 hours of respiratory failure,
dwarfism, developmental defects of skin, bone,
CNS (141, 143)
Table 1: Excerpt of transgenic and knockout mouse models involving genes of the insulin or IGF-1 receptor signaling pathway.
DM = Diabetes mellitus, n.d. = not determined, IR = insulin receptor, IRS = insulin receptor substrate, KO = knockout, β = β cell-specific, F = fat-specific, M = muscle-specific, N = neuron-specific, L = liver- specific, G = Gab-1, GK = Glucokinase, FoxO1 = Forkhead transcription factor O1, GLUT = Glucose transporter, IGF = insulin-like growth factor.
Most signaling molecules downstream of the insulin receptor exist in more than one isoform, such as Akt or Pdk, or can be composed of different subunits, like PI3K, rendering the inactivation of these proteins difficult. Consequently, a prominent amount of studies have focused on the inactivation of the insulin receptor gene in mice, either in a conventional fashion (122, 144) or by conditional inactivation of the insulin receptor in selected murine tissues (131-134, 145). These experiments have yielded unexpected findings with respect to the role of insulin action in classical insulin target tissues such as skeletal muscle, liver and adipose tissue (132, 133, 135), but also in tissues previously viewed as non-insulin responsive, such as brain, pancreatic β cells, macrophages and blood vessels (131, 134, 146, 147). Nevertheless, analyses of tissue- or cell type-specific insulin receptor knockout mice are limited by the lack of insulin receptor throughout development. Abnormalities arising from impaired insulin action can therefore be partly compensated for by adaptive processes or arise from developmental defects influencing the differentiation of respective tissues.
1.7 Insulin and IGF-1 Receptor Signaling Redundancy
The insulin receptor and the IGF-1 receptor are present on the surface of almost all cells, although their relative proportion varies depending on the target tissue.
Although these two receptors represent two separate gene products, they exhibit up to 85% homology in their amino acid sequence in different domains. Thus, while both insulin and IGF-1 exhibit the highest affinity to their innate receptors, insulin can also bind to and activate the IGF-1 receptor and IGF-1 is capable of binding to and activating the insulin receptor (for review see (148)). After binding of the ligand to its receptor, the same intracellular mechanisms modulate the activation of the PI3K or
MAPK signaling pathways (for review see (149)). Moreover, both receptors can form heterodimers, capable of effectively initiating the downstream signaling machinery (150, 151). Both the ligand binding characteristics as well as the formation of hybrid receptors raise the question of a possible redundancy between the two receptor tyrosine kinases.
In experiments using insulin receptor-deficient hepatocytes, no metabolic effects, such as an increase in glycogen synthesis or inhibition of glucose production, could be detected after insulin stimulation, whereas phosphorylation of insulin receptor substrates IRS-1 and Gab-1 and their binding of the PI3K was unaffected due to a compensatory activation via binding of insulin to the IGF-1 receptor (152). Also, the stimulation of muscle cells and fibroblasts of insulin receptor-deficient mice with IGF-1 or high concentrations of insulin results in an increase in glucose uptake, glycogen synthesis, IRS-1 phosphorylation and activation of PI3K and MAPK (153, 154). These experiments clearly indicate the ability of the IGF-1 receptor to function as an alternative receptor to the insulin receptor in the metabolic signal transduction of insulin receptor-deficient muscle cells. The IGF-1 receptor-stimulated glucose uptake into the skeletal muscle is also partially responsible for the hypoglycemic effect detectable after injection of insulin receptor-deficient mice with IGF-1 (155). Mice with a muscle- specific inactivation of the insulin receptor (MIRKO) maintain euglycemia with normal plasma insulin concentrations over months (133), indicating that a 95% reduction in insulin receptor protein and the resulting insulin resistance can be almost completely compensated for in MIRKO mice. Another example of IGF-1 receptor-mediated compensation for insulin receptor deficiency is provided by transgenic mice expressing a dominant-negative IGF-1 receptor in skeletal muscle. Transgene expression results in the formation of hybrid receptors between the mutant IGF-1 receptor and the endogenous IGF-1 and insulin receptor, leading to the inactivation of the endogenous receptors. This leads to insulin resistance and pancreatic β cell dysfunction, resulting in a diabetes-like phenotype (156).
In conclusion, increasing evidence suggests an important role for the IGF-1 receptor in insulin action, thus defining its signaling pathway as a possible candidate for the development of insulin resistance in the pathogenesis of Diabetes mellitus.
1.7.1 Insulin and IGF-1 Signaling in the CNS
Both the insulin receptor and the IGF-1 receptor are widely expressed throughout the central nervous system, both on neurons and glia cells (157, 158). Data from cultured neurons as well as animals lacking the insulin receptor or IGF-1 have established a role for the insulin/IGF-1 signaling machinery in the regulation of neuronal survival (159-162).
Insulin and IGF-1 have been demonstrated to regulate phosphorylation of the microtubule associated protein Tau. Hyperphosphorylated Tau represents a hallmark of neurodegenerative diseases such as Alzheimer’s disease (AD) as it constitutes the major protein of neurofibrillary tangles (for review see (163)). Moreover, increasing evidence indicates a direct effect of insulin and IGF-1 on the metabolism and clearance of β- amyloid (Aβ) (164, 165), the deposition of which leads to the formation of neuritic plaques, a second key player in the pathogenesis of AD. Along this line, it could be demonstrated that IGF-1 treatment rescues neuronal apoptosis caused by a mutant form of the amyloid precursor protein (166). Mice with neuron-specific deletion of the insulin receptor gene exhibit hyperphosphorylation of Tau, presumably due to reduced activity of the AKT serine threonine kinase, resulting in disinhibition of glycogen synthase kinase (GSK)-3β, a well-characterized Tau kinase (160). Nevertheless, brain- specific insulin receptor knockout mice fail to develop progression towards overt neurodegeneration and impaired learning.
Clinically, epidemiological studies clearly indicate the link of systemic insulin resistance, type 2 diabetes mellitus and AD. Therefore, neuronal insulin resistance might represent a risk factor, resulting in at least one of the biochemical hallmarks of Alzheimer’s disease. On the other hand, given the ability of insulin to bind to the IGF-1 receptor and unaltered IGF-1 receptor signaling in brain-specific insulin receptor knockout mice, these experiments have left the question unaddressed, whether or not IGF-1 receptor signaling provides a compensatory mechanism in the presence of brain- specific deletion of the insulin receptor gene.
Beside the regulation of neuronal growth and survival, insulin has been demonstrated to modulate energy homeostasis, presumably through its signaling in the hypothalamus, particularly in the arcuate nucleus of the hypothalamus (for review see (167)). Mice with brain-specific deletion of the insulin receptor exhibit an increased bodyweight (134). Nevertheless, the contribution of neuronal IGF-1 receptor signaling in the regulation of these processes has so far not been analyzed.
In conclusion, there is strong evidence for the contribution of insulin and IGF-1 signaling in the regulation of neuronal growth and survival as well as the regulation of food intake and peripheral glucose metabolism. The proposed analysis of IGF-1 receptor signaling in mediating these effects will therefore reveal novel insights into the pathogenesis of neurodegenerative diseases as well as obesity and type 2 diabetes mellitus.
1.7.2 IGF-1 Signaling in Learning and Memory Formation
Many clinical syndromes including Alzheimer’s disease, semantic dementia, schizophrenia or cerebral trauma, among others, are associated with disorders of learning and memory. One of the major structures involved in learning and memory formation is the hippocampus. It is required for the formation of declarative memory, meaning facts or events that can be consciously verbalized, as well as spatial memory, which is responsible for retaining information on surroundings and spatial orientation.
The integrity of the hippocampus has been shown to decline with age (168, 169).
More frequent and more intense stimuli are then required to induce long-term potentiation (LTP), the molecular basis of memory formation. Cognitive deficits arising with old age appear to be the result of dysfunctions in neuronal circuits and synaptic plasticity, whereas neuronal cell death is apparently not influenced.
Throughout adulthood, new neurons are continuously generated in the brain, specifically in the subventricular zone and the dentate gyrus of the hippocampus (for review see (170)). Hippocampal neurogenesis can be modulated by various factors including hormones, neurotransmitters or environment (171) and, like memory formation, has been demonstrated to decline with age (172). Several studies have linked neurogenesis with the formation of some types of hippocampus-dependent memories (173). IGF-1 has been implicated in synaptic plasticity and neurogenesis and, like memory formation and adult neurogenesis, is downregulated in an age-dependent manner (for review see (174)). Intracerebroventricular infusion of IGF-1 in aging animals ameliorates the decline in neurogenesis observed with senescence (175). In line with these studies, Ames dwarf mice, which display increased hippocampal IGF-1 protein expression, live longer than normal animals and do not suffer from age-induced decline in cognitive function (176), revealing IGF-1 as a promising candidate in the regulation of conventional hippocampal neurogenesis.
1.8 Objectives
To study central insulin action and insulin resistance in the pathogenesis of type 2 diabetes mellitus in adult mice and to circumvent the problem of compensatory changes in the presence of insulin resistance during development, we opted for a time- controlled approach to gene inactivation. To this end, mice were generated with an inducible whole body insulin receptor deficiency and an inducible insulin receptor knockout restricted to peripheral tissues of adult mice. The comparison of the phenotypes of both models allows the observation of consequences of acutely induced insulin resistance for the first time in adult mice and serves as a model for discerning the effects of peripheral versus whole body insulin resistance in the adult mouse.
An additional aim of the current project was to address the contribution of the insulin-like growth factor 1 receptor signaling in the regulation of energy homeostasis and peripheral glucose metabolism, neuronal survival and learning and memory formation by generating and analyzing mice with a neuron-specific inactivation of the IGF-1 receptor gene by conditional mutagenesis.
2 Material and Methods
2.1 Chemicals
Size markers for agarose gel electrophoresis (Gene Ruler DNA Ladder Mix) and for SDS-PAGE (Prestained Protein Ladder Mix) were obtained from MBI Fermentas, St. Leon-Rot, Germany. RedTaq DNA Polymerase and 10 x RedTaq buffer were purchased from Sigma-Aldrich, Seelze, Germany.
Chemical Supplier
α-[32P]-dCTP Amersham, Freiburg, Germany
ε-aminocaproic acid Sigma-Aldrich, Seelze, Germany
2-Deoxy-D-[1-14C]-Glucose Amersham, Freiburg, Germany
Acetone KMF Laborchemie, Lohmar, Germany
Acrylamide Roth, Karlsruhe, Germany
Agarose (Ultra Pure) Invitrogen, Karlsruhe, Germany
Amyloglucosidase Roche, Mannheim, Germany
Aprotinin Sigma-Aldrich, Seelze, Germany
Benzamidine Sigma-Aldrich, Seelze, Germany β-Mercaptoethanol (β-ME) AppliChem, Darmstadt, Germany Bovine serum albumin (BSA) Sigma-Aldrich, Seelze, Germany
Bradford reagent Bio-Rad, Munich, Germany
Bromphenol blue Merck, Darmstadt, Germany
Chloroform Merck, Darmstadt, Germany
D-[3-3H]-Glucose Amersham, Freiburg, Germany
Desoxy-Ribonucleotid-Triphosphates (dNTPs) Amersham, Freiburg, Germany Dextran sulfate AppliChem, Darmstadt, Germany Dimethylsulfoxide (DMSO) Merck, Darmstadt, Germany Dithiothreitol (DTT) Boehringer, Mannheim, Germany Doxycycline Hyclate Sigma-Aldrich, Seelze, Germany Enhanced Chemiluminscence (ECL) Kit Perbio Science, Bonn, Germany Ethanol, absolute AppliChem, Darmstadt, Germany Ethidium bromide Sigma-Aldrich, Seelze, Germany Ethylendiamine tetraacetate (EDTA) AppliChem, Darmstadt, Germany Fetal Calf Serum (FCS) Gibco BRL, Eggenstein, Germany