Dr. Marcus Dengler Meteor cruise M120
M120, Recife – Walvis Bay
October 17th to November 18th 2015 4th Weekly Report, November 8th, 2015
This afternoon, Meteor reached the 18°S section (Fig. 1) and we were able to successfully recover a bottom shield moored at 125m depth on the shelf. In the past week, our measurement programme focussed on observing the variability of the eastern boundary circulation and water mass variability along the sections perpendicular to the continental slope at 6°S and 15°S and on the redeployment of moorings and a bottom shield as part of the eastern boundary transport array along 11°S. Additionally, we performed microstructure measurements at the CTD stations using a turbulence probe.
Glider measurements at the Angola-Benguela Front
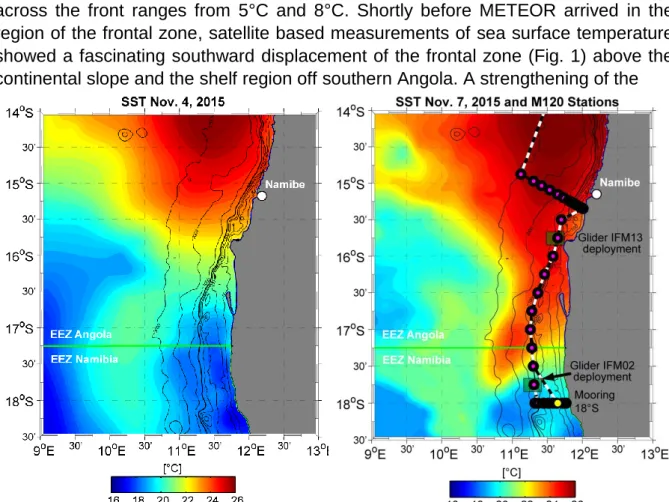
A focus of our observational program is to determine the variability of the hydrographic properties and the circulation in the Angola-Benguela frontal zone. The front separates warm waters to the north from cold surface waters to the south. Its meridional positions varies between 15°S and 18°S and a temperature difference across the front ranges from 5°C and 8°C. Shortly before METEOR arrived in the region of the frontal zone, satellite based measurements of sea surface temperature showed a fascinating southward displacement of the frontal zone (Fig. 1) above the continental slope and the shelf region off southern Angola. A strengthening of the
Fig. 1.: Sea surface temperature from November 4th (left panel) and November 7th 2015 (right panel) from satellite observations. The southward displacement of the front resulted in a sea surface temperature increase of more than 5°C in the region of the continental slope and shelf from 15°30’S to 17°30’S.
Dr. Marcus Dengler Meteor cruise M120
trade winds accompanied the southward displacement of the front. Our CTD and underway-CTD measurements along the warm water tongue (Fig. 1, right) indicated that the elevated temperatures were limited to a 20m-thick surface layer. We are now looking forward to obtaining results from the analysis of the ocean-atmosphere heat and freshwater fluxes on both sides of the front that can be calculated from METEORs on board sensors. To advance understanding of the variability of ocean- atmosphere interactions and ocean feedback processes in the frontal region, we are deploying two gliders that will survey the frontal region along meridional transect in the next 30 days. One glider was already deployed in the northern region on Saturday; the deployment of the second glider will follow on Monday. The autonomous observatories will collect data on climate-relevant parameters such as variability of mixed-layer depth and heat content and stratification in the thermocline as well as variability of water masses and currents. Additionally, one of the gliders carries a turbulence probe that will be used to quantify mixing and turbulent heat and freshwater fluxes. The other glider has an additional nitrate sensor attached and will survey the variability of nutrient concentration across the front.
Mixing at the continental margins
A second focus of our measurement program is investigating turbulent mixing processes in the Angolan and Namibian upwelling regions. Mixing processes just below the surface mixed layer impact the mixed-layer heat and freshwater budgets. Using microstructure measurements, we can quantify the flux of heat and freshwater due to turbulent mixing from the surface mixed layer to the deeper ocean. Furthermore, the turbulence data set will be used to investigate mixing processes along the continental margins of Angola and Peru. Due to interactions with the sloping topography at the continental slopes, energy from the ocean tides is transferred to turbulence leading to elevated turbulent dissipation in those regions (Fig. 2).
During the upcoming week, we will complete the 18°S section (Fig. 1) and work along a similar meridional section along 20°S. Both of these sections are surveyed on a regular basis by our Namibian colleagues and partners within EU-PREFACE project from the National Marine Information and Research Center (NatMIRC) in Swakopmund, Namibia.
Best regards from the tropical South Atlantic
Marcus Dengler and the participants of the M120 cruise
Fig. 2.: Dissipation rate of turbulent kinetic energy (left panel) and turbulent eddy diffusivities (in m2s-1, right panel) along the 6°S section. Elevated turbulence is found near the sea surface and near the ocean floor.