Dr. Marcus Dengler Meteor cruise M120
M120, Recife – Walvis Bay
October 17th to November 18th 2015 3nd Weekly Report, November 1st, 2015
After transiting for 11 days we reached Angolan waters on Wednesday afternoon and started the work on a cross-slope section at about 11°S. An integral component of the eastern boundary current system here is the Angola current, a poleward undercurrent usually observed at the continental slope. It carries nutrient-rich and oxygen-poor water masses from the eastward currents near the equator poleward.
Using a mooring array as well as transects oriented perpendicular to the coastline, we aim at determining the strength of the circulation and intraseasonal to interannual variability of the transport and the hydrographic properties of the Angola Current.
Additionally, coastally trapped waves propagate poleward along the eastern boundary of the tropical Atlantic. These signals are often forced at remote location, such as the western equatorial Atlantic, from where they propagate eastward along the equator before propagating poleward along the coast. In the upwelling regions of Angola and Namibia their presence may lead to variability of the sea surface temperature which in turn affects climate variability.
Mooring work off Angola along 11°S
During METEOR cruise M98 in July 2013, nearly 2 ½ years ago, two moorings and two bottom shields were deployed at the 11°S transect. Due to several different circumstances, the moored equipment could not be serviced as scheduled last year.
We are thus relieved to have recovered most of our instruments after the unexpectedly long deployment period. The two most important components of the array, a bottom shield deployed at 500m (Fig. 1) and a mooring deployed at 1200m depth were recovered. We were particularly pleased by the fact that all recovered instruments had recorded data during the whole deployment period.
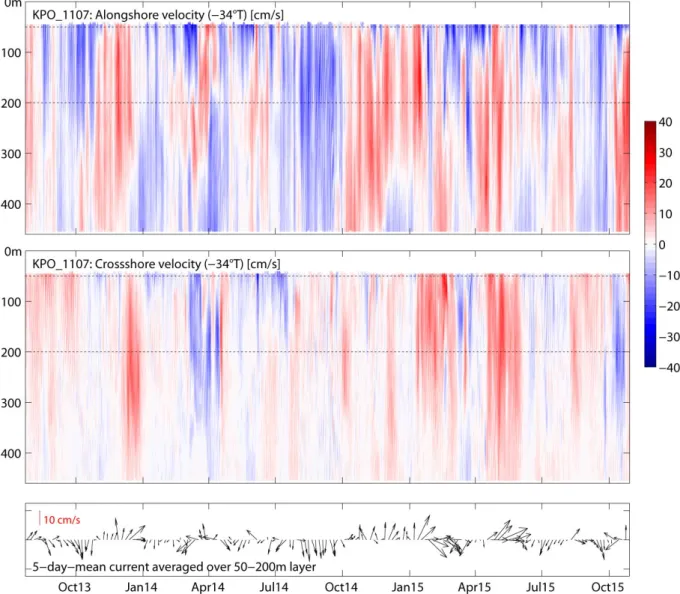
Two 2.5-year time series of horizontal velocity from acoustic Doppler current profilers in the 1200m mooring and the bottom shield, both delivered velocity data from the upper 500m of the water column (Fig. 2). The velocity time series show a pronounced semi-annual cycle in the flow along the Fig. 1: Recovery of a bottom shield deployed at 500m
depth along 11°S. (Photo: Toralf Henne)
Dr. Marcus Dengler Meteor cruise M120
eastern boundary. Additionally, prolonged periods of equatorward flow are indicated.
The time series also reveal strongly elevated intraseasonal variability of the currents that are likely caused by the presence of coastally trapped waves. A remarkable characteristic of the intraseasonal variability is that several of these structures exhibit decreasing velocities towards the surface suggesting that these signals cannot be seen by satellite altimetry. We are convinced that the two velocity time series will be adequate to determine transport variability at the eastern boundary of Angola. They will allow quantification the strength and the variability of the Angola current for the first time and thus provide important information on the generation of variability of sea surface temperature and water mass variability in the upwelling regions. Moreover, the time series will provide new constraints on the drift of larvae and juvenile fish – important information for fisheries research in the upwelling regions of Angola and Namibia.
Fig. 2: Time series of the flow parallel to the continental slope (upper panel), across the continental slope (middle panel) and horizontal velocity vectors at 11°S. The time series was recorded by acoustic Doppler current profiler mounted to the mooring deployed at 1200m depth at 13°E (see Fig. 3 for mooring position)
Dr. Marcus Dengler Meteor cruise M120
Velocity and hydrographic measurements along the 11°S transect
Measurements along the 11°S transect complementing the moored observations include hydrographic and oxygen profiles (CTD/O2), turbulence measurements in the water column and continuous shipboard velocity profiles from the vessel mounted Ocean Surveyors. Additionally, the water samples from the CTD rosette were analysed for concentration of nutrients and samples for the analysis of trace gases (N2O and CH4) were prepared. The shipboard velocity data revealed interesting aspects of the eastern boundary circulation: While the alongshore velocity structure at 11°S during the M98 cruise in July 2013 showed a weak poleward Angola Current attached to the continental slope between 50 and 200m depth (Fig. 3), the observed flow structure was very different this time. Instead of poleward flow, elevated equatorward flow in the upper 500m of the water column at the continental slope persisted during the section occupation period. The contrasting flow of these two realisations illustrates the enhanced variability of eastern boundary circulation that is also reflected in the velocity time series from the mooring and the bottom shield.
The measurement program at 11°S was completed yesterday evening. Currently, we are steaming toward the 6°S transect. Shortly before leaving 11°S we deployed a glider with a turbulence probe attached that will continue to sample data along the 11°S transect for the next month. The glider positions as well as the collected data can be viewed online at http://gliderweb.geomar.de.
Best regards from the tropical South Atlantic
Marcus Dengler and the participants of the M120 cruise
Fig. 3: Alongshore flow at 11°S transect during M98 in July 2013 (left) und during M120 (right).