Inaugural-Dissertation
zur
Erlangung des Doktorgrades
der Mathematisch-Naturwissenschaftlichen Fakultät
der Universität zu Köln
vorgelegt von
Jayan Nandanan Nair
aus Kerala, Indien
Köln, Februar 2008
1. Berichterstatter:
Prof. Dr. Maria Leptin
2. Berichterstatter:
Prof. Dr. Siegfried Roth
Tag der mündlichen Prüfung: 28 April 2008
Table of Contents
1. INTRODUCTION ...4
1.1 Tubulogenesis and branching morphogenesis - a general overview ...4
1.2 Tracheal morphogenesis in Drosophila...4
1.3 Terminal branch development in Drosophila larvae ...7
1.4 Unique aspects of terminal branch development...9
1.5 Localized translation as a means for targeting proteins and maintaining developmental plasticity ...11
1.6 RNA localization in development ...12
1.7 Mechanisms of RNA localization...13
1.7.1 Localized degradation...13
1.7.2 Diffusion and localized entrapment ...13
1.7.3 Active transport along the cytoskeleton...14
1.8 Role of Untranslated Regions (UTRs) of mRNA in gene regulation...14
1.9 Techniques for visualizing mRNA...15
1.9.1 MS2-GFP labeling system ...16
1.10 A genetic screen for localized RNAs in Drosophila tracheal cells ...18
1.11 Aim of the project ...18
2. MATERIALS AND METHODS...19
2.1 Materials ...19
2.1.1 Drosophila melanogaster stocks...19
2.1.2 UAS Transgenes ...19
2.1.3 Gal4 drive lines...19
2.1.4 EP-MS2 Transgenes ...20
2.1.5 Mutants ...20
2.1.6 Antibodies used ...20
2.1.7 Primers...20
2.1.8 Sequencing primers for pUAST vector...20
2.1.9 Inverse PCR primers...20
2.1.10 Plasmids used for generating transgenes ...21
2.1.11 Microscopes used...21
2.1.12 Imaging and data analysis software ...21
2.1.13 Reagents...21
2.2 Methods...22
2.2.1 Fly maintenance and embryo collection ...22
2.2.2 Antibody staining...22
2.2.3 Larval immuno-stainings ...22
Table of Contents
2.2.4 Molecular biology...23
2.2.5 EP-MS2 construct...23
2.2.6 NLS-MS2-eGFP constructs ...23
2.2.7 Inverse PCR protocol...24
2.2.8 Electron microscopic studies ...24
Transmission electron microscopy ...24
Scanning electron microscopy ...25
3. RESULTS ...26
3.1. Terminal branch development in larvae...26
3.1.1 Categorization of terminal branches based on lumen diameter ...26
3.1.2 Lumen diameter decreases along the Proximal-Distal Axis from the nucleus...29
3.1.3 Cell diameter varies along the proximal-distal axis from the nucleus ...30
3.2 Translational and co-translational machinery is present in terminal branches ...31
3.2.1 Transmission Electron microscopic studies to analyze ribosome and ER ...32
3.2.2 Immuno-histochemical studies to visualize ribosome, ER and Golgi bodies in terminal branches ...33
3.2.3 Poly (A) binding protein localizes in terminal branches...35
3.3 A genetic screen for localized RNA in tracheal cells ...36
3.3.1 Combining the MS2-GFP labeling system with the EP technique ...37
3.3.2 Generating transgenes and fly reagents for the screen...38
3.3.2.1 Modifying the EP transposon and generating EP-MS2 transgene ...38
3.3.2.2 Generating UAS-NLS-MS2-GFP transgenic flies ...40
3.3.2.3 Recombining UAS-NLS-MS2-GFP with btl-Gal4 ...41
3.3.2.4 Hopping efficiency of the EP-MS2 insertion on the X chromosome...42
3.4 A pilot screen to evaluate the EP-MS2 technique ...43
3.4.1 Phenotypic classification of the EP-MS2 lines based on pilot screen...44
3.4.2 Evaluating the EP-MS2 technique in the developing oocyte...47
3.4.3 Testing the EP-MS2 technique in dendritic arborization (da) neurons ...48
3.4.4 MS2-GFP tagged candidate mRNA does not accumulate in stress granules...49
3.5 Molecular mapping of the EP-MS2 element insertion in candidate lines...51
3.6 Characterization of a candidate gene from the EP-MS2 screen...53
3.6.1 bitesize - a Synaptotagmin-like protein family gene in Drosophila...53
3.6.2 Functional characterization of bitesize in terminal tracheal branch development ...56
3.6.3 Bitesize localizes at the apical membrane in terminal branches ...58
3.6.4 C-terminal C2 in Bitesize is required for its membrane localization ...59
3.6.5 Par3/Bazooka localization in terminal branches...61
3.6.6 Par6, aPKC and Crumbs localization in terminal branches ...62
3.6.7 Phosphorylated Moesin localizes at the apical membrane facing the lumen in terminal branches ...66
3.6.8 Function of Moesin in terminal branches ...67
4. DISCUSSION ...71
Table of Contents
1. Terminal branch patterning - a carefully orchestrated process...71
2. Localized translation and developmental plasticity of terminal branches ...72
3. The EP-MS2 technique - a novel method of screening for localized RNAs...73
4. Candidate Characterization: bitesize, a determinant for lumen formation and stability in terminal branches? ...75
5. Abnormal terminal branches in bitesize mutant larvae ...76
5. BIBLIOGRAPHY...80
6. APPENDIX...92
6.1 List of genes involved in tracheal morphogenesis...92
6.2. Measurements from Type-A and Type-B branches: Data set 1 and data set 2. ...93
6.3 Measurement along the proximal-distal axis of Type-A branch: Data set 3.94 6.4 Lumen and cell diameter measurements from the same positions in Type-A branches: Data set 4...95
ABBREVIATIONS...97
ABSTRACT...98
ZUSAMMENFASSUNG ...99
EIDESSTATTLICHE ERKLÄRUNG ...101
LEBENSLAUF...102
Introduction
1. Introduction
1.1 Tubulogenesis and branching morphogenesis - a general overview
Organogenesis is a complex process involving global changes in cell populations in terms of their proliferation, migration, differentiation and shape. Many vertebrate organs are tubular organs and consist of branched networks of interconnected tubes. The tubular organs in higher vertebrates include the lungs, vasculature, digestive and excretory systems, as well as secretory organs such as the pancreas, salivary, prostate, and mammary glands. Other tissues, including the embryonic heart and neural tube, have requisite stages of tubular organization early in development. The Drosophila tracheal system, equivalent to the vertebrate lung, has been extensively used as a model for investigating molecular and cellular bases of how cells are organized into tubular organs of various shapes and sizes. A particularly interesting aspect in Drosophila tracheal morphogenesis is the development of a subset of branches known as the terminal branches. The development of terminal branches is not pre-patterned, but is regulated by oxygen physiology, a phenomenon similar to angiogenesis in mammals. Events like the de novo tube formation in terminal branches and branch sprouting at positions distant from the nucleus, regulating the development of these dynamic branches have not been studied in great detail.
1.2 Tracheal morphogenesis in Drosophila
The Drosophila tracheal system is a complex network of branched and interconnected tubes that conducts oxygen from the exterior to the internal tissues.
Tracheal branches are simple tubes: an epithelial monolayer wrapped into a tube
surrounding a central lumen through which gases flow. It develops by sequential
sprouting of primary, secondary and terminal branches from an epithelial sac of ~80 cells
(known as tracheal placodes) in each body segment of the embryo and displays bilateral
symmetry. Oxygen enters the network at the spiracular openings and passes through
primary, secondary and terminal branches to reach the target tissues. Tracheal
morphogenesis in Drosophila is biphasic. The first phase of development occurs in
embryos. During this phase, cells of the tracheal placode migrate, reposition themselves,
Introduction
intercalate and fuse to form a network of interconnected tubes. This phase completes towards the end of embryonic development and results in larvae hatching with a fully functional respiratory system. During the five days of larval development, the size and length of embryonic tracheal tubes increases along with the increasing body size of the larva. A very significant aspect of tracheal development during the larval period is growth and ramification of new terminal tracheal branches in response to oxygen demands of individual targets. In the second phase, during the pupal metamorphosis, the tracheal branches undergo remodeling to meet the requirements of adult flies (Fig.1).
Figure 1. Tracheal morphogenesis from embryos to adult flies. A) The 10 tracheal placodes in a 6 hrs old embryo imaged laterally (white arrows mark four of these placodes). B) Fully developed tracheal branches in a stage 16 embryo. In A and B the tracheal cells are marked with Trachealess antibody. C and D are schematic representations of tracheal braches as seen in third instar larvae and adult flies respectively. C and D adapted from FlyMove.
The general tracheal branching program involves the Fibroblast Growth Factor
(FGF) pathway that is used repeatedly from the embryo to the adult (Metzger and
Krasnow, 1999; Sato and Kornberg, 2002; Skaer, 1997). The FGF pathway uses
branchless (bnl, which is the ligand) and breathless (btl, which is the receptor) to activate
downstream target genes required for tracheal morphogenesis. Studies have elucidated
diverse pathways and events regulating the development of tracheal tubes. Moreover a
different tubulogenesis mechanism is used at each level of branching; branching is thus
Introduction
not a strictly reiterative process. Fig. 2 highlights some of the major genetic aspects regulating tracheal development at different stages (adapted from Ghabrial et al., 2003).
Figure 2. The FGF pathway controls each step of branching. (a) branchless FGF (blue) is expressed in clusters of cells surrounding the developing tracheal system, at each position where a primary branch will bud. The secreted growth factor activates the Breathless FGFR on nearby tracheal cells (black), and acts as a chemoattractant that guides outgrowth of primary branches. It also induces expression of secondary branch genes and triggers secondary branch sprouting at the ends of outgrowing primary branches (green;
stages 12–16). branchless turns back on again, but in a completely different pattern, during larval life to control outgrowth of terminal branches. The gene is expressed yet again during pupal life where it controls budding of adult air sacs (not shown). (b) The genes that function upstream of Branchless and downstream of Breathless change during development, giving rise to different patterns and structures of branches at each step (figure adapted from Ghabrial et al., 2003).
Based on the sequence of migration and tube formation, the tracheal branches are divided into three types; the primary, secondary and tertiary (or terminal) branches. In each embryonic hemisegment six primary tracheal branches bud and migrate out first, followed several hours later by the sprouting of about two-dozen secondary branches.
Most secondary branches sprout terminal braches (tracheoles) throughout the larval life,
forming hundreds of fine terminal branches in each hemisegment. The pattern of primary
and secondary branch budding is highly stereotyped and controlled by a hardwired
Introduction
developmental program, whereas terminal branch sprouting is variable and regulated by tissue oxygen need. Further, the process of lumen formation in each type of branch is distinct. Primary branches have multicellular tubes with two to four cells surrounding the central lumen connected by intercellular epithelial junctions. In the secondary branches lumen forms as a consequence of cell wrapping around its long axis until the edges of the cell meet and seal resulting in a tube with an autocellular junction. In comparison to the lumen in primary and secondary branches the terminal branches have a junctionless lumen. It is believed that the terminal branch lumen forms as result of vesicular fusion, in the cytoplasmic extensions of terminal tracheal cells, which subsequently is connected to the lumen of the secondary branch to form a continuous tube.
1.3 Terminal branch development in Drosophila larvae
Most of the studies on tracheal development in flies have concentrated on patterning and tube formation mechanisms in embryos, but the tracheal developmental events during the larval phase is relatively unexplored. Much of the terminal branch development, though they are specified in embryos, happens during the larval phase.
Terminal branches arise as cytoplasmic extensions that grow along the surface of tracheal target tissues, much like axonal outgrowths. Subsequently an intracellular lumen forms within each extension, creating a fine junctionless tube continuous with the secondary branch from which it arises. This process of cytoplasmic extension and lumen formation repeats itself many times during the five days of larval life, generating individual terminal cells with complex branched structures and dozens of terminal branches. The branch points are regularly spaced and terminal branches do not cross over one another.
Further, these branches attach tightly to internal tissues to facilitate gas exchange (Fig.3).
The attachments are generally long lived, although under certain conditions, cellular
projections from oxygen-starved cells can bind to and redistribute nearby terminal
branches to satisfy their oxygen need (Ghabrial et al., 2003; Uv et al., 2003). Studies
have shown that each terminal cell can sprout up to 20 branches (on an average) and have
Introduction
an average lumen diameter of approximately 1μm or less (Guillemin et al., 1996;
Lubarsky and Krasnow, 2003).
Figure 3. Scanning Electron micrographs of terminal branches in third instar larvae. A) Terminal cell with terminal branches innervating the body wall muscle. The nucleus of the cell is marked with a red asterisk and the branches are marked with arrow. B) Cut end of a terminal branch, innervating the body wall muscle, showing the lumen (arrow).
The complex pattern of terminal branching is regulated by the oxygen physiology
of the target tissue. Oxygen-starved cells secrete a tracheogenic signal that can attract
new terminal branches from as far as one segment away. The tracheogenic signal
generated by oxygen-starved cells was identified as Branchless FGF. Drosophila
cognates of hypoxia-inducible factors (HIF pathway components) including the HIFα
(sima) and ß (tango) subunits have been identified (Nagao, et al., 1996; Adryan, et al.,
2000; Lavista-Llanos, et al., 2002) and they are activated by hypoxia as in the
mammalian pathway. Further, genomic analysis of HIF-responsive targets in Drosophila
larval tissues and cell culture RNAi experiments have identified branchless as one of the
targets. The effects of Branchless on terminal branching are mediated by Breathless
FGFR (Reichman-Fried & Shilo, 1995; Jarecki, et al., 1999). Studies have also revealed
an important transcription factor blistered that acts downstream of the Bnl/Btl FGF
pathway in specification and development of terminal branches. blistered encodes the
Drosophila homologue of mammalian serum response factor (SRF, a MADS domain
Introduction
transcription factor). Blistered/DSRF together with the ETS domain protein Elk-1 forms part of a transcription complex whose activity is regulated by RTK signaling and the Ras/MAPK cascade. blistered/DSRF is specifically expressed in tracheal terminal cells.
In blistered/DSRF loss-of-function mutants, cytoplasmic outgrowth and terminal branching is severely reduced, whereas constitutively active forms of SRF and Elk-1 cause excessive branch outgrowth (Affolter et al., 1994; Guillemin, et al., 1996, Montagne, et al., 1996; Treisman, R., 1994). Recent studies have implicated rhea (gene encoding Drosophila Talin), myospheroid, (βmys, the major Drosophila
β-integrin) andIKKε, a member of the IKK protein kinases having a significant role in development and maintenance of the lumen in terminal branches. rhea, βmys and IKKε were shown to be essential for proper lumen development, probably by regulating the organization of the actin cytoskeleton in the terminal branches (Oshima, et al., 2006; Levi, et al., 2006).
Excluding the above mentioned few details, the genetic regulation, cell biological, physiological and morphological changes regulating terminal branch development during the larval phase is largely unresolved.
1.4 Unique aspects of terminal branch development
Two aspects of terminal branching are of special interest and distinguish it from
the earlier stages of branching. One is that terminal branches have a distinct cellular
structure: they are extremely fine (<1µm diameter), lack junctional structures along the
length of the branch and are formed by individual cells that undergo a remarkable process
of cellular morphogenesis. Equivalent terminal cells in different larvae can form different
numbers of branches and display different patterns of branching (Fig.4). The other
distinguishing feature is that terminal branching is not stereotyped nor under fixed
developmental control. Terminal branching is highly variable and is regulated by oxygen
physiology; although variable, the pattern is not unorganized. Sprouting and outgrowth of
terminal branches is carefully regulated to meet the oxygen needs of target tissues, much
like angiogenesis in mammals. Low oxygen (hypoxia) stimulates terminal branch
Introduction
formation and high oxygen (hyperoxia) suppresses it (Wigglesworth, 1954; Locke, 1958;
Jarecki et al., 1999).
These two unique aspects of the terminal branches i.e., the cellular morphology and their development in response to oxygen physiology of target tissues distinguish them from other tracheal branches, conferring a high degree of developmental plasticity.
The terminal cells have to develop branches, efficiently and quickly, to meet the oxygen demands and a delay in this response would be critical for the target tissues. In response to hypoxic signals terminal branches are formed at distances as far as 100µm or more from the nucleus. These special attributes of terminal branch development raise a few important questions, for example, how does the terminal cell, efficiently and quickly, sprout branches away from the nucleus? How does the terminal cell make available the proteins required at the sites of outgrowth as and when required? Does localized translation contribute to supply of proteins required at the site of out growth? If so, do specific mRNAs localize in the terminal branches and are translated onsite when required?
Figure 4. Two equivalent terminal branches from two different larvae. A and B demonstrate that equivalent terminal branches can have completely different morphology. White arrows mark the branches and the position of nucleus is marked with red star.
Introduction
1.5 Localized translation as a means for targeting proteins and maintaining developmental plasticity
The extreme polarity and developmental plasticity exhibited by many cells, for example tracheal terminal cells or neurons, imposes a number of unique constraints with respect to development, growth and survival. The axon, for example, must navigate through a complex environment during its development and must form and maintain specific synaptic connections at its targets, often at a significant distance from the cell body. This raises a very important question: what is the source of axonal proteins required for its local morphological differentiation at sites far away from the cell body?
Does the cell transport proteins from the cell body to axonal growth cones or is there an alternate method of providing proteins to developing regions? Studies in the past decade have revealed that localized translation of mRNAs transported to specific subcellular locations is an alternative way of targeting proteins to micro-domains within a cell (Fig.
5). Substantiating this possibility, a number of mRNAs have been reported in axons, growth cones and in dendrites of mammalian neurons, a few examples are βactin, BC1, FMR1,
αCaMKII and GluR1 (Gottlieb, 1990; Job and Eberwine, 2001; Martin, 2004).There is a growing body of evidence that such localized protein synthesis provides a
means for developmental plasticity. Localized protein synthesis provides a polarized cell
with the capacity to regulate its structure and function, by spatially restricting gene
expression within cells. The mechanism underlying both the localization of these RNAs
and the regulation of their translation are beginning to be delineated in a variety of
systems.
Introduction
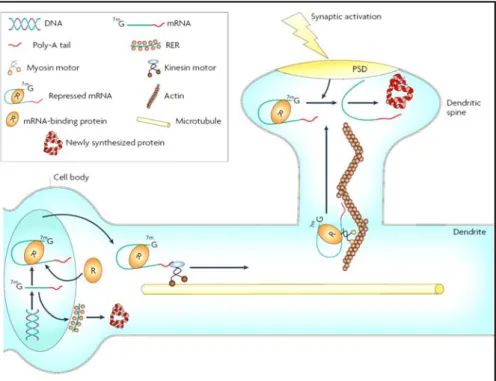
Figure 5. mRNA localization and subsequent translation in dendritic spines. Image adapted from Bramham and Wells, 2007.
1.6 RNA localization in development
Eukaryotic cells regulate gene expression at multiple levels including
transcriptional, post-transcriptional and translational levels. Studies in the past few years
have elucidated an essential step in gene regulation involving RNA localization and the
translational activation of the localized RNA. This allows cells to spatially control protein
function by determining their sites of synthesis. The localization of RNAs occurs in a
wide range of organisms, including fungi (e.g. Ustilago maydis), plants (Arabidopsis),
and various animal species (e.g. ascidians, echinoderms, Drosophila, zebrafish, Xenopus,
and mammals). Further, studies suggest that RNA localization occurs in many cell types
and regulates distinct functions ranging from the control of body axis formation to
learning and memory. The targeting of RNAs to specific microdomains within a cell
begins with the nascent mRNA being co-transcriptionally packed with trans-acting
proteins into messenger ribonucleoprotein particles (mRNPs). Subsequently they are
exported from the nucleus through nuclear pores. In the cytoplasm the mRNP is then
delivered to its target cytoplasmic destination (St Johnston, 2005; Jansen and Kiebler,
Introduction
2005). At the target site, the mRNP is anchored and upon receiving the appropriate signal, the complex is remodeled to relieve translational repression and the mRNA is locally translated (Czaplinski and Singer, 2006).
1.7 Mechanisms of RNA localization
mRNAs can be localized by a variety of mechanisms such as diffusion and localized anchoring, local protection from degradation or active transport by motor proteins along the cytoskeleton.
1.7.1 Localized degradation
In Drosophila, several RNAs localize to the precursors of the germ cells (pole cells) in the embryo, for example hsp83 mRNA. In the fertilized egg, hsp83 mRNA is uniformly distributed but as the nuclear divisions advance, hsp83 mRNA is degraded except in the pole plasm where the RNA is protected (Ding et al., 1993). Not much is known about the machinery required for stabilizing hsp83 RNA in the pole plasm, although in some mutants (e.g. smaug) degradation of hsp83 RNA is not triggered and consequently localization does not occur.
1.7.2 Diffusion and localized entrapment
Diffusion and entrapment allows for the localization of Xcat2 and Xdazl mRNAs to the vegetal pole during early stages of oogenesis in Xenopus (King et al., 2005). At stage one of oogenesis, the RNAs localize to a structure called the mitochondrial cloud (MC), which lies next to the nucleus. This RNA localization seems not to involve active transport, since microtubule depolymerization has no effect on mRNA localization.
Further, studies have shown that Xcat2 and Xdazl transcripts localize to the MC through
diffusion and association with the ER within the cloud and do not involve active transport
(Chang et al., 2004). Localization of mRNA through a similar mechanism has been
reported for nanos mRNA (Xcat2 and Xdazl related Drosophila gene) localization at the
posterior pole in the developing oocyte (Santos and Lehmann, 2004; Forrest and Gavis,
2003).
Introduction
1.7.3 Active transport along the cytoskeleton
Active transport is the most commonly used mechanism for RNA localization.
Molecular motors which move directionally along the cytoskeleton and are widely used to traffic organelles and other cargoes, are used by RNAs to reach their destination within the cytoplasm. Localized transcripts are selected from the general population of RNAs because of the presence of specific localization sequences in them (Fusco et al., 2003).
These specific signal sequences (cis-acting elements) in localizing RNA are recognized by trans-acting factors that recruit motor proteins that move along the cytoskeleton towards the final destination. A few examples for actively transported RNAs are Ash1 mRNA in yeast, wingless, bicoid, oskar in Drosophila and Vg1 mRNA in Xenopus (Wilkie and Davis, 2001; St Johnston, 2005; Deshler et al., 1997; Czaplinski, K and Mattaj, 2006).
1.8 Role of Untranslated Regions (UTRs) of mRNA in gene regulation
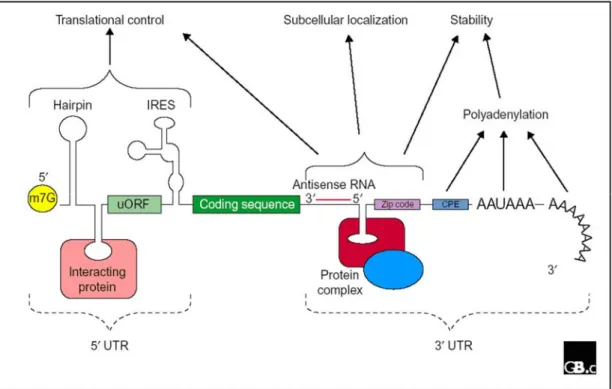
The untranslated regions (UTRs) of mRNAs play crucial roles in the post- transcriptional regulation of gene expression, including modulation of the transport of mRNAs out of the nucleus and in translation efficiency, subcellular localization and stability. Motifs contained within the UTRs of many mRNAs serve as information for the specific placement of that transcript within the cytoplasm and for the timing of its translation. Such localization signals contain discrete stem loops structures that associate with a particular combination of RNA binding trans-acting factors, determining the composition of the RNP complexes and site of localization of the transcripts. This can be achieved by recruiting specific molecular motors, influencing the activity of motors, dictating a mode of anchoring as well as promoting or preventing degradation (Fig. 6).
Generally, such cis-acting localization signals are placed in the 3’UTRs of localizing
transcripts, although in a few exceptions, signals are also found in the 5’UTR or in the
exons (Gottlieb, 1990 and 1992; Mignone et al., 2002; Wickens et al., 1997; Hamilton,
and Davis, 2007).
Introduction
Figure 6. A schematic describing the functional relevance of untranslated regions of mRNA in post- transcriptional gene regulation. Schematic adapted from Mignone et al., 2002
1.9 Techniques for visualizing mRNA
Two approaches are widely used to detect localized RNA. The earliest and most
used method is in situ hybridization, predominantly with labeled RNA probes. One
glaring limitation of in situ hybridization as an experimental approach is that the material
is fixed and hence dynamic processes cannot be followed directly. Secondly, the signal-
to-noise ratio can be high, affecting the sensitivity of the assays. These limitations could
be alleviated by the injection of fluorescently labeled RNA. The RNA can be tagged
using fluorescent nucleotides during in vitro transcription. Live cell imaging has provided
the ability to track the movements of such fluorescently tagged RNA. As endogenous
RNA cannot be visualized using this method, the labeled non-functional RNA serves as a
surrogate marker for the bona fide localization pathway. While this approach provides a
good approximation for the various steps in the localization pathway, it may well miss
out on certain fronts. The first is that the RNA destined for localization may actually be
recognized by the cellular machinery in the nucleus, where the RNA is first synthesized
Introduction
and the injected RNA bypasses this process of biogenesis. The pre-mRNA or mature transcripts may bind to a protein required, for instance, for translational repression or assembly with a motor. Naked RNAs microinjected into the cell form complexes with proteins, but these may not be identical to those forming under endogenous conditions.
Second, RNAs may be structurally modified when they are tagged with a fluorochrome.
Specific proteins that identify ‘zipcodes’ in the RNA may not bind properly to such modified RNAs, possibly allowing binding by non-specific proteins. A third problem is that microinjection of RNA may not recapitulate either the timing or the level of its endogenous expression (Bratu, 2003; Singer, 2003).
1.9.1 MS2-GFP labeling system
To investigate the dynamics of mRNA movement a new technique, the MS2-GFP
labeling system, was developed a few years ago, which allows tracking specific mRNAs
in real time in live cells. The MS2-GFP labeling system utilizes the high affinity
interaction between sequence-specific RNA stem-loops (MS2 protein binding sites) and
the bacteriophage capsid protein MS2. Incorporation of multiple repeats of the MS2
stem-loops into an RNA sequence of interest creates an interaction platform capable of
binding to multiple MS2 proteins. When coupled to GFP (MS2-GFP fusion protein),
MS2 protein that binds to the MS2 stem loops carrying RNA tags the RNA with GFP,
thus enabling visualization of the RNA in vivo. The simultaneous expression of a MS2
stem-loop containing mRNA and the MS2-GFP in cells provides a powerful method for
detecting specific mRNP complexes (Fig. 7, modified from Bertrand et al., 1998). A
solution to the signal to noise problem, while tracking specific mRNAs within the
cytoplasm, is provided by a Nuclear Localization Signal contained within the MS2-GFP
protein. The Nuclear Localization Signal sequesters MS2-GFP within the nucleus when
not bound to an MS2-containing RNA target. The high affinity interaction between the
stem-loop sites and the MS2 protein ensures that most reporter mRNAs are bound by a
number of MS2-GFP fusion proteins and that the majority of GFP signal emanates from
bona fide target transcripts. Importantly, the mRNAs generated from this reporter are
Introduction
transcribed in the nucleus and are properly packaged, exported, targeted, and translated, making MS2-GFP a good system to track mRNAs from their sites of synthesis to translation.
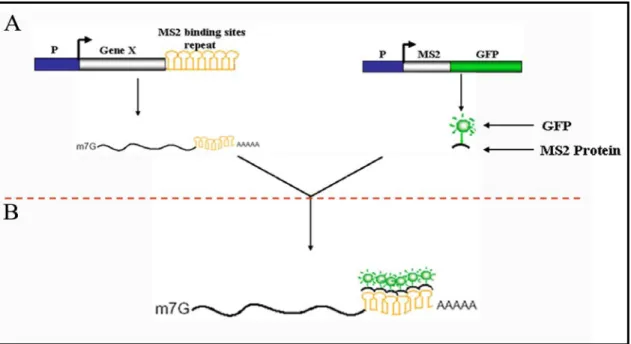
Figure 7. Schematic describing the MS2-GFP labeling system. A) MS2-GFP labeling is a two component system. The gene of interest is tagged with MS2 protein binding site stem loop sequence. The second component is the MS2 protein fused to GFP. B) When both the components are expressed in a cell, the MS2-GFP fusion protein binds to the stem loop (MS2 binding sites) and consequently the GFP tagged mRNA can be visualized and tracked in the cell. Image modified from Bertrand et al., 1998.
The MS2-GFP labeling technique was initially used in yeast (Bertrand et al.,
1998) and in cultured mammalian cells and later adapted in Drosophila for tracking RNA
localization in tissues. To visualize localization of nanos mRNA in vivo in the
Drosophila oocyte, Forrest and Gavis used the MS2-GFP labeling system (Forrest and
Gavis, 2003). In this study the RNA of interest, nanos, was synthesized from a transgene
into which binding sites for the fusion protein had been inserted. The MS2-GFP fusion
protein, the second component of the reporter system, was provided from another
transgenic fly. The modified and MS2-GFP tagged nanos RNA behaved similar to
normal endogenous RNA, at least in the localization studies. The authors, using the MS2-
GFP labeling system, show features of nanos mRNA localization previously unseen.
Introduction 1.10 A genetic screen for localized RNAs in Drosophila tracheal cells
The high degree of developmental plasticity exhibited by terminal branches raise the interesting question whether their development is regulated by localized translation at the site of branch growth. If so, a prerequisite is localization of specific RNAs to sites of branch outgrowth. To study if RNAs localize asymmetrically in terminal tracheal cells we decided to perform a genetic screen. In this screen the localizing RNAs will be visualized by making use of the MS2-GFP labeling system, which provides an efficient means for visualizing RNAs in vivo. To visualize transcripts of randomly tagged genes in the Drosophila genome, we decided to combine the MS2-GFP labeling system with the modular miss-expression system, the EP technique. The existing EP transposon element will be modified by introducing MS2 binding sites downstream of the promoter that initiates expression of the neighboring gene. The transgenic lines generated from the modified EP insertion would then be screened using a tracheal specific Gal4 Driver (breathless-Gal4) in conjunction with a second transgene encoding the NLS-MS2-GFP.
This screen would essentially combine the advantages of a conventional EP screen, including analysis of over expression phenotypes, cloning of the gene by plasmid rescue and mutagenesis by P element excision, with visualization of mRNA localization.
1.11 Aim of the project
The aim of my thesis project is to develop a genetic technique that can be used for
screening RNAs exhibiting specific subcellular localization in Drosophila. Using this
technique, I sought to identify asymmetrically localizing RNAs in terminal tracheal cells
and to study the functional relevance of RNA localization in the regulation of terminal
branch development.
Materials and Methods
2. Materials and Methods
2.1 Materials
2.1.1 Drosophila melanogaster stocks Wild type flies used were Oregon R.
2.1.2 UAS Transgenes
From Bloomington stock centre
w[1118]; P{w[+mC]=UAS-Btsz2-Poly}2;+/+
w[1118]; P{w[+mC]=UAS-Moe.IR.327-775}3 w[1118]; P{w[+mC]=UAS-Moe.TD.MYC}2
w[1118]; P{w[+mC]=UAS-Moe-GFP.K}2 w[1118]; P{w[+mC]=UAS-GFP.KDEL}11.1/Cyow[1118]; P{w[+mC]=UAS-GFP.KDEL}15.2/TM6B, Tb[1]
From other sources
w[1118]; ;P{w[+mC]=UAS-RpS2L315-TAP} (From Stefan Luschnig) w[1118]; P{w[+mC]=UAS-PABPL423-TAP}; +/+ (From Stefan Luschnig) w[1118]; P{w[+mC]=UAS-Fng.DXDM917-MYC}; +/+ (From Mathew Freeman)
w[1118]; P{w[+mC]=UAS-Btsz2-∆C2-HA}2;+/+ (From Thomas Lecuit) w[1118]; P{w[+mC]=UAS-NLS-MS2-eGFP
67};+/+ (Generated for this work) 2.1.3 Gal4 drive lines
w[1118]; P{w[+mC]=btl-Gal4}; +/+
w[1118]; +/+; P{w[+mC]=btl-Gal4}
w[1118]; If/Cyo; P{w[+mC]=btl-Gal4}
w[1118]; If/Cyo; P{w[+mC]=btl-Gal4, UAS-GFP}
w[1118]; If/Cyo; P{w[+mC]=btl-Gal4, UAS-DsRed}
w[1118]; P{w[+mC]=btl-Gal4, UAS-MS2-e GFP
67}; +/+
w[1118]; +/+; P{w[+mC] vp16:nanos-Gal4, UAS-MS2-GFP}/TM3 Ubx-LacZ
w[1118]; P{w[+mC]= krupple-Gal4}/CyO; +/+
Materials and Methods
2.1.4 EP-MS2 Transgenes
w[1118], P{w[+mC]=EP-MS2 (6X binding sites)};; (Generated for this work) w[1118] ;P{w[+mC]=EP-MS2 (12X binding sites)} (Generated for this work) w[1118], P{w[+mC]=EP-MS2 (24X binding sites)};; (Generated for this work)
2.1.5 Mutants
w;;btsz
K13-4/TM3Sb KrGal4-UAS-GFP
w;;FRT82B btsz
J5-2/ TM3Sb KrGal4-UAS-GFP 2.1.6 Antibodies used
Following primary antibodies were used; rat anti-HA (1:100, Boehringer Mannheim), rabbit anti-Dof (1:20, Vincent et al., 1998), rabbit anti-P Moe (1:50, Cell Signaling), rabbit anti-Pac (1:500, Gift from S. F. Newbury), rabbit anti-DCP-1 (1:10, Ming-Der Lin, 2006), rabbit anti-DCP-2 (1:200, Ming-Der Lin, 2006), rabbit anti-Baz (1:200, Kuchinke U. et al., 1998), rabbit anti-Par6 (1:100, Petronczki, M. & Knoblich, J. A., 2001), rabbit anti-aPKC (1:200, Santa Cruz), rabbit anti-PolyG (1:50, Cell Signaling) and rabbit anti- GFP (1:500, Torrey Pines Biolabs Inc). Flourochrome conjugated secondary antibodies;
Alexa468 and Alexa568 and Alexa647 (Molecular Probes) were used at a dilution of 1:500.
2.1.7 Primers
GCAGCGGCCGCAGTGAGCAAGGGCGAGGAGC eGFP 5 prime CGTCTAGATTACTTGTACAGCTCGTCCATGCC eGFP 3 prime 2.1.8 Sequencing primers for pUAST vector
GAAGAGAACTCTGAATAGGGAATTGG pUAST 5 prime GGTAGTTTGTCCAATTATGTCAC pUAST 3 prime 2.1.9 Inverse PCR primers
GTAACGCTAATCACTCCGAACAGGTCACA Pwht1
Materials and Methods
CACCCAAGGCTCTGCTCCCACAAT Plac1 CCTTAGCATGTCCGTGGGGTTTGAAT Pry1 CTTGCCGACGGGACCACCTTATGTTATT Pry2 CAATCATATCGCTGTCTCACTCA Pry4 ACACAACCTTTCCTCTCAACAA Sp1
GACACTCAGAATACTATTC Spep1
2.1.10 Plasmids used for generating transgenes
pUAST (Brand A. and Perrimon N., 1993), EP vector (Rorth P., 1996), 2.1.11 Microscopes used
Leica TCS SP2, Zeiss Axioplan 2-imaging, Zeiss Apotome and Leica M2 16FA were used for microscopy. Quantix (Photometrix) and Axiocam HRm (Zeiss) cameras were used for imaging.
2.1.12 Imaging and data analysis software
Images acquiring software Leica Confocal Software LCS, Axiovision Rel 4.6 (Zeiss) and Axiovision 1 (Zeiss) were used. Images were edited using Adobe Photoshop (Adobe Systems) and ImageJ software. DNA sequence alignments, analysis and oligonucleotide designing were done using the VectorNTI.
2.1.13 Reagents
TritonX 100, Tween20 and BSA were purchased from Sigma. Vectashield mounting
media for fluorescent samples were from Vector Laboratories. Restriction enzymes used
were from New England Biolabs. Expand High Fidelity PCR system was supplied by
Roche Diagnostics GmbH. Agarose electrophoresis grade was from Gibco BRL. Unless
otherwise mentioned, all the other chemicals were purchased from Merck, Sigma or
Roth.
Materials and Methods 2.2 Methods
2.2.1 Fly maintenance and embryo collection
The flies were maintained under standard conditions (Ashburner, 1989; Wieschaus and Nuesslein-Volhard, 1986)
To fix the embryos, properly staged embryos were collected on an apple juice – agar plate, dechorionated using 50% bleach and washed in tap water. Embryos were fixed in 4% Formaldehyde in PBS:heptane (1:1) solution at room temperature for 20 minutes, with vigorous shaking followed by devitellinization with methanol:heptane (1:1) solution by vortexing for half a minute. Embryos were washed several times in methanol and stored in methanol at -20
0C if not used immediately.
2.2.2 Antibody staining
The fixed embryos were rehydrated in PBST, followed by one hour blocking at room temperature using 1% BSA in PBST. The liquid phase was taken off and the primary antibody was added. The reaction was left at 4
0C overnight. Embryos were washed with PBST several times, at room temperature followed by incubation in secondary antibody (biotin labeled or Alexa flurochrome conjugates) at room temperature for 90 minutes.
The secondary antibody was washed away by PBST. After incubation in Alexa secondary antibodies the embryos were washed thoroughly in PBST. The embryos were mounted in Vectashield (Vector Laboratories) and taken for microscopy.
2.2.3 Larval immuno-stainings
3
rdinstar larvae were filleted and fixed with 4% paraformaldehyde for 20 minute. Post
fixation fillets were washed with 0.1% PTX (1XPBS+ 0.1 % TritonX 100) three times for
10 min each followed by 1 hour incubation in blocking reagent (1XPBS+ 0.1 % TritonX
100 + 1% BSA). After blocking the fillets were incubated overnight in antibody solution
at 4
oC. Fillets were washed 4 times (15 minutes each) in 0.1% PTX after overnight
incubation. Fillets were incubated in Alexa flourochrome conjugated secondary
Materials and Methods
antibodies for 2 hours at room temperature. Next, the fillets were washed for two hours at room temperature, mounted in Vectashield (and taken for microscopy.
2.2.4 Molecular biology
Standard molecular biology techniques were used for cloning (Sambrook et al., 1989).
2.2.5 EP-MS2 construct
The EP-MS2 constructs were generated by modifying the EP vector (Rorth, 1996). Three EP-MS2 constructs were cloned (EP-MS2 6X, EP-MS2 12X and EP-MS2 24X). MS2-BS (6 BS and 24 BS) fragments were digested from pSL-MS2 plasmid (Singer, 1999) using BamH1 and Nsi1 enzymes. The protruding BamH1 and Nsi1 overhangs were blunted using T4 DNA polymerase. The EP vector was digested with Pst1 enzyme and was blunted using T4 DNA polymerase and the MS2 BS fragment was blunt-end ligated into the Pst1 site in the EP Vector. The EP-MS2 constructs were transformed into DH5 α cells and subsequently the colonies were screened for positive clones. The positive EP- MS2 clones were digested with Not1 enzyme and the Kanamycin resistance gene was cloned into the Not1 (the EP vector has an Ampiciline resistance gene). The addition of Kan Res gene is the plasmid rescue feature of the vector. The construct was transformed and colonies that were both Kan and Amp positive were selected. The positive clones were confirmed by restriction digestion using Not1 and Bgl2 enzymes prior to injection to generate transgenes.
2.2.6 NLS-MS2-eGFP constructs
The NLS-MS2 coding sequence was digested, using BamH1 and Not1 enzymes, from NLS-MS2-GFP construct (NLS-MS2-GFP cloned in pUASp, Filardo, P., unpublished construct). The eGFP coding sequence was PCR amplified from pBI eGFP plasmid using the following primers; 5’ GCAGCGGCCGCAGTGAGCAAGGGCGAGGAGC 3’ (with Not1 overhang and does not include the initiation codon ATG) and 3’
CGTCTAGATTACTTGTACAGCTCGTCCATGCC 5’ (with Xba1 overhang). The
pUAST vector was digested with Bgl2 and Xba1 enzymes and the NLS-MS2 fragment
Materials and Methods
along with the PCR amplified eGFP fragment was ligated into Bgl2/Xba1 site in the pUAST vector. The cloned constructs were transformed into DH5 α and colonies were screened for positive clones. The positive clones were confirmed by sequencing and the transgenic constructs were injected.
2.2.7 Inverse PCR protocol
Inverse PCR protocol from BDGP (http://www.fruitfly.org/about/methods/inverse.pcr.) was used for molecular mapping of EP-MS2 insertions. From each line genomic DNA was isolated from adult flies and they were digested with either HnP1 or MsP1 were used. The digested DNA was allowed to self ligate to circular plasmid. Self ligated plasmids would have fragments from the either the 5prime or 3prime of EP-MS2 element together with the flanking genomic sequences. The self ligated plasmid were then used as the template for a PCR reaction with specifically designed primers (Pry1, Pry2, Pry4, PLac1 and Pwht1) that would amplify the region including the inverted repeat of the transposon insertion along with the immediate flanking genomic region. The amplified PCR product was then sequenced with specific sequencing primers (Sp1 and Spep1) and the sequences were subjected to Blastn analysis to locate them in the genome.
2.2.8 Electron microscopic studies Transmission electron microscopy
Third in star larvae were dissected in PBS, and immediately fixed for 20 minutes at room temperature in 4% paraformaldehyde/PBS. Fillets were postfixed for 1 hour in 0.5%
glutaraldehyde followed by 1 hour in 1% osmium tetraoxide and stained overnight in 0.5% uranyl acetate at room temperature. Samples were kept in 2% osmium tetraoxide, 0.5% uranyl acetate (prepared from a 20% stock solution in methanol) and 0.5%
glutaraldehyde. After washing with acetone the samples were transferred into an
acetone-Epon mixture (1:1 for 4 h, 1:2 for 12 h), at room temperature followed by
incubation in Epon (3 changes 10 min each) and polymerised at 60 C for 48 h. Fillets
were sectioned using microtome and the sections (100nm) were stained with 2% uranyl
Materials and Methods
acetate in 70% methanol for 10 min and in 0.4% lead citrate in 0.1 N NaOH for 2 min were viewed in a Philips CM10 electron microscope at 60 kV.
Scanning electron microscopy
For scanning electron microscopy fillets were fixed for 20 minutes in 4%
paraformaldehyde followed by 1 hour fixation in 0.5% glutaraldehyde at 4
OC. The fillets
were incubated in osmium treated (1% osmium tetraoxide in 100 mM phosphate buffer,
pH 7.2), dehydrated through an ethanol series, subjected to critical point drying from
CO2 and sputter coated with 10 nm Au-Pd. Samples were examined at 20 kV
accelerating voltage in a Hitachi S800 field emission scanning electron microscope.
Results
3. Results
3.1. Terminal branch development in larvae
Most of the studies carried out in tracheal development in flies have concentrated on patterning and tube formation mechanisms in embryos. The tracheal developmental events during the larval phase, when most of the terminal branching occurs, are almost entirely unexplored. I started by analyzing the morphological characteristics of terminal branches in third instar larvae.
3.1.1 Categorization of terminal branches based on lumen diameter
Terminal branches undergo extensive ramification during larval development, resulting in widespread coverage of target tissues with oxygen supplying blind-ended tubes. Studies in Rhodnius prolixus have illustrated that the terminal branch lumen has a diameter of 0.7 to 1μm or less at its origin and tapers over its length to a blunt end of 0.1 to 0.3μm (Wigglesworth, 1954). Lumen diameters of Drosophila terminal branches were also described to be similar (Wigglesworth and Lee, 1982). While this description holds good, a closer look at the terminal branches reveals that lumen diameter varies not only along its length (from proximal to distal positions from the nucleus) but also in different branches.
The terminal tracheal cells exhibit different terminal branching patterns;
nevertheless one does see a general pattern of terminal branching vaguely resembling
the pattern of veins in a feather. In general, terminal cells have branches, usually one
or two, growing to a length of approximately 200μm and have an average lumen
diameter of approximately 1μm or less. Along the length of these branches, new
branches that have thinner lumen diameter develop. In addition to these extensions,
one can also observe fine filopodial extensions devoid of lumen, arising from random
positions along the branches (Fig. 8). In order to evaluate the differences in lumen
diameter in different branches and along the proximal-distal axis, I have categorized
branches into Type-A and Type-B. Type-A category consists of branches with the
widest lumen diameter and Type-B branches have a thinner lumen diameter. Figure 9
is a schematic explaining this categorization of terminal branches based on lumen
diameter.
Results
Figure 8. Terminal branches from a third instar larva. The Red asterisk marks the nucleus of the terminal cell. White arrows mark different types of branches. The continuous arrow shows a branch with bigger lumen diameter than the ones marked with dotted arrows. The arrowheads mark filopodial extensions.
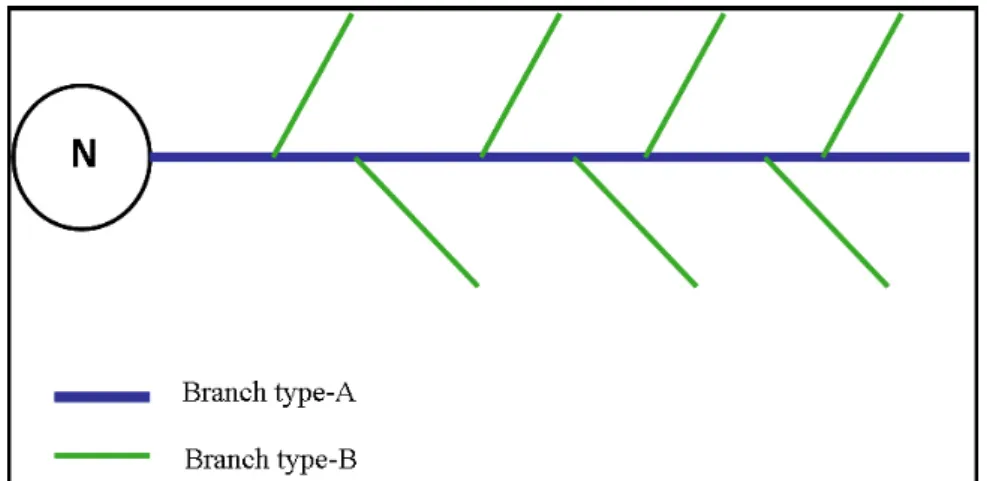
Figure 9. Schematic representation of terminal branches categorized based on lumen diameter.
The circle with ‘N’ represents the nucleus. The thick blue line represents the Type-A branch with widest lumen (axial stem). The green line represents bifurcated Type-B branches, with thinner lumen diameter.
To evaluate the lumen diameters of Type-A and Type-B branches,
measurements were taken from six different terminal cells. Two data sets were made
with lumen diameters measured at random positions along the Type-A and Type-B
branches. From each terminal tracheal cell at least four measurement points on the
Type-A branches along the Proximal-Distal axis and six measurement points from
three different Type-B branches were taken (Fig. 10). A total of 33 measurements for
Results
Type-A branches and 37 measurements for Type-B branches were gathered and sorted as data set-1 and data set-2 (data sets in appendix) respectively.
Figure 10. Schematic depicting the positions along the Type-A and Type-B branches from a single terminal cell, where measurements were taken for statistical analysis. A) Measurement points along the Type-A branch. B) Measurement points on the Type-B branches.
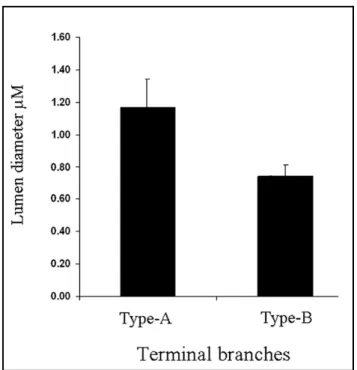
The data sets were subjected to statistical analysis and the median values and standard deviation, for the measurements of each of the data set were calculated. Data set-1 and data set-2 had the median values of 1.17μm and 0.74μm respectively (Appendix). The standard deviation for measurements within each data set was 0.17 for data set-1 and 0.07 for data set-2; both values were within the permissible range.
The standard deviations suggest that although the lumen diameter varies within each
type of branch, the variation is not very high. Further, the difference in lumen
diameter between Type-A and Type-B branches was about 37%; in other words the
Type-B branches had lumen diameter 37% thinner than the Type-A (Fig. 11).
Results
Figure 11. Difference in lumen diameter of terminal branches. The graph illustrates the difference in lumen diameter between Type-A and Type-B branches. There is significant difference in lumen diameter between the two types of branches. The diameter of Type-B branches is 37% thinner than Type-A.
3.1.2 Lumen diameter decreases along the Proximal-Distal Axis from the nucleus
Analyses were also done to study if the lumen diameter is constant along the
proximal-distal axis of Type-A branches. For this experiment, six groups of
measurements taken along the proximal-distal axis of Type-A branches from six
different cells, were used (data set-3 Appendix). Data set-3 was analyzed to study
whether the variation in lumen diameter within the Type-A branches occurred
randomly or exhibited a pattern along the proximal-distal axis. In the first set of
analyses measurements (P
1….Pn) from each of the six groups were plotted in a graph
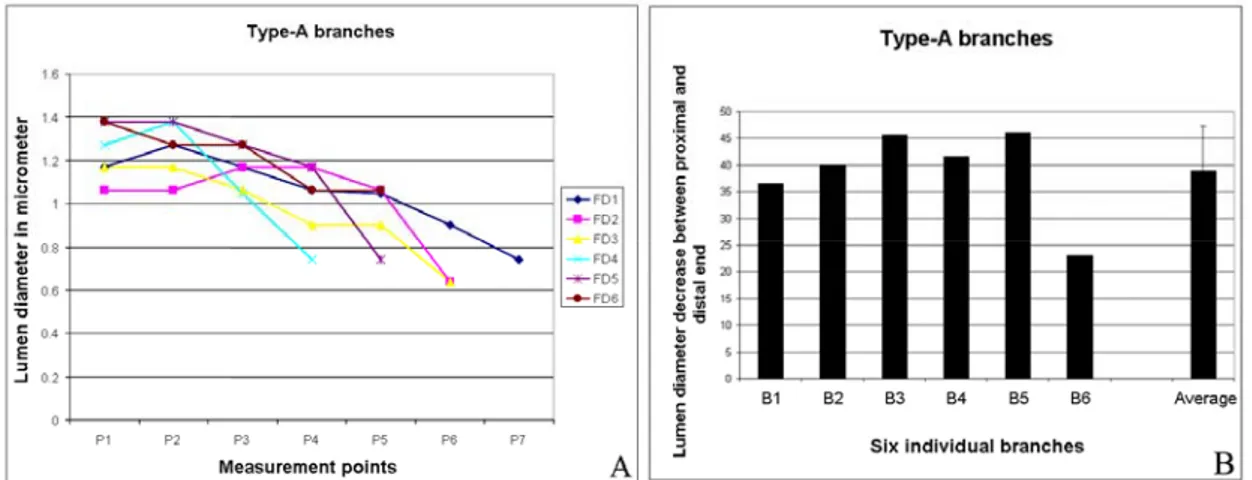
(Fig. 12A). The data showed that the lumen diameter decreases from the proximal to
the distal end. Further, the data also shows that though the diameter decreases from
the proximal end to distal end it does not always occur in a progressive manner. The
percentage fall (percentage decrease) in lumen diameter between the proximal end
and the distal end was also determined (Fig. 12B). The percentage fall was
determined by comparing the difference in lumen diameter in percentages, between
the most proximal and distal measurements (P1 and Pn) from each group. The results
Results
clearly showed that the lumen diameter is not constant along the length and decreases progressively in Type-A branches, with the difference being 38%.
Figure 12. Lumen diameter decreases along the proximal-distal axis of Type-A branches. A, Plot diagram representing the lumen diameter along the proximal-distal axis of 6 different branches. B, The bar diagram shows the difference (in percentage) in lumen diameter between the most proximal and most distal end from the six groups of data. B1-B6 represents 6 Type-A branches. The average percentage fall in lumen diameter between the two ends in Type-A branches is about 38%.
3.1.3 Cell diameter varies along the proximal-distal axis from the nucleus
Experiments done to analyze the lumen diameter in terminal branches had revealed that the diameter varies between Type-A and Type-B branches and also along the proximal-distal axis in Type-A branches. To study whether there is any correlation between the cell diameter and the lumen diameter in terminal branches, I have analyzed the cell diameters in the terminal branches. For this analysis, measurements of lumen diameter and the cell diameter (from the same positions) along the proximal-distal axis of Type-A branches from six different terminal cells were used (data set-4 appendix). Altogether, 33 measurements of lumen diameter and corresponding cell diameter from six branches were included in data-set 4. The median value of the lumen diameters measured was 1.17μm and the standard deviation between the individual measurements was within the permissible range (SD:
0.213). The cell diameter measurements, 33 measurements corresponding to 33 lumen
diameters, had a median value of 3.71μm, but in this case the standard deviation was
significant with a value of 1.11. The data suggests that there is a considerable degree
of variation in the cell diameter when compared with the lumen diameter in Type-A
branches (Fig. 13A). Further, when the cell diameter measurements are plotted in a
Results
graph it was clear that there is no apparent pattern in the cell diameter variation and it is random along the proximal-distal axis of the branches (Fig. 13B).
Figure 13. Comparison of lumen diameter versus cell diameter of terminal branches. A, Median values of lumen and cell diameters measured at the same positions in six Type-A branches. The lumen diameter has a median value of about 1.17μm. The cell diameter had a median value of 3.71μm. The standard deviation in this case was significant, indicating considerable variation within the set of measured cell diameters. B, Cell diameter measurements from six branches (CD1-CD6). P1…Pn measurements form six points along the proximal-distal axis from six branches. The graph demonstrates that the cell diameter along the proximal-distal axis in the branches has no apparent pattern and the variation is random.
3.2 Translational and co-translational machinery is present in terminal branches
The main objective of my thesis project was to identify RNAs that
asymmetrically localize in the terminal tracheal cells. The screen was based on the
assumption that some of the proteins required at the site of outgrowth are synthesized
locally rather than near the nucleus. For translation to occur in sites of outgrowth, at
significant distances from the nucleus, these sites would have to contain components
of the translational and co-translational machinery. Subcellular organelles such as
ribosomes, polysomes, endoplasmic reticulum (ER) and Golgi bodies are present in
axonal growth cones and pre and/or post synaptic regions in dendrites, where
localized translation occurs (Black and Lasek, 1977; Giuditta et al. 1977; Giustetto et
al. 2003; Martin et al. 1998; Steward and Levy, 1982). I have characterized the
subcellular distribution of the above mentioned cellular organelles in terminal
branches in third instar larvae.
Results
3.2.1 Transmission Electron microscopic studies to analyze ribosome and ER Transmission electron microscopic (TEM) studies were carried out to analyze the distribution of subcellular organelles in the terminal branches. Fillets of third instar larvae were sectioned at random positions and selected cross-sections containing terminal branches were imaged and analyzed. Based on the diameter of the lumen in the electron micrograph, it was possible to assess whether the sections were from Type-A or Type-B branches. Micrographs with sections of Type-B branches were analyzed, since Type-B branches are more distant from the terminal cell nucleus.
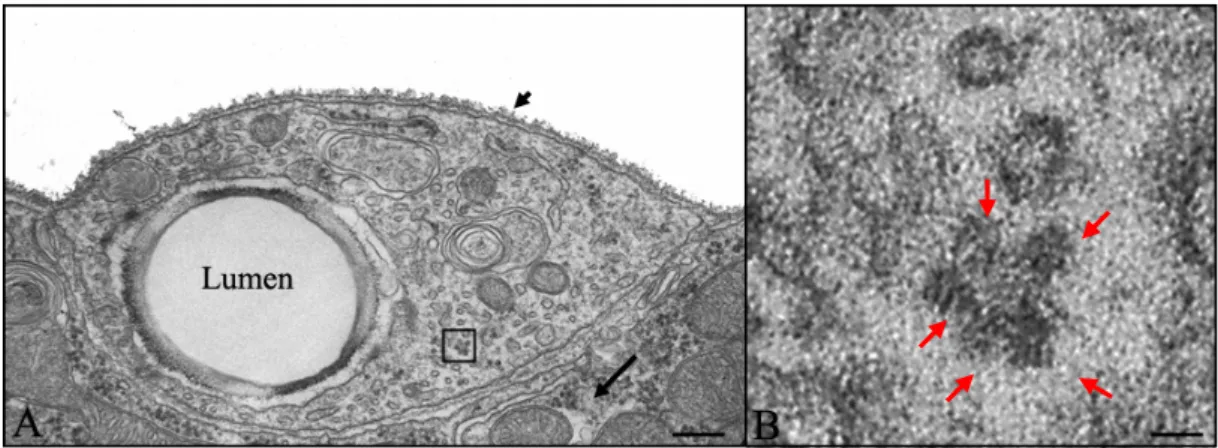
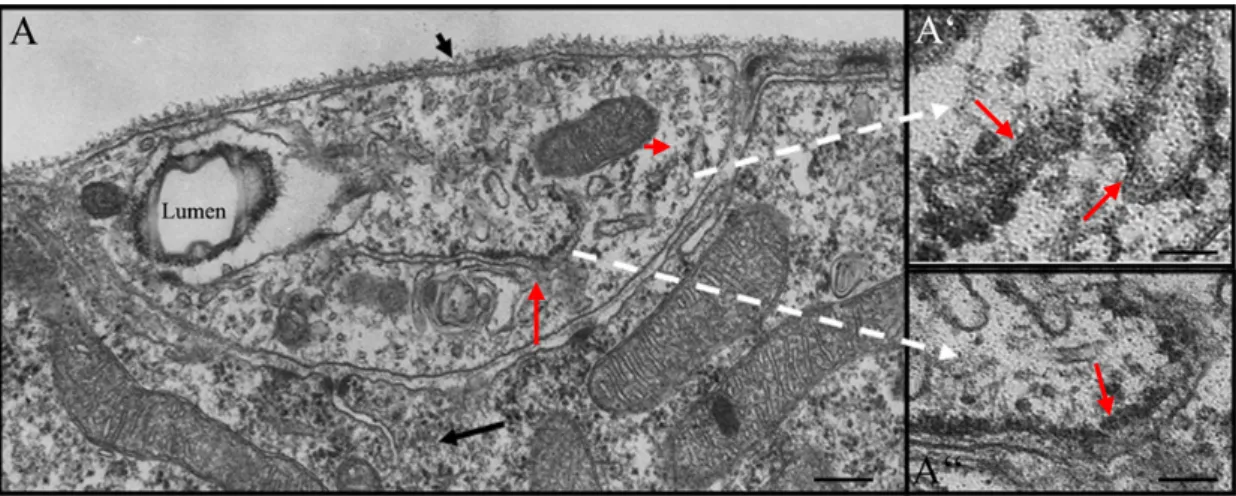
The TEM studies revealed that ribosomes are present in the cytoplasm of the terminal branches. Further, both cytosolic and ER associated polysomes were observed in these micrographs (Fig. 14A and B). Analysis of EM micrographs also showed that both smooth and rough ER is present in the terminal branches (Fig. 15A and A’’). A few, small, “swollen” rough ER was also observed in some of the sections. Such swollen rough ER is usually a consequence of the ER lumen being filled with freshly translated protein (Fig. 15A’). The presence of free cytoplasmic ribosomes, the polysomes and the ER is an indication that the conditions for translation to occur exists in the terminal branches, away from nucleus.
Figure 14. Electron micrograph of a section through Type-B terminal branch. A, Cross-section of Type-B terminal branch. The lumen in the section is a hollow cavity (marked as Lumen) towards a side of the section. The small black arrow shows the basal lamina encapsulating the branch. The long black arrow marks the underlying muscle in which the branch is embedded. The black box encloses a cytosolic polysome. B) The area within the black box is enlarged in B. The five red arrows mark the ribosomes that are part of polysomes. Scale bars: 1.19μm in A and 60nm in B
Results
Figure 15. Electron micrograph of a section through Type-B terminal branch. A, The lumen in the section is hollow cavity towards a side of the section. The small black arrow shows the basal lamina encapsulating the branch. The long black arrow marks the underlying muscle on which the branch is juxtaposed. The black box encloses a cytosolic polysome. The red arrows mark the rough ER. A’, Blow up shows two small blotted rough ER, marked with red arrows. A’’, is a blow up of the rough ER (marked with red arrow) visible in A. Scale bars: 1.19μm in A and 230nm in A’ and A’’.
3.2.2 Immuno-histochemical studies to visualize ribosome, ER and Golgi bodies in terminal branches
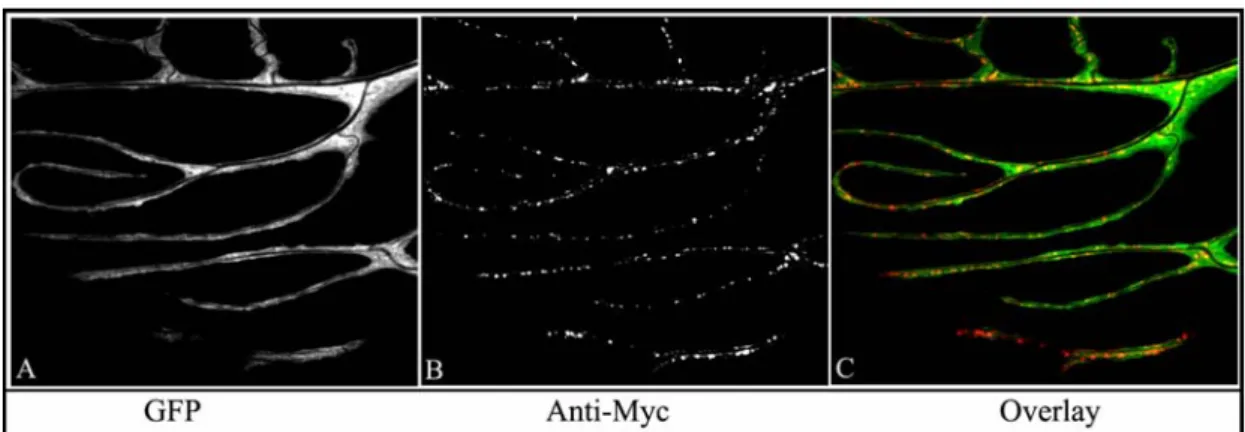
In addition to the TEM studies, I analyzed the distribution of the translational and co-translational machinery by immuno-staining experiments. To analyze ribosome distribution in the terminal branches, a TAP tagged UAS-RpS2 transgene was expressed in the tracheal cells using the tracheal specific btl-Gal4. Drosophila RpS2 codes for a protein which is a constituent of the small ribosomal subunit. The over-expressed TAP tagged RpS2 protein was visualized by immuno-stainings using Rabbit (IgG)-anti-goat Alexa antibodies (Fig. 16). The TAP-RpS2 protein was seen in the terminal branches at positions distant from the nucleus, substantiating the findings of from the TEM studies.
Figure 16. Ribosomes localize in terminal branches away from the nucleus. A, TAP-RpS2 localization in terminal branches. B, Cytosolic GFP labeling the terminal branches. C, Overlay
Results
Next, I looked at the distribution of ER and Golgi bodies in terminal branches.
The ER distribution was studied by analyzing the distribution of KDEL-GFP fusion protein (GFP fused to the KDEL peptide sequence) expressed in tracheal cells. The KDEL motif functions as an ER retention signal in many ER resident proteins and GFP fused to the KDEL peptide sequence is a reliable marker for visualizing ER. The results show that the over-expressed GFP-KDEL protein is present throughout the terminal cell cytoplasm and did indeed extend into the terminal branches (Fig. 17).
The Golgi localization in terminal branches was assessed next. To visualize the Golgi, the distribution of a Myc tagged Fringe protein (Munro and Freeman, 2000) was expressed in tracheal cells together with cytosolic GFP. Drosophila Fringe is a Golgi- localized glycosyltransferase. A single amino acid substitution in the Fringe protein abolishes its function but does not affect its localization in Golgi bodies and this modified form of Fringe can be used as a Golgi marker. The modified Fringe-Myc protein, expressed in the terminal cells, was visualized by immuno staining against Myc. Golgi bodies, like ER, are seen distributed throughout the terminal cell, well into the terminal branches (Fig. 18). The results from these immuno-histochemical experiments substantiate the findings from the TEM studies and confirm the presence of translational and co-translational machinery in terminal branches.
Figure 17. ER distribution in terminal branches was visualized by expressing KDEL-GFP fusion protein in tracheal cells. A shows the distribution of ER in terminal tracheal cells and terminal branches. The nucleus of the cell is marked with N (in red). B, a few terminal branches showing the distribution of ER.
Results
Figure 18. Golgi body distribution in terminal branches in third instar larva. UAS-Fng-Myc was expressed in tracheal cells together with cytosolic GFP. A, cytosolic GFP. B, Myc tagged Fringe protein labeling the Golgi. C, Overlay of GFP and Myc-Fringe sin the terminal branches.
3.2.3 Poly (A) binding protein localizes in terminal branches
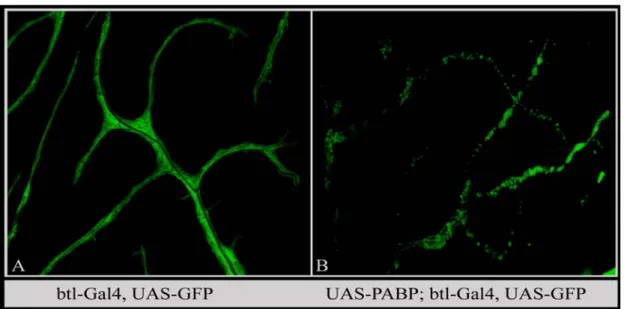
If localized translation regulates the development of terminal branches, then one would expect specific RNAs to localize in these branches. RNA binding proteins should therefore be present in the terminal branches along with the RNA that they are bound to or interact with. Hence, the presence of RNA binding protein in these branches could be taken as an indirect evidence for the presence of localized RNA. I have looked at the distribution of the Poly(A) binding protein (PABP) in the terminal branches. PABP is a general RNA binding protein that binds to the poly-A-tail of mRNAs and regulates different aspects of mRNA biogenesis (David et al., 2003). To visualize PABP in terminal branches, a TAP tagged cytoplasmic PABP was expressed together with a cytosolic GFP. Over-expression of PABP in tracheal cells resulted in an abnormal phenotype. In the PABP over-expressed larvae, the terminal branches were present but the distribution of cytoplasmic GFP was abnormal and in aggregates (Fig. 19). Nevertheless, it was possible to look at the distribution of TAP-PABP in this condition. The over-expressed PABP was present in the terminal branches.
Compared to GFP, the PABP distribution appeared to be less diffused and more in
granules or small aggregates. Such a distribution, i.e. in granules or small aggregates,
very likely reflects the RNA bound PABP, since mRNAs that are actively transported
are also clustered into granules. Figure. 20A illustrates the distribution of over-
expressed TAP-PABP in terminal branches and Figure. 20B shows the growing tip of
a terminal branch with PABP in granules.
Results
Figure 19. TAP tagged PABP over-expression in tracheal cells. UAS-PABP-TAP and UAS-GFP were expressed in tracheal cells using btl-Gal4. A, GFP (cytosolic) marking the terminal branches. GFP is diffused throughout the cytoplasm of terminal branches. B, Expression of PABP-TAP results in abnormal aggregates of cytosolic GFP.
Figure 20. TAP tagged PABP over-expression in tracheal cells. A and B shows the GFP distribution in terminal branches where PABP is expressed. A’ and B’ shows PABP-TAP localization in the same branch as A and B. A & B, GFP is not uniformly distributed in the cytoplasm. A’ & B’, PABP-TAP is seen in granules (white arrows). A’’ and B’’ are overlay.
3.3 A genetic screen for localized RNA in tracheal cells
On the assumption that some of the proteins required at the site of growth in
the terminal branches are synthesized locally rather than near the nucleus, we decided
Results
to perform a screen for localized RNAs in the tracheal cells. To investigate if specific RNAs localize in terminal branches, we have developed a new technique, the EP-MS2 technique. The strategy was to tag RNAs with GFP in vivo and to track the localization of such tagged RNA in the Drosophila terminal tracheal cells. For the screen, three transgenic fly reagents namely EP-MS2 transgenes, UAS-NLS-MS2- eGFP transgenes and breathless-Gal4 driver were necessary, and were generated.
3.3.1 Combining the MS2-GFP labeling system with the EP technique
In order to screen for asymmetrically localizing RNAs, we have combined the MS2-GFP labeling system with the EP technique. The EP technique (modular mis- expression system) is based on the inducible expression of genes tagged by insertion of a P-element vector carrying a GAL4 regulated promoter. In such screens, a transgene encoding the transcriptional activator GAL4 is expressed in specific tissues (“GAL4 driven lines”) to induce the expression of “target lines” harboring P-elements in random positions. These “target lines” carry an EP-element (Fig. 21), which has GAL4 binding sites that activate a promoter close to the 3prime inverted repeat of the P element in the vector. Binding of GAL4 induces the promoter within the EP element and leads to the expression of the gene downstream to the insertion site. The GAL4 dependent transcription begins within the P-element and extends out in to the genomic region that happens to lie next to the insertion (Rorth, 1996). This EP technique takes advantage of the fact that the P-element preferentially integrates into 5prime ends of genes and thus allows the expression of essentially full-length transcripts.
Figure 21. Schematic of the EP transposon Vector. The schematic represents the essential features of the EP transposon vector within the three and five prime inverted repeats of the P element. In addition the vector also has an ampicilin resistance cassette in the vector backbone, outside the P element inverted repeats. Within the P element inverted repeats a Gal4 inducible promoter (Gal4 binding sites and a basal promoter) is positioned close to the three prime inverted repeat. A
Results
transcriptionally independent white gene (the selectable marker) is positioned towards the five prime inverted repeat. In addition the EP element has Su(Hw) sites and GAGA sites as insulator sequences and a plasmid rescue site within the inverted repeats. Image adapted form Rorth, 1996.