A genetic screen for novel genes involved in tracheal development in
Drosophila melanogaster
I n a u g u r a l - D i s s e r t a t i o n zur
Erlangung des Doktorgrades
der Mathematisch-Naturwissenschaftlichen Fakultät
der Universität zu Köln
vorgelegt von Magdalena Baer
aus Poznan, Polen
Köln, Dezember 2006
Berichterstatter/in: Prof. Dr. Maria Leptin Prof. Dr. Siegfried Roth
Tag der mündlichen Prüfung: 15 Februar 2007
Table of content
1. Introduction………..1
1.1. Development of Drosophila tracheal system………..1
1.2. Architecture of tracheal branches………3
1.3. Morphogenesis of tracheal branches……….………. 5
1.3.1. Primary branches………..5
1.3.2. Secondary branches………..5
1.3.3. Fusion cell formation………6
1.3.4. Terminal branching………..7
1.4. Control of tracheal tube size………9
1.4.1. Genes involved in tube elongation control………...9
1.4.2. Genes involved in tube diameter control………10
1.4.3. Model of tube size regulation……….10
1.5. Clonal analysis with MARCM system………..11
1.6. The aim………..13
2. Material and Methods………..………..14
2.1. Materials……...……….14
2.1.1. Antibodies……….………..13
2.1.2. Fly stocks…….………...13
2.1.3. General reagents and equipment………14
2.2. Methods……….14
2.2.1. Mutagenesis and establishing of the stocks………14
2.2.2. MARCM analyses………...…….…..15
2.2.3. Complementation test……….16
2.2.4. Embryonic analyses………16
2.2.4.1 Embryo collection and fixation……….………..16
2.2.4.2 Immunostaining………...……16
2.2.5 Immunostaining of third instar larvae………..……….17
2.2.6 Survival test………17
2.2.7 Mapping of chosen mutants………18
2.2.7.1 SNP mapping………..18
2.2.7.2 Deficiency mapping………22
2.2.7.3 Sequencing of candidate genes………...22
3. Results………26
3.1. MARCM screen………26
3.2. Phenotypic classes………....28
3.2.1. Group A – no clones………..28
3.2.2. Group B – low number of clonal cells………...28
3.2.3. Group C – small clonal cells………..28
3.2.4. Group D – dorsal trunk defects………..30
3.2.5. Group E – terminal branching phenotypes………....32
3.3. Complementation test………...38
3.3.1. Complementation test for ‘no clones’ class………...39
3.4. Analysis and mapping of selected candidate lines………...41
3.4.1. Group D1 – analysis and mapping………41
3.4.1.1. Phenotype description and analysis………..…..…..……….41
3.4.1.2. Analysis of embryonic phenotype………...………..44
3.4.1.3. Survival test………...………….………...46
3.4.1.4. Mapping of complementation group D1………...46
3.4.2. Group E2 – analysis and mapping………49
3.4.2.1. Phenotype analysis………...…49
3.4.2.2. Analysis of embryonic phenotype ………53
3.4.2.3. Survival test………...53
3.4.2.4. Mapping of group E2……….54
3.4.3. Group E3 – analysis and mapping……….55
3.4.3.1. Analysis of phenotype………...55
3.4.3.2. Survival test………57
3.4.3.3. Mapping of group E3………..57
4. Discussion………61
4.1. MARCM screen………61
4.2. Mutants phenotypes………..62
4.3. Phenotypes of selected candidate lines……….65
5. Conclusions……….67
6. Bibliography………...68
7. Appendix……….73
8. Abstract..……….…87
9. Zusammenfasung………....88
1. Introduction
Many organs of animals, including lung, kidney, blood vessels and most of glands in vertebrates, are built of branched tubular epithelial structures. They enable the transport of gases or liquids in the body. How they form and what controls branching events, direction of growth and tube size are questions that are pertinent to understanding branch morphogenesis. These questions are important not only for biology but also for medicine, because many diseases, such as polycystic kidney disease, are causing plumbing defects. The elucidation of molecular mechanisms of tube formation could lead to new ways of diagnosing and treating such diseases. However, dissection of these processes in mammalian system is rather difficult. Thus the Drosophila tracheal (respiratory) system with its structural simplicity and accessible genetics has become an excellent model in recent years for studying tubulogenesis.
1.1 Development of Drosophila tracheal system
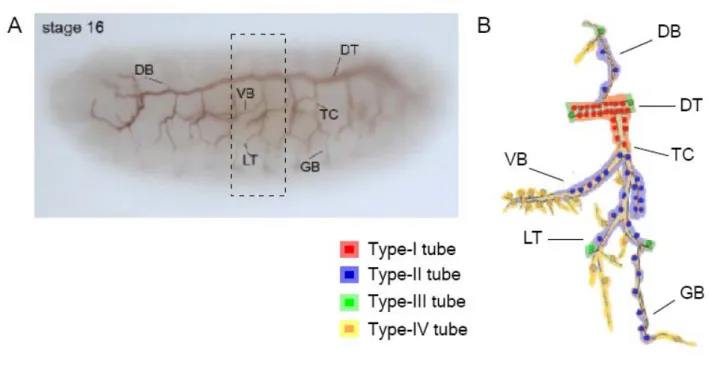
The Drosophila tracheal system is a network of single-layered epithelial tubes transporting oxygen and other gases throughout the body. It is comprised of approximately 1600 cells forming ~ 10,000 interconnected tubes in the larval trachea (Ghabrial et al., 2003). They are covered by a luminal cuticular lining, which provides a barrier against dehydration and pathogens. The process of tubulogenesis is based on cell migration, cell shape changes and rearrangements and regulated growth of distinct subcellular domains. The Drosophila trachea arises from ten clusters of ectodermal cells on either side of the embryo, which results in bilateral symmetry and a repeated metameric structure of the network. After two cycles of cell division, ~ 80 cells of each tracheal placode invaginates to form an elongated sac, from which six major buds grow in different directions, giving rise to the different primary branches. The major primary branch is the dorsal trunk (DT) –connecting all tracheal segments along the anterior-posterior axis. On the lateral side this role is played by the lateral trunk (LT). The transverse connective (TC) connects the DT and the LT in each segment. Among the remaining primary branches are the dorsal branches (DB) migrating dorsally, the visceral branches (VB) migrating internally and the ganglionic branches (GB) penetrating the central nervous system. The primary branches later produce secondary branches, with their lumen formed by a single cell. The terminal branches arise from the tips of the secondary branches during stage 16 of embryonic development and their formation last throughout the larval stages. During their development the terminal tracheal cells ramify into extensive arrays that cover and support large area of the target tissue (Manning and Krasnow, 1993). Fig.1.1 depicts the development of the embryonic trachea and the fully formed larval tracheal tree.
Figure 1.1 Schematic representation highlighting the development of the embryonic trachea (A) and the larval respiratory system (B). After placode invagination at stage 11, cells form elongated sacs from which six major buds grow out giving rise to primary branches (stage 12). One example of tracheal metamere at stage 12 is depicted in the upper right panel.
The formation of the buds is followed by cell migration, branch fusions and extensive cell rearrangements which lead to formation of a network supplying all target tissues with oxygen by stage 17. During the larval life terminal branches undergo several ramifications generating variable and complex tracheoles. (Adapted from Hartenstein, 1993 (A) and Ghabrial et al., 2003 (B)).
Proper development of the trachea requires induction and maintenance of expression of the Fibroblast growth factor (FGF) receptor, Breathless (Btl) in each tracheal cell. The FGF pathway plays a major role in the branching process. It is first activated by the FGF-like molecule, Branchless (Bnl), secreted by groups of ectodermal cells surrounding the invaginated placode. Bnl acts as a chemoattractant for the nearest tracheal cells and guides cell migration thereby directing branch outgrowth (Sutherland et al., 1996). This signalling pathway is used in each step of branching, triggering the expression of different genes required for primary, secondary or terminal outgrowth. Although some such genes have been identified, it is still not entirely clear what happens in the cell after Btl activation. The genetic developmental program controlling primary and secondary branching involves other signalling pathways as well, like Epidermal growth factor (EGF), Decapentaplegic (Dpp), Wingless (Wg) etc, responsible for determination of cell fates and branch types. In contrast to stereotyped embryonic development of the trachea, formation of terminal branches in the larva is more flexible and depends more on the physiological needs of the surrounding tissues. (Ghabrial et al., 2003; Kerman et al., 2006; Uv et al., 2003).
1.2 Architecture of tracheal branches
Different branches within each tracheal metamere have a fixed number of cells and a characteristic tube dimensions and structures. They are all made up of polarized epithelial cells, with the apical surface facing the lumen and the basal side facing the surrounding tissue. In late embryonic and larval stages, four distinct types of tubes can be found (Fig. 1.2 and 1.3).
Type-I tubes – DT, part of TC – are multicellular tubes with two to five wedge-shaped cells surrounding the central lumen and connected by intracellular junctions. Their diameter in the embryo ranges from 4 – 5 μm. Type-II tubes are more narrow (1 μm in diameter), formed by interconnected cells lying in a row. They are found in DB, VB, GB, LT and parts of TC. Their lumen is made up of a single, tube-shaped cell sealed by autocellular junctions. To maintain the chain-like assembly of cells, adjacent cells are connected by ring-shaped intercellular junctions.
Type–III tubes (fusion anastomoses) interconnect tubes of type I and II (DT, LT and DB) in order to link up neighbouring metamers and form a continuous network. They consist of two single doughnut-shaped cells attached head to head through an intercellular junction. Each of the two cells derive from a different primary branch and they contact each other to mediate lumen fusion. This results in seamless tubes lacking intracellular junctions. The diameter of type-III tubes depends on the type of the connected tubes and varies from ~ 0.5 to 5 μm. Type-IV tubes are formed by terminal cells. They are subcellular seamless capillaries making direct contact with target tissues
and mediating gas exchange. Their diameter is less than 0.5 μm (Kerman et al., 2006; Uv et al., 2003).
Figure 1.2 Each metamere consists of different types of branches. The tracheal system in a stage 16 embryo, visualised by luminal marker (2A12) (A), and schematic representation of one metamere (B). In the late embryo and in larval stages, four different tube types can be distinguished. Adapted from (Uv et al., 2003).
Type-I Tube Type-II Tube Type-IV Tube
Figure 1.3 Schematic cross sections of the lumen of different tube types. The cell body is marked in green and nuclei in red.
1.3 Morphogenesis of tracheal branches
The formation of elongated tracheal branches with different tube types from the sac-like structure of the invaginated placode requires cell rearrangements and cell shape changes. Since tracheal cells are part of a tightly sealed epithelium, the epithelial adherens junctions, responsible for cell-cell adhesion, also undergo extensive remodeling during formation of branches.
1.3.1 Primary branching
The first branches to form are multicellular type-I tubes, consisting of several cells wrapped around the lumen and held together by intercellular adherens junctions (AJs) established at a subapical position between neighbouring cells. Their formation is based on invagination of the tracheal placode and further migration of cells, without dramatic changes in cell to cell contacts. Throughout tracheal development, only large tubes like DT or more dorsal parts of TC keep this character. Finer secondary branches which arise from primary branches during trachea morphogenesis undergo more drastic rearrangements.
1.3.2 Secondary branching
Transition from type–I tubes to type II, accompanied by tube elongation, can be divided into distinct steps. They were revealed by in vivo analysis of AJ rearrangements during the formation of dorsal branches (Jazwinska et al., 2003; Ribeiro et al., 2004). In the first step referred to as
‘pairing’, cells are aligned in a pairwise fashion along the lumen, made up of two cells. Afterwards, cells start to intercalate, which requires extensive AJ remodelling. First, two neighbouring cells reach around the lumen, which leads to the formation of the first autocellular AJs as a cell touches its own membrane extension. Both cells reach around the lumen on opposite ends, proximal and distal, along the elongation axis. As the first autocellular contact is established, cells seem to ‘zip up’ by replacing intercellular AJs with autocellular ones. This step is referred to as ‘zipping’. To ensure that cells stay in contact with their neighbours in a head to tail arrangement, the zipping process must be terminated. This results in the presence of small, ring-like intercellular AJs connecting neighbouring cells.
So far not much is known about the molecular events underlying transition from type I to type II tubes. It has been shown that zinc-finger transcription factor Spalt (Sal) is requird for the control of this process, by blocking intercalation (Ribeiro et al., 2004). Sal expression is spatially induced by
wingless signalling in dorsal trunk (Chihara and Hayashi, 2000; Llimargas, 2000) and repressed by dpp signalling in cells positioned dorsally and ventrally to the dorsal trunk (Chen et al., 1998). This expression pattern defines branches in which intercalation takes place. However, it is not clear how this happens, since no Sal target genes have been found so far. Little is known also about molecules involved in cell pairing, cells reaching around the lumen or in the zipping process. It is likely that regulation of cell adhesion is required for these steps. DE-cadherin regulation might be important for this process as it is involved in cell adhesion. DE-cadherin is a single–pass transmembrane protein. Its extracellular domain forms homophilic transdimers between adjacent cell membranes.
The cytoplasmic domain interacts with p120 catenin, β-catenin and Hakai, an E3-ubiquitin ligase (Fujita et al., 2002). β-catenin binds to α-catenin, which associates with actin filaments. The cell to cell contact based on the strong adhesivness of cadherin is caused probably by anchoring of cadherin-catenin complexes to the cytoskeleton and has to be modulated to allow cell rearrangements. It is possible that regulation takes place at different levels. It could be for example, control of E-cadherin turnover or recycling, modulation of interaction with the cytoskeleton, or regulation of adhesion through inside-out signalling (Neumann and Affolter, 2006). There are several possible candidates shown to be involved in the intercalation process: Src, shown to induce the dissociation of epithelial cells, Hakai, targeting E-cadherin for degradation (Fujita et al., 2002), Arf6, a GTPase mediating E-cadherin internalization (Paterson et al., 2003). There are a number of proteins that might play a role in regulation of the actin cytoskeleton - E-cadherin interaction. These are for example small GTPases like Rho, Rac and Cdc42 and the Ras family member Rap1. Also, components of AJs might be involved in regulation of cell intercalation (Neumann and Affolter, 2006). Some of the genes listed above have been already shown to cause tracheal defects, like Src (Takahashi et al., 2005) or the GTPase Rac1 (Chihara et al., 2003).
Two genes, piopio (pio) and dumpy (dp), have been shown to be required for the termination of cell intercalation, (Jazwinska et al., 2003). In their absence, all fine tubes are transformed into epithelial cysts, disconnected from the remaining multicellular tubes in the embryo. They both encode proteins containing zona pellucida (ZP) domain, they are produced by tracheal cells and secreted into the lumen. It has been proposed that Pio and Dp might form a luminal scaffold that prevents the complete zipping of the autocellular junctions and thus helping to preserve branch integrity.
1.3.3 Fusion cell formation
As the tracheal system develops from 20 independent metameres, branch fusion is needed to form a continuous network. Thus, cells at the tips of the connecting branches undergo a complex process of
partner recognition and formation of an intracellular tube. Fusion type-III tubes are doughnut- shaped and lack autocellular junctions (Samakovlis et al., 1996a). They are formed in a process know as anastomosis in which fusion cells recognize each other, make contact on their basal surface and subsequently generate the apical lumen that bridges the junction between them. The initial lumen is provided by the apical surface of the bordering cells of branches to be fused. It is pulled along or penetrates the fusion cell actively, forming finger-like extensions. The lumen growth inside the fusion cell occurs in a proximo-distal orientation, with an increased number of vesicles containing luminal material at the tip of the growing lumen. This observation made by Samakovlis et al. (1996a) indicates that the intracellular lumen forms by assembly and fusion of vesicles, using the ‘finger’ tips as nucleation points (Uv et al., 2003).
The first molecular step in a fusion event is the deposition of DE-cadherin at the site of contact on the basal surface of the cells (Tanaka-Matakatsu et al., 1996). This leads to accumulation of several cytoskeleton binding proteins, including α – catenin, β – catenin, short stop, which encods a plakin that binds both F-actin and microtubules and Formin 3, a regulator of several actin-based processes (Tanaka-Matakatsu et al., 1996; Lee and Kolodziej, 2002; Tanaka et al., 2004). These proteins mediate the formation and maintenance of an actin bridge that spans both fusion cells from one initial lumen bud to the other. This bridge serves as a site of fusion of vesicles with luminal material. Subsequently DE-cadherin and associated proteins form a circle perpendicular to the presumptive lumen at the interface between the two fusion cells. After docking and fusion of vesicles lead to the formation of a continuous lumen, the adherens ring expands to the same diameter as the connected tubes and two fusion cells form bicellular anastomosis.
The number of cells undergoing the process of fusion is controled by Notch signalling as well as expression of fusion cells markers such as Escargot, Fusion-2 and Fusion-3. Determination of fusion cell fate is a result of spatial interplay of Dpp, FGF and Wg signalling (Ikeya and Hayashi, 1999; Steneberg et al., 1999).
1.3.4 Terminal branching
The tip cells on the secondary branches that do not form fusion cells form terminal branches. The initially compact cells grow thin cytoplasmic extensions towards the bnl expressing target tissue.
The extensions finally come into close contact with the plasma membrane of target cells in order to allow gas diffusion. Their outgrowth is accompanied by repeated events of cytoplasm extension and formation of the lumen within the cell which leads to the creation of a ramified network contacting almost every cell in target tissues (Guillemin et al., 1996).
As terminal cells start to sprout, they also change their shape by extending broad cytoplasmic processes away from the neighbouring stalk cell. The nuclei are initailly moved along and initial branch lumen, possibly provided by neighbouring stalk cells, is acquired. During the further branches outgrowth the nucleus of the terminal cell remains stationary at the cell base. As branching proceeds, first long narrow cytoplasmic protrusions are formed which are later invaded by lumen. Similar to the lumen in fusion cells, it grows in a proximo-distal orientation, possibly by fusion of luminal vesicles (Guillemin et al., 1996). However, the mechanism leading to the formation of the lumen as a junction-less, intracellular, membrane-bound channel is poorly understood.
The first steps of terminal branch formation during late embryogenesis seem to be stereotyped to ensure air supply to all regions of the newly hatched larvae. Larval life however, is dominated by extensive body growth and enhanced oxygen needs, which requires a more flexible system. The terminal branches ramify several times during this period, generating variable and complex trees of tracheoles. However, branching variability does not mean disorganization. Spacing between branching points is regular and branches never cross each other. Sprouting is regulated by oxygen needs of the tissues. Low oxygen (hypoxia) induces terminal branching and high oxygen (hyperoxia) suppresses it via control of branchless expression (Jarecki et al., 1999). It is not fully understood how the Drosophila cells sense low oxygen and how this leads to induction of branchless expression. It has been proposed that the Drosophila homologue of mammalian hypoxia inducible factor (HIF), the transcription factor playing a major role in mammalian hypoxia response, may mediate sensing and response to oxygen levels. In corcondance with this notion branchless has been identified as one of its targets. The other candidate is nitric oxide (NO) signalling, since its perturbation during larval life affects terminal branching in a fashion similar to hypoxia or hyperoxia (Ghabrial et al. 2003). What happens in the terminal cells upon FGF signal activation by Bnl binding to the receptor Btl is also not fully understood, but some players have been identified. One of them is blistered (bs, named also pruned), the Drosophila homologue of mammalian serum response factor (SRF). It is selectively required for terminal branch growth, since in embryos missing DSRF, terminal cells undergo the initial sprouting but fail to develop an intracellular tube distal to the nucleus. It is a transcription factor whose activation in terminal cells by the FGF pathway induces expression of so far unknown target genes required for cytoplasmic outgrowth and terminal branch formation (Affolter et al., 1994; Guillemin et al., 1996). One other identified regulator of terminal outgrowth is sprouty (spry). It acts downstream of FGF signalling, but as a negative regulator, antagonising the pathway and limiting the number of cells producing terminal branches (Hacohen et al., 1998).
Extensive ramification of terminal branches during larval life requires not only proper outgrowth and lumen formation but also its maintenance and stability. A recent study (Levi et al., 2006) revealed that Drosophila Talin, a large cytoskeletal protein that links integrin cell-adhesion molecules to the cytoskeleton, is required for maintenance of the terminal branches. The integrin- talin adhesion complex anchors mature terminal branches to their substrata and maintain luminal organization. If these complexes are absent, the lumen becomes disorganised and retracts from the branch which leads to the degeneration of lumenless branches.
1.4 Control of tracheal tube size
During embryonic and larval development, tracheal tubes not only remodel their structure but also dramatically increase in size and diameter. At the end of larval life, tracheal tubes would have expanded up to 40 times their initial size. Extensive studies of the mechanical and molecular bases of this expansion and its control revealed several aspects of this process.
First insight into tube size changes came with the identification of eight mutations leading to abnormal tube elongation or irregular tube diameter (Beitel and Krasnow, 2000). This study showed that tube size is linked to branch identity and is not controlled by number, size or overall shape of the cells forming the tracheal tubes, but by coordinated regulation of apical surface. Further studies revealed that tube length and diameter are controlled independently. Thus products of genes playing a role in tube size control were divided into two categories: one involved in tube elongation control and second required for control of tube diameter.
1.4.1 Genes involved in tube elongation control
This category consists of genes causing an increase in tube length when mutated. They mostly encode components of pleated septate junctions (SJs), revealing a new role for these cell to cell junctions. The SJs are membrane structures found basal to the adherens junctions in many epithelia.
They are functional analogues of vertebrate tight junctions, since they form a diffusion barrier for water and solutes between epithelial cells.
Mutations in megatrachea and sinous lead to an increased tube size. They encode claudins (Behr et al., 2003; Wu and Beitel, 2004), four transmembranepass proteins whose homolougs form a paracellular barrier in vertabarte tight junctions. Also the bulbous (lachsin) phenotype is caused by a mutation in a cell adhesion molecule which localises to SJs (Llimargas et al., 2004). Ecstatic, which turned out to be a new allele of nervana2 encodes the β-subunit of a Na+/K+ ATPase , which
also localises to SJs. Also other components of SJs, like coracle, neurexin, gliotactin, and the α – subunit of Na+/K+ ATPase show similar defects in tracheal tube size when mutated (Paul et al., 2003). Additionally, this study revealed that the function of SJs in tube size control is separate from the regulation of paracellular diffusion. How the SJs control tube elongation is not clear. It was proposed that a group of SJ genes could regulate relative levels of apical membrane components such as Crumbs and thus affect luminal expansion (Wu and Beitel, 2004). The other model suggests that SJs could regulate the apical extracellular matrix indirectly. The identification and analysis of two luminal chitin-binding proteins Vermiform and Serpentine, which, when mutated leads to tube elongation phenotypes similar to those of mutations in SJs components (Luschnig et al., 2006;
Wang et al., 2006) revealed that late modification of the luminal chitin matrix is specifically required for tube length control. Additionally it was shown that SJs are necessary for the proper localisation and apical secretion of Vermiform. These results suggest that the second model involving indirect control of tube size through modifications of apical luminal matrix is more likely.
1.4.2 Genes involved in tube diameter control
The second category of tube size mutations consists of genes affecting tube diameter when mutated.
They encode proteins involved in chitin biogenesis, secretion or maturation. The tracheal chitin is synthesized by Chitin synthase 1 (CS 1 – krotzkopf verkehrt) and deposited into the lumen where it assembles into a defined transient cable that expands in unison with lumen diameter growth (Tonning et al., 2005). Loss of this transient chitin matrix results in local tube dilation and constriction. Such phenotypes have been observed in mummy/cystic mutants, in which UDP-N- acetylglucosamine diphosphorylase required for chitin synthesis is mutated (Araujo et al., 2005;
Devine et al., 2005). Also knickkopf (gnarled) and retroactive, which encode proteins involved in targeting and/or secretion of chitin or chitin synthesis enzymes are necessary for regular tube diameter expansion (Devine et al., 2005; Moussian et al., 2006).
1.4.3 Model of tube size regulation
Recently, Wang et al. (2006) proposed the following model. During tube expansion, assembly and growth of the chitin matrix is required to coordinate uniform radial expansion of the tubes.
Subsequent modifications in chitin fibril structure by secreted deacetylases (Vermiform and Serpentine), whose localisation depends on SJ function, instruct the epithelial cells to terminate the tube elongation. Thus dynamic structural changes of the luminal matrix may independently determine diameter growth and tube elongation.
1.5 Phenotypic analysis of mutant clones using the MARCM system.
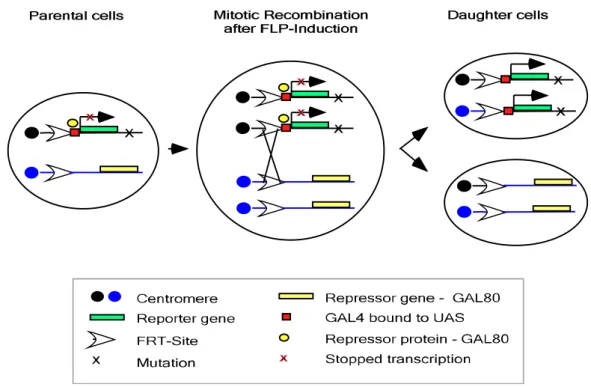
Investigation of tracheal development during embryogenesis has been mostly based on analyses of homozygous mutant embryos. Such an approach is not always possible for studying tracheal morphogenesis during larval life as mutations in many of the genes involved in this process are embryonic lethal. This could be overcome by generation of genetically mosaic organisms. Induction of mutant clones surrounded by wild type tissue is a very useful tool for analysing the consequences of gene loss of function during animal development. The commonly used FRT/FLP system (Theodosiou and Xu, 1998) allows the generation of mutant clonal cells. Usually, the mutant cells can be distinguished from their twin spot sister cells and wild type cells by the loss of marker gene expression. However, in many cases it is very useful to mark the mutant cells positively through expression of marker. Therefore the MARCM (Mosaic Analysis with a Repressible Cell Marker) system was established in flies (Lee and Luo, 1999). In this system, expression of a GAL4-UAS construct with a reporter gene is suppressed by the presence of the GAL4 repressor GAL80, which is placed on the FRT chromosome whose homolog is carrying a mutation to be analysed. When a FLP dependent mitotic recombination event occurs, the reporter gene is expressed only in clones homozygous for the mutation (fig. 1.4).
Fig. 1.4 The MARCM system. In parental cells, expression of reporter gene is suppressed by the presence of the GAL4 repressor, GAL 80. The repressor gene is placed distal to the FRT-site on the homologous arm of the chromosome arm with mutation of interest. After FLP induced recombination the cells homozygous for the mutation loose the repressor gene and thus reporter gene can be expressed in these cells (Adapted from Lee and Luo, 1999)
The system has been wildly applied to investigate many cellular and developmental processes, including analysis of tracheal morphogenesis (Cabernard and Affolter, 2005; Ghabrial and Krasnow, 2006; Levi et al., 2006, A.Bilstein, PhD thesis).
1.6 The aim
Several studies on tracheal development in recent years have given an insight into the complexity of the genetic control and cellular processes of tracheal morphogenesis. However there are still many open questions: what are the ‘effectors’ of signalling pathways controlling tubulogenesis, which molecules are involved in cell remodelling and how do they coordinate extensive cell shape changes and rearrangements. Also, not much is known about the molecular mechanisms responsible for the sprouting of cytoplasmic outgrowth and lumen formation in terminal branching. Since extensive cell remodelling, needed during terminal branching lasts up to larval stages it is important to be able to analyse these processes also at later stages of development. This is not always possible since many genes that might play a role in larval tracheal morphogenesis could be also required during embryogenesis. This disadvantage can be overcome by application of clonal analysis with the MARCM system. It has been successfully applied to analyse role of known genes in the later stages of trachea formation. Thus, it can be also used for identification of new genes involved in tracheal development, a different approach for a better understanding of this process.
The aim of this study was to perform a genetic mosaic screen of the second chromosome, for EMS- induced mutations affecting tracheal morphogenesis. The second chromosome was chosen, because the first and third were simultaneously screened by a different group. To identified new mutants affecting larval tracheal development we applied clonal analysis with the MARCM system and examined mutation effects in third instar larvae.
2. Material and Methods
2.1 Materials 2.1.1 Antibodies Primary antibodies:
• mouse anti-m2A12 ; 1:20 (against unknown tracheal lumen protein , N. Patel);
• rabbit anti- β – Gal; 1:500 (Cappel);
• mouse anti-arm; 1:3000;
• rabbit anti-GFP; 1:500;
Secondary antibodies:
• goat anti-mouse, biotin; 1:500
• goat anti-rabbit, biotin; 1:500
• goat anti-mouse, Alexa 568; 1:500
• goat anti-rabbit Alexa 488; 1:500
2.1.2 Fly stocks
Stocks listed in tab. 2.1 were used for experiments. TB170 line was used as a wild type control in MARCM analysis. For embryonic analysis w- flies were used.
Stock
number Genotype Reference
TB170 yd2w1118P{ey-FLP.N}2 P{GMR-lacZ.C(38.1)}TPN1;P{neoFRT}40A Bloomington #5615 TB114 yw,hsFlp1.22;tub-Gal80,FRT40A;btl-GAL4, UAS-GFP S.Luschnig (Krasnow
lab)
TL521 P{Hs-hid}sp/CyO8ftz lacZ R. Lehmann
TB136 w-; If/CyO; btl-Gal4, UAS-βspectrin-PH domain-eGFP-2xHA A. Bilstein
TMB013 yd2 w1118 P{ey-FLP.N}2 P{GMR-lacZ.C(38.1)}TPN1; P{EP}EP511/CyO Bloomington #6415 TN044 w1118; ; P{UAS-myr-mRFP}2/TM6B, Tb1 Bloomington #7119
F-232 w-; If/CyO; MKRS/TM6B F. Sprenger
TMB017 w-; conv[K6507]/CyOwgLacZ G.Beitel
TMB018 w-; nrv2[23B]/ CyOwgLacZ G. Beitel
TMB19 w*; vari[K5953]/CyO G. Beitel
Tabele 2.1 List of used fly stocks
2.1.3 General reagents and equipment
• general chemicals: Boehringer, Fluka, Gibco, Merck and Sigma
• plastic ware:, Eppendorf, Falcon, Greiner, Sarstedt
• microscopes: Leica Fluorescent-Stereomicroscope MZFLIII (Fluo-Combi) Flourescent Microscope – Axioplan 2 imaging - Zeiss
Light Microsocpe – Axioplan - Zeiss
• cameras: AxioCam MRc5 – Zeiss AxioCam HRm - Zeiss
2.2 Methods
2.2.1 Mutagenesis and establishing of the stocks
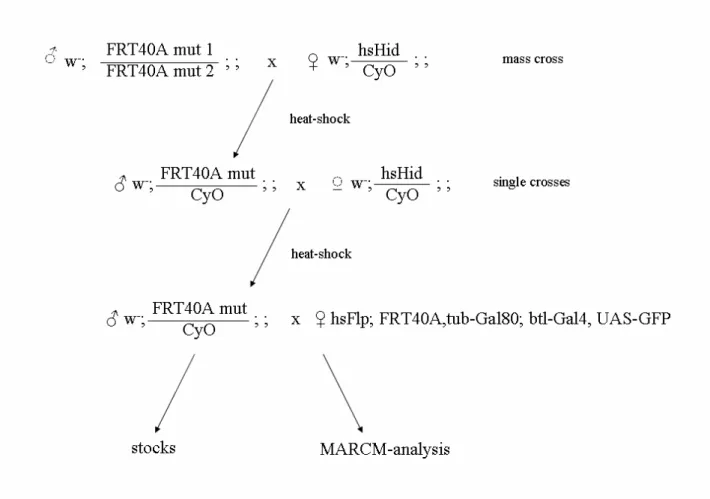
To establish 5000 lines carrying point mutations on the left arm of the second chromosome chemical mutagenesis was performed. To avoid difficulties of handling such a high numbers of lines at once, they were generated in batches of 1000 lines. In each round three hundreds 2–3 days old males from an isogenised stock, with FRT site on the left arm of the second chromosome (yd2w1118P{ey-FLP.N}2 P{GMR-lacZ.C(38.1)}TPN1;P{neoFRT}40A), were mutagenised with 30mM EMS (standard protocol, Grigliatti, 1998). EMS fed males were crossed with hs-Hid/CyO females (P{Hs-hid}sp/CyO8ftz lacZ) (mass cross). To select progeny with required genotype (FRT40A, mutation/CyO) larvae were heat-shocked on day 5 and 6 after egg lay for 2 hours at 38O C (to induce the hsHid transgene expression). Only larvae carrying the mutated FRT chromosome but lacking the one with hsHid transgene, survived this procedure. Next, 1000 males from the progeny were used to establish single lines by crossing them to hsHid/CyO females. Again selection for flies with correct genotype was performed by heat-shock treatment as described above (the crossing scheme is shown on fig.2.1).
Figure 2.1. Screen crossing scheme: The screen was performed in six batches. In each round 1000 lines were established and analysed in the way shown above.
2.2.2 MARCM analysis
The male progeny from stocks established as depicted in fig.1 were crossed with females carrying all components of the MARCM system (yw,hsFlp1.22;tub-Gal80,FRT40A;btl-GAL4, UAS-GFP).
A UAS-GFP construct was used as a reporter gene, driven by the trachea specific btl-GAL4. The eggs were collected for 4 hours at 25OC and heat-shocked for 30 min at 38O C to induce mitotic recombination. Live third instar larvae were observed under a fluorescent-stereomicroscope. For live observation larvae were first immobilised by adding water to the vials and after 1 hour placed on the microscopic slide with plastic grid preventing disturbance of larval structure by cover slip. 8 larvae were analysed per line. Each line showing a defect was retested on the next day with 16 larvae.
2.2.3 Complementation test
In order to perform a complementation test, all the lines were checked for lethality. The homozygous lethal lines were identified by absence of non- CyO flies after 4 generations. Later, these lines were tested against each other within the phenotypic groups. Approximately 2 males and 4 females were taken for each cross. The crosses were kept at 25oC and progeny was scored for presence of non-CyO flies.
2.2.4 Embryonic analysis
2.2.4.1 Embryo collection and fixation
Embryos were collected on apple juice - agar plates for 16 h at 25OC. They were dechoronized by adding bleach (diluted 1:1 with tap water) to the plates for 1,5 min. After washing away the bleach embryos were put into freshly prepared fixation solution (4% formaldehyde, heptan 1:1) and placed on rotor wheel for 30 min at 37OC. Next, aqueous phase was removed and 1 vol. of 100% methanol was added. After vortexing for 1 min. fixative was removed and embryos were quickly washed several times with methanol and store at – 20OC.
2.2.4.2 Immunostaning
Prior to staining procedure methanol was removed from the embryos and replaced by 1xPBST (1xPBS, 0.1% Tween 20). After several quick and three long (15 min) washing steps with PBST, embryos were incubated for 30 min at RT with blocking solution (1x PBST + 1% BSA). Next 300 μl of diluted primary antibody was added ( x μl 1o antibody - accordingly to working dilution, 3 μl of normal goat serum (NGS), filled up to 300 μl with blocking solution) and embryos were incubated overnight at 4OC. Removing of primary antibody was followed by several quick and three 15 min long washes with 1xPBST. Afterwards embryos were incubated with corresponding secondary antibody, diluted in 300 μl blocking solution with NGS, for 1-2 hours at RT. Depending on the secondary antibody labelling, the embryos were handle in following way:
Fluorescent labelled antibodies:
Antibody solution was removed and embryos were washed several times with PBST. Next, they were transferred into a drop of Vectashield mounting medium on the microscope slide. Afterwards,
Biotin labelled antibodies:
After removing the antibody solution embryos were washed with PBST and incubated for 30 min with ABC-Mix (Vecta Stain) (solution A and B diluted 1:100 in PBST). Incubation was followed by washing step and embryos were transferred to 24-well plates, where after removing of PBST, DAB solution was added to develop the signal (DAB diluted 1:5 in PBST + 1 μl of 0,3% H2O2).
When staining achieved wished strength, reaction was stopped by removing DAB solution and washing with PBST. Next embryos were dehydrated by series of 10 min washing in increasing ethanol concentrations: 25%, 50%, 75%, 90%, 95% and 100%. The dehydrated embryos were transferred into 100% acetone and incubated for 10 min. Subsequently acetone was replaced with acetone: araldite solution (1:1) and embryos were transferred into the plastic pot filled partially with pure araldite. Embedded embryos were kept at -20OC. For microscopic observation single embryos were transferred form the pot onto microscopic slides.
2.2.5 Immunostaining of third instar larvae.
L3 larvae were filleted open along the ventral midline, dissected in 1x PBS and fixed for 20 min in 4% paraformaldehyde in PBS at room temperature. After 2- 3 10 minutes long washes in 1xPBT (1x PBS + 0.3% TritonX) dissected larvae were incubated for 30 min. in blocking buffer (1xPBTB - 1x PBT with 1% BSA). Fixed larvae were incubated with primary antibody (diluted in 1xPBTB) overnight at 4OC. Prior to incubation with secondary antibody (1.5h, RT) samples were washed twice with 1xPBT. Washing step was repeated after removing secondary antibody and larvae were mounted in Vectashield mounting medium on the microscope slide.
2.2.6 Survival test
To evaluate lethality phase of the mutants embryos were collected on apple juice – agar plates for 2 -3 h at 25OC, and were counted after 3 hours. These plates were kept at 25OC and non-hatched embryos were counted after 24h and 48h. To determinate the developmental stage of these embryos they were covered with Voltalef 3S oil (which makes the chorion transparent).
2.2.7 Mapping of chosen mutants
2.2.7.1 SNP mapping
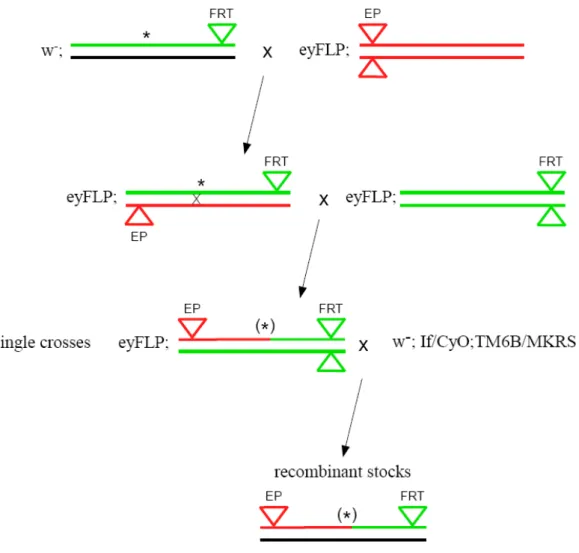
SNP mapping strategy, described by Berger et al.(2001) is based on sequence polymorphism between the strain used for mutagenesis (with FRT proximal insertion) and reference strain (with distal EP insertion – yd2w1118 P{ey-FLP.N}2 P{GMR-lacZ.C(38.1)}TPN1; P{EP}EP511/CyO). The mapping strategy can be divided in two steps: obtaining of the set of FRT and EP recombinant chromosomes with different break points and mapping of the mutation to the genome region by molecular and phenotypic analysis of recombinants.
Figure 2.2 Scheme of establishing recombinants stocks. Green line represents FRT chromosome, red EP chromosome, black – balancer chromosome. Triangles represent FRT and EP insertion (green and red respectively). Asterisk – mutation.
Establishing of recombinants stocks
Stocks of different recombinants between mutagenised FRT chromosome and reference line were established (fig. 2.2). To obtain these stocks, males from mutant line of interest were crossed to females from EP line. In next generation females carrying both mutated FRT and EP chromosomes were collected and crossed to males from original FRT line. From their progeny, males carrying recombinant chromosome were collected. The eye-colour mosaicism was used to identify recombinant chromosome with both EP and FRT insertion - due to presence of eyFLP transgene, such a chromosome results in mosaic eyes. In the next step single recombinant males were crossed to double balancer stock in order to establish stable stocks.
Phenotypic analysis of recombinants
All recombinant stocks were analysed for presence or absence of mutant phenotype with MARCM system as described earlier.
Molecular analysis
Genomic DNA was isolated for each recombinant stock according to the large scale DNA preparation protocol (FlySNP Website, http://flysnp.imp.ac.at). From each line, 1-2 males were placed in PCR tubes (0.2ml) and mashed for 5-10 seconds with the tip of a pipet containing 50 μl of Squashing Buffer (10mM Tris-HCl pH8.2, 1mM EDTA, 25mM NaCl, 200μg/ml Proteinase K (stock 20mg/ml, Quiagen)). Then buffer was expelled from the tip and tubes were placed in 37OC for 30 minutes followed by proteinase K inactivation by incubation at 95OC for 5 min. In last step 50 μl of H2O was added and DNA could be used for PCR reactions.
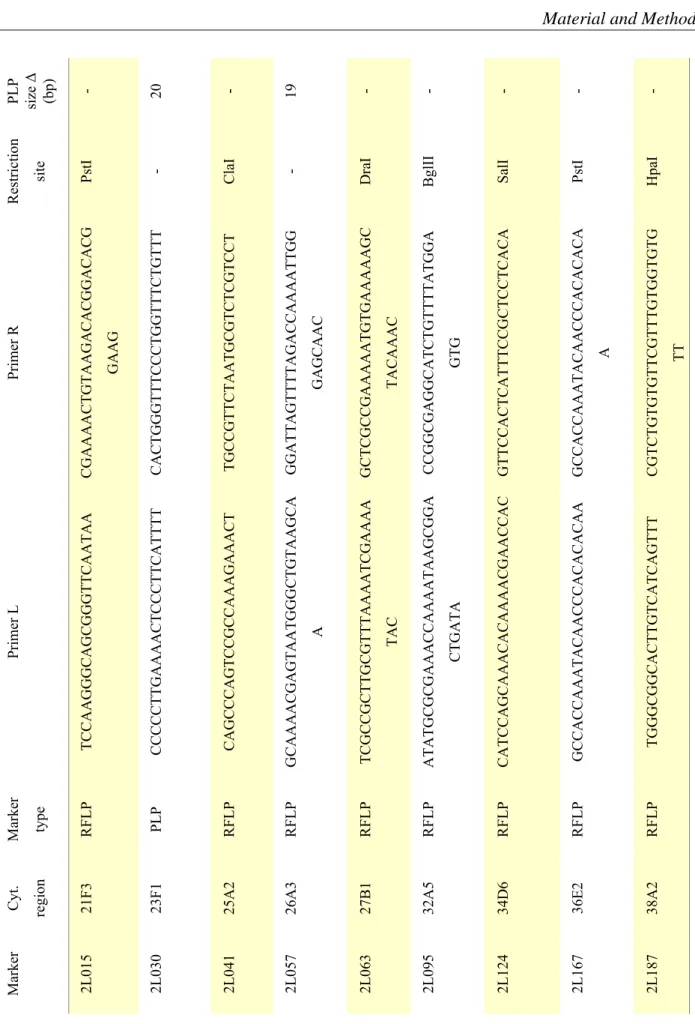
Randomly chosen DNAs were analysed in Restriction Fragment Length Polymorphism (RLFP) and PCR-product length polymorphism (PLP) assay for different SNP markers (FlySNP Website, http://flysnp.imp.ac.at). Used markers and attributed data are listed in tab.2.2
RFLP assay PCR mix:
2.5 μl 10x RedTaq Buffer without MgCl2 (Sigma)
2 μl 10mM dNTPs
1.5 μl MgCl2 (25mM) 13.5 μl dH2O
0.5 μl RedTaq Polymerase (1u/ μl) (Sigma) 1 μl primer L (10pmol/ μl)
1 μl primer R (10pmol/ μl)
3 μl genomic DNA (from 1-2 flies) PCR programm:
1. Denaturation 5’ 94OC 2. Denaturation 30’’ 94OC 3. Annealing 30’’ 62OC
4. Extension 2’ 72OC (2 → 4 x 40 cycles) 5. Extension 5’ 72OC
6. ∞ 4OC
5 μl of PCR product was digested with the appropriate restriction enzyme in 20 μl reaction and separated on 2.5% agarose gel.
PLP assay PCR mix:
2.5 μl 10x RedTaq buffer without MgCl2 (Sigma)
2 μl 10mM dNTPs
3.5 μl MgCl2 (25mM) 14.5 μl dH2O
0.5 μl RedTaq Polymerase (1u/ μl) (Sigma)
1 μl primer L
1 μl primer R
1 μl genomic DNA (from 1-2 flies) PCR programm:
1. 5’ 94OC 2. 30’’ 94OC 3. 30’’ 60OC
4. 1’ 72OC (2 → 4 x 40) 5. 5’ 72OC
6. ∞ 4OC
8-10 μl of PCR product were loaded on 2.5% agarose gel.
PLP size Δ (bp) - 20 - 19 - - - - -
Restriction site PstI - ClaI - DraI BglII SalI PstI HpaI
Primer R CGAAAACTGTAAGACACGGACACG GAAG CACTGGGTTTCCCTGGTTTCTGTTT TGCCGTTCTAATGCGTCTCGTCCT GGATTAGTTTTAGACCAAAATTGG GAGCAAC GCTCGCCGAAAAATGTGAAAAAGC TACAAAC CCGGCGAGGCATCTGTTTTATGGA GTG GTTCCACTCATTTCCGCTCCTCACA GCCACCAAATACAACCCACACACA A CGTCTGTGTGTTCGTTTGTGGTGTG TT
Primer L TCCAAGGGCAGCGGGTTCAATAA CCCCCTTGAAAACTCCCTTCATTTT CAGCCCAGTCCGCCAAAGAAACT GCAAAACGAGTAATGGGCTGTAAGCA A TCGCCGCTTGCGTTTAAAATCGAAAA TAC ATATGCGCGAAACCAAAATAAGCGGA CTGATA CATCCAGCAAACACAAAACGAACCAC GCCACCAAATACAACCCACACACAA TGGGCGGCACTTGTCATCAGTTT
Marker type RFLP PLP RFLP RFLP RFLP RFLP RFLP RFLP RFLP
Cyt. region 21F3 23F1 25A2 26A3 27B1 32A5 34D6 36E2 38A2
Marker 2L015 2L030 2L041 2L057 2L063 2L095 2L124 2L167 2L187
Table 2.2 SNP markers used for molecular analysis. Primers sequence and restriction sites information from The FLYSNP Database (http://flysnp.imp.ac.at/snpdb.php).
Combined information from phenotypic and molecular analysis resulted in placement of the mutation between two markers. Having the region of app. 1-2 Mb determined, all recombinants were screened for informative crossing over event between these two markers. If possible additional marker placed in between was tested to narrow down the region of interests. Recombinants with informative crossing over events were analysed further for more markers in these region.
2.2.7.2 Deficiency mapping
Deficiency mapping was based on lethality complementation between mutants and different sets of deficiencies. Deficiencies stocks are listed in Appendix (tab.A.1). For each cross 4 to 5 females from mutant stock were crossed to 2-3 males from deficiencies stocks. Crosses were kept at 27OC and progeny was screened for absence of non-CyO flies, meaning lack of complementation between crossed lines.
2.2.7.3 Sequencing of candidate genes
DNA preparation from single embryo.
Embryos from original FRT line and respective mutant line were collected for 5 hours and fixed as described earlier. After fixation methanol was removed and embryos were washed 2x in PBST.
Mutant embryos were additionally stained for presence of CyO ftz – lacZ chromosome. Single homozygous embryos were placed in PCR 0.2 ml tube and 10 μl of homogenizing buffer (10mM Tris pH 8.3, 0.5% Tween20, 0.5% NP-40, 50 μlM KCl) with 0.2 μl Proteinase K (20mg/ml, Quiagen) were added. Tubes were first kept for 2 hours at -20OC and later for 30 min at 37OC and 3 min. at 95OC. After gentle mixing of the reaction 1 μl was used for PCR.
Amplification of candidate genes
For each candidate gene primers were designed with primer3_www.cgi v 0.2 program
(http://frodo.wi.mit.edu/cgi-bin/primer3/primer3.cgi). From all genes only exons were amplified and size of the products varies from 400 – 700 bp. Oligos used for PCR are listed in Appendix (tab.A.2).
PCR Mix
5 μl 5x buffer without MgCl2 (Expanded High FidelityPLUS PCR System, Roche)
1 μl 10mM dNTPs
1.5 μl 25mM MgCl2
0.3 μl High Fidelity Polymerase (Expanded High FidelityPLUS PCR System, Roche)
1 μl primer 1
1 μl primer 2
1 μl DNA
16.7 μl dH2O PCR program
1. 5’ 94OC 2. 30’’ 94OC 3. 30’’ 54OC
4. 1’30’’ 72OC 2 → 4 x 30 5. 5’ 72OC
6. ∞ 4OC
5 μl of PCR product were separated on the 1.5% agarose gel to estimate amount of DNA.
Purification and sequencing of PCR product
PCR products were purified from the solution with GFX PCR DNA gel and solution purification kit (Amersham Biosciences) and 1- 6.5 μl was used for sequencing reaction (depending on DNA concentration). Each PCR product was sequenced in both directions with the same primers as used for amplification.
Sequencing Mix
2 μl Big Dye Terminator v.3.1 (Perlin Elmer) 1 μl primer (10pmol)
1-6.5 μl DNA 6-0.5 μl dH2O 10 μl
Sequencing program 1. 5’ 96OC 2. 30’’ 96OC 3. 15’’ 50OC
4. 4’ 60OC 2 → 4 25x 5. ∞ 4OC
The volume of sequencing reaction was made up to 20 μl before the sequencing of amplified product, obtained sequences were analysed using Vector NTI software (Invitrogene).
3. Results
3.1 MARCM screen
To identify novel genes involved in tracheal morphogenesis we performed a genetic screen, based on EMS (Ethyl Methane Sulfonate) mutagenesis. We were interested in late events of tracheal formation thus to overcome potential early lethality caused by induced mutations, we applied as a screen tool the MARCM system allowing analysis of homozygous mutant clonal cells in heterozygous background.
Previous analysis of clonal cells in trachea of wild type third instar larvae and a pilot screen (see A.
Bilstein, PhD thesis) led to determination of wild type features and to establishment of screening criteria. In larvae with wild type clonal cells, number of clonal cells varied from 30 to 80 per larva.
They were distributed randomly in all types of branches. Usually the number of clonal cells was slightly higher in anterior part of the larva. The clonal cells on the dorsal trunk were large and hexagonal, except for fusion cells which had a ring-like shape. Cells on secondary branches were elongated and varying in size depending on position. The number and lengths of branches in clonal terminal cells were highly variable with higher branching rate in the anterior part of the animal. A properly formed lumen filled with gas can be found in all clonal cells. Additionally, due to breathless expression in the epidermis, a number of GFP positive epidermis cells could be observed. Also two GFP marked cells were often found in the heart.
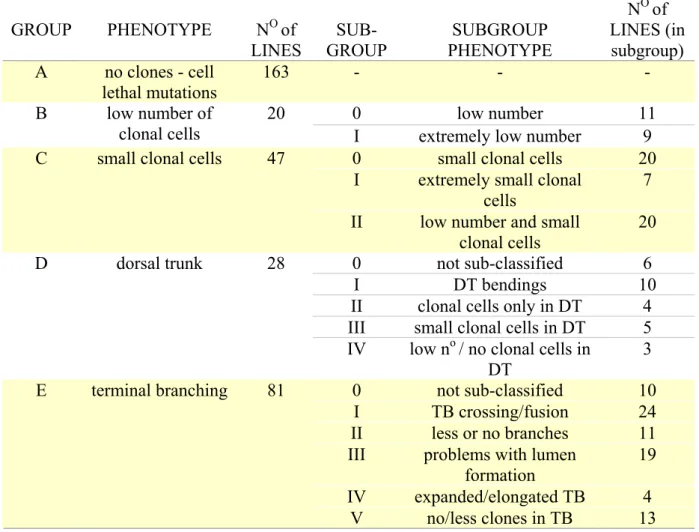
After inducing mutations with EMS in males we set up approximately 6000 single crosses and were able to establish 4779 stocks carrying mutated chromosomes. The loss of lines occurred at two steps of the procedure. 16% of single crosses did not give any progeny and 6% did not survive the heat- shock. We screened 4779 mutated lines analyzing the number, size, shape and distribution of clonal cells. Also the shape and formation of the lumen within clonal cells were taken into account. We observed the wild type phenotype in 4452 lines, whereas in 344 we detected defects in one or more of the analysed criteria. We classified the mutations into the five phenotypic groups as listed in table 3.1 and described in detail below. Five mutations showed phenotypes that did not fall into any of the proposed phenotypic classes. These were:
• 2L0419 – mutant tracheal histoblasts were smaller; line was homozygous lethal
• 2L0445 - abnormally shaped and too small clonal cells in the dorsal trunk and secondary branches (e.g. transverse connective); line was homozygous viable
• 2L1281, 2L1296 – clonal cells absent in the epidermis; 2L1281 was homozygous lethal, 2L1296 viable;
• 2L3574 – clonal cells present only in the epidermis but not in the trachea; line was homozygous lethal.
All mutant lines are listed in table A3 (Appendix).
GROUP
PHENOTYPE NO of LINES
SUB- GROUP
SUBGROUP PHENOTYPE
NO of LINES (in subgroup) A no clones - cell
lethal mutations
163 - - -
0 low number 11
B low number of
clonal cells 20
I extremely low number 9 0 small clonal cells 20 I extremely small clonal
cells
7 C small clonal cells 47
II low number and small clonal cells
20 0 not sub-classified 6
I DT bendings 10
II clonal cells only in DT 4 III small clonal cells in DT 5 D dorsal trunk 28
IV low no / no clonal cells in
DT 3
0 not sub-classified 10 I TB crossing/fusion 24 II less or no branches 11 III problems with lumen
formation
19 IV expanded/elongated TB 4 E terminal branching 81
V no/less clones in TB 13
Table 3.1. Classification of identified mutants. Additionally, 5 lines showed phenotypes that did fall into any of these groups (see above). (DT – dorsal trunk, TB – terminal branches)
3.2 Phenotypic classes
The phenotypes observed in the mutants of the five phenotypic classes are described in detail in the following sections.
3.2.1 Group A – no clones
The phenotype characteristic for this class was the absence of clonal cells. This was the largest group, consisting of 163 lines. The class was not analysed any further.
3.2.2 Group B - low number of clonal cells
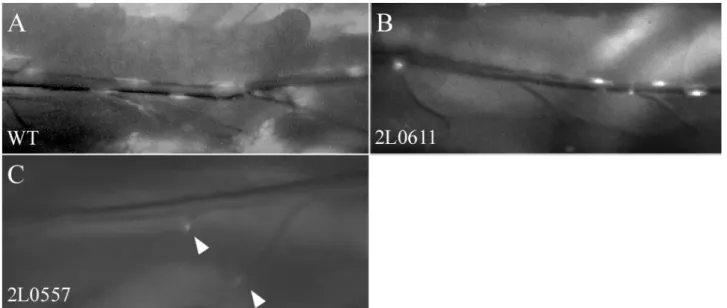
The 20 lines classified into group B displayed a reduced number of clonal cells (fig. 3.1). We observed two phenotypic subgroups; one with number of clonal cells varying from 10 to 30 per larva (10 lines –subgroup B 0, low number) and one with less than 10 clonal cells per larva (10 lines - subgroup B I, extremely low number).
Figure 3.1. The phenotypes of group B – low number of clonal cells. Dorsal trunk of wt (A) and two mutant lines (B and C). Lines classified into this group were divided into two sub-groups: with clone number between 10 and 30 (B 0 – B) and below 10 (B I – C) Arrowheads indicate clones in transverse connectives.
3.2.3 Group C – small clonal cells
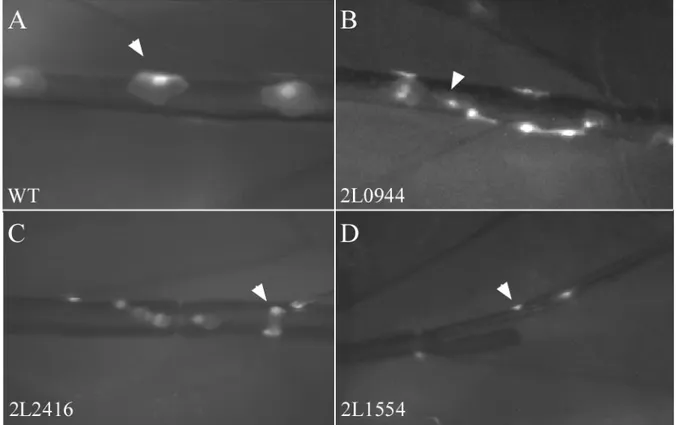
Group C consists of 47 lines with clonal cells of reduced size (fig 3.2). Here we also distinguished more than one type of defect. In 7 lines the size reduction was very strong (subgroup C I, extremely
small clonal cells) and in 20 lines the small size of the clonal cells was combined with their low number (subgroup C II, low number and small clonal cells). In addition to reduced size clonal cells often had irregular shapes, especially in the dorsal trunk (fig. 3.2 C).
Figure 3.2. The phenotypes of group C – small clonal cells. Dorsal trunk with wt (A) and mutant (B-D) clonal cells (arrowheads). Lines representing three sub-groups are shown, B – small clonal cells (C 0), C – extremely small clonal cells (C I) and D – low number and small clonal cells (C II). Clonal cells in the mutant line in C did not show the hexagonal shape typical for wild type dorsal trunk cells.
3.2.4 Group D – dorsal trunk defects
The 28 lines from group D showed defects in the dorsal trunk (DT). We classified them into five subgroups.
The first – D 0 - consists of 6 lines with defects not observed in any other subgroup.
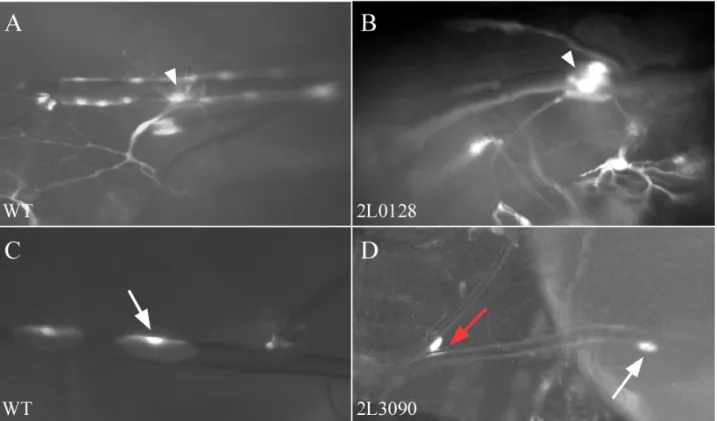
• 2L0128 – clonal cells in DT larger than wild type (fig 3.3 B)
• 2L0196 - DT narrowed within clonal cell
• 2L0372 – smaller lumen and irregular shape of clonal cells in DT
• 2L3090 – rounded and smaller clonal cells in DT and secondary branches (fig 3.3 D)
• 2L3191 – irregular lumen in DT at clonal position
• 2L4771 – bendings in fusion cells of DT if clonal, no clonal cells in terminal branches and no clonal cells in other fusion cells
Figure 3.3 Phenotypes of group D 0. In line 2L0128 (B) clonal cells on dorsal trunk (DT) - arrowhead - are larger than in wt (A). Clonal cell in dorsal trunk and transverse connective (TC) of line 2L3090 (D, white arrow DT, red TC) are smaller and rounded up comparing to wt (C).
The second subgroup – (D I – dorsal trunk bending) consists of 10 lines. They exhibited bendings of the dorsal trunk at the position of clonal cell (fig.3.4) whereas other branches were unaffected.
Figure 3.4 Group D I – DT bendings – in the mutant (B) dorsal trunk bends at position of clonal cells (arrowheads) what is not observed in wild type (A)
In four lines belonging to subgroup D II clonal cells were present only in the dorsal trunk (data not shown).
The subgroup D III consisting of five lines had small clonal cells in the dorsal trunk (fig. 3.5). The defect in the size of clonal cell was restricted to the dorsal trunk. The clonal cells on other branches were like in wild type.
Figure. 3.5 Group D III – small clonal cells in DT. Clonal cells in DT (arrows) of mutant line (B) are reduce in size comparing to wt (A)
The last subgroup, D IV (low number/no clonal cells in the dorsal trunk; data not shown), was characterized by a low number or complete lack of clonal cells in the dorsal trunk and harboured three lines.
3.2.5 Group E – terminal branching phenotypes
The last class, consisting of 81 lines with terminal branching phenotypes, was divided into six subgroups.
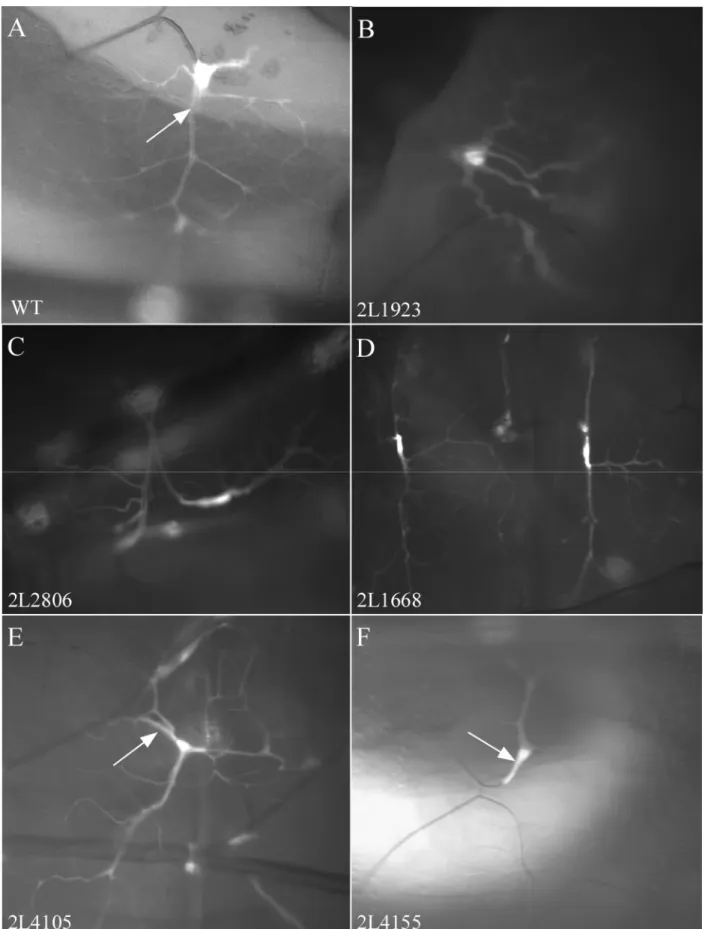
The subgroup E 0 includes 10 lines with complex defects.
• abnormal formation of terminal branches (2L1668, 2L1923, 2L2806, 2L3047, 2L3193, 2L3393; fig. 3.6, B-D)
• larger diameter of terminal branches (2L2084, 2L2944, 2L3807; not shown)
• smaller diameter of terminal branches (2L4105, 2L4515; fig 3.6 E)
• abnormal ratio of clonal cells in terminal branches and other types of branches (2L4155, 2L3807; not shown)
• fewer branches in terminal cells (2L4155, 2L2944; fig 3.6 F)
• no lumen in terminal branches (2L4155; fig 3.6 F)
The subgroup E I (terminal branches crossing/fusion) is characterized by ‘terminal branch crossing’
(fig. 3.7). Two types of this defect can be distinguished: crossing of branches of single terminal cell and crossing of branches of two different cells. As shown in fig.3.7 A-B, in wild type the branches of neighbouring terminal cells, even if growing into the same region of tissue, never crossed the
‘border’ present between them and thus did not cross each other. In mutants such a restriction was not observed. Also the phenomenon of ‘crossing’ or fusion between branches of single terminal cell found in these mutants (fig. 3.7 C-F) did not occur in the wild type larvae. We identified 24 lines with such a phenotype.
The subgroup E II (less or no branches) consists of eleven lines exhibiting reduced or completely absent branching of terminal cells. The strength of this phenotype differs between the lines as depicted in fig 3.8. In some lines terminal cell formed a proper tree, but the cytoplasmic extensions were shorter (fig 3.8 B). In other branching did not occur at all (fig 3.8 C) or was strongly reduced (fig 3.8 D). Finally, in a few lines branching stopped after the first ramification (fig 3.8 E and F).
In four lines from subgroup E IV (expanded/elongated terminal branches) the opposite phenotype - excessive branching - was observed. Lines from this subgroup are shown in fig 3.9. In all lines, terminal cells were strongly ramified compared to wild type cells at similar positions (dorsal terminal cells).
Figure 3.6 Phenotypes of group E 0. A – wt terminal clonal cell – branches were growing in all direction and formed extended trees. Gas filled lumen could be visible (arrow). B-D – different examples of abnormal TB formation. E – diameter of the lumen was smaller than in wt (arrow). F – no gas filled lumen could be seen in terminal cell (arrow), very few branches could be found.
Figure 3.7 Phenotypes of group E I –‘terminal branches crossing/fusion’. In wt (A) two neighbouring terminal cells populating the same region of target tissue do not cross each other and do not cross ‘border’ between their regions (dotted line). Also branches of individual cell do not cross each other or fuse. In mutant lines neighbouring cells cross
‘the border’ (dotted line in B) and branches of other cells (C, arrow). Also within single cell ‘crossing’ can be observed (arrow in D and F). Additionally in few lines (i.e. 2L2445) branches fuse (E, arrowhead)
Figure 3.8 Phenotypes of group E II – less or no branches. A - wt terminal cell. B-F - examples of mutant cells with different strength of phenotype. B – weak - tree is properly formed but branches are shorter; C – strong – branching almost completely abolished; D – branching strongly reduced; E-F – mild – branching stops after first ramification.
Fig. 3.9 Group E IV – expanded terminal branches. Dorsal branches of mutant lines (B-D) are more ramified than the wt (A)
The subgroup E III exhibited problems with lumen formation within the terminal branches. The strongest phenotype in this group was a complete abolition of lumen formation within the branch as depicted in fig. 3.10 G-H (6 lines). Also milder phenotypes with partially formed lumen were found (10 lines fig 3.10 C-D). In three cases we observed properly formed but mispositioned lumen. In the wild type, the lumen was placed centrally in the cell whereas in these lines it was on the side and in one case lumen seemed to ‘turn back’ within the cell (fig. 3.10 E-F). Most of the 19 lines showed reduced number and length of branches. Additionally two lines were lacking lumen in clonal cells in secondary branches.
The subgroup E V, the last class with terminal branching defects, consists of 13 lines in which no clones could be observed in terminal cells or their number was strongly reduced in comparison to the number of clones in other branches (data not shown).
Figure 3.10 Group E III – lumen formation problems. Right panel: – GFP; left panel: bright field images of the same cells. A- wild type terminal cell of dorsal branch. White arrow indicates presence of gas filled lumen, red arrowhead shows centrally placed lumen within the cell. In line 2L3340 (C-D) terminal cells do branch, but gas filled lumen is only partially formed (arrows). White arrowheads in E and F mark branch ‘turning back’ within the cell. The lumen of this cell is misplaced to the lateral side of the branch (red arrowhead). G and H: complete abolishment of lumen formation within clonal cell (arrow).
3.3 Complementation test
To evaluate if any of the observed phenotypes are caused by mutations in the same gene we performed complementation tests. Phenotypes of mutant lines can be observed only in clonal analysis which requires crossing in the MARCM system components. Thus it was impossible to complement the phenotypes of different lines. Hence we decided to complement mutant lines for lethality.
First we checked all the lines except the ‘no clones’ group if they were homozygous lethal or not.
We found 78% of lines from groups B-E to be homozygous lethal. We tested these lines within each phenotypic group for absence of complementation. We did not cross lines from different groups, except for subgroup C II (low number and small clonal cells) and group B.
No of lines Group
In total
lethals
Lethality
%
No of comple mentati on groups
Complementation groups
Group members No of single
hits
A 163 - - - - - -
B1 2L4332/2L4449
B 20 13 65 2
B/C1 2L3456(CII)/2L4332 10 C1 2L2416/2L2648/2L3301 C2 2L3301/2L3918/2L3937 C3 2L4081/2L1749/2L2953 C4 2L4081/2L2816 C5 2L2816/2L3547 C6 2L3311/2L3500/2L3908 C7 2L3908/2L3642 C8 2L1663/2L3642/2L3390 C9 2L1663/2L2572 C10 2L1554/2L2572 C11 2L1554/2L2269 C12 2L2269/2L2526 C13 2L3569/2L3948 C14 2L1360/2L4774 C15 2L0944/2L3651/2L4508 C 47 41 87.2% 16
C16 2L4508/2L3456
14
D1 2L0439/2L1506/2L1687 2L2181/2L3179/
2L3696/2L3910/2L4333
D2 2L0028/2L1693/2L3707 D 28 24 85.7 3
D3 2L2676/2L2769/2L3090 10
E1 2L1923/2L3244 E2 2L3637/2L4501
E 81 58 71.6 3
E3 2L2218/2L3443
52