Continuous thermosalinograph oceanography along RV POLARSTERN cruise track PS120
Data Processing Report
Contents
1 Introduction 1
2 Sensor Details 1
3 Processing Report 2
4 Appendix 6
Contact:
Gerd Rohardt
Alfred-Wegener-Institute
Am Handelshafen 12, D-27570 Bremerhaven, GERMANY Mail: info@awi.de
Processing Agency:
FIELAX
Gesellschaft für wissenschaftliche Datenverarbeitung mbH Schleusenstr. 14, D-27568 Bremerhaven, GERMANY Tel: +49 (0) 471 30015 0
Fax: +49 (0) 471 30015 22 Mail: info@fielax.de
Ref.: PS120_TSG.pdf Vers.: 1 Date: 2019/08/26 Status: final
1 Introduction
This report describes the processing of raw data acquired by the thermosalinographs on board RV Polarstern during expedition PS120 to receive cleaned up and corrected salinity data. Detailed description of the processing of the data and the workflow is given in the general report “General Processing Report of Surface T/S Data RV Polarstern Cruises PS116, PS117, PS118, PS119 and PS120”.
Cruise details
Vessel name: RV Polarstern Cruise name: PS120 Cruise start: 2019-06-02 Cruise end: 2019-06-29 Cruise duration: 27 days
Working area: Atlantic, transit cruise
2 Sensor Details
Following sensors were installed during cruise PS120. Only data fromTSG2are uploaded to PAN- GAEA for cruise PS120 and are furthermore considered in this report (for reasoning see General Processing Report).
TSG1 TSG2
Serial number SBE21-3203 SBE21-3271
Installation 2018-10-16 2018-10-16
Deinstallation 2019-06-28 2019-06-28
Days installed 255 255
External temperature sensor SBE38-110 SBE38-119
3 Processing Report
Database Extraction
Data source DSHIP database (dship.awi.de)
Start of raw file 2019-06-02T16:00:00
End of raw file 2019-06-29T05:59:59
Number of lines in hexadecimal raw file
2296800
First dataset 2019-06-03T11:27:32
Last dataset 2019-06-28T12:39:59
TSG1 valid data 531332
Calculation of 10min means
The calculation of 10min means included the removal of outliers outside a 2-times standard devia- tion for each data interval. The number of outliers for each parameter are given here.
Number of outliers >2*std Internal temperature 14998
Conductivity 14234
External temperature 15220
Salinity 18960
Result after outlier removal Number 10-min-means 3546
Manual flagging
After processing the data were visually inspected. The whole data from a specific timestamp were deleted if there was only one parameter to be manually flagged. 9data points were manually re- moved from the TSG2 dataset of PS120.
Assigning navigation data
Data from the corrected mastertrack of cruise PS120 were assigned to the 10min means of TSG2.
A speed filter of 0.5 knots minimum speed is applied to avoid redundant data. See Figure 1 and Figure 2 for the processed and corrected data of TSG2.
Number of speed flags: 196
Number of data in final output file: 3341
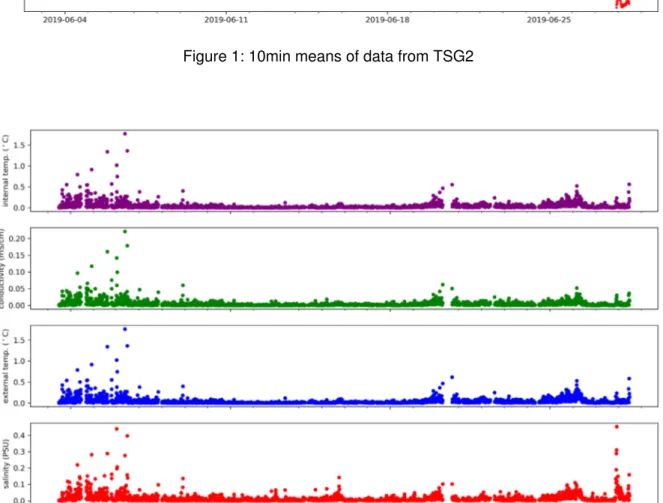
Figure 1: 10min means of data from TSG2
Figure 2: Standard deviations of 10min means of data from TSG2
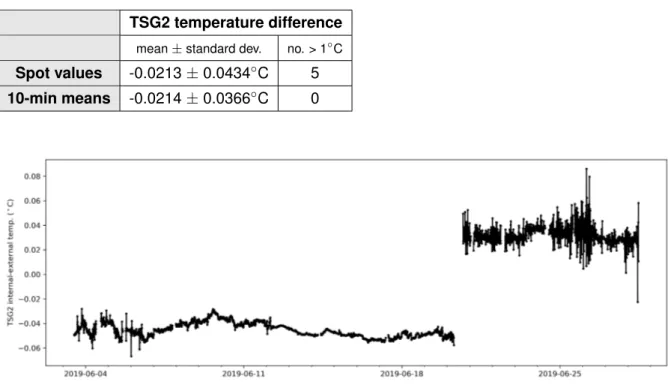
Differences between internal and external temperature of TSG2 temperature sensors
Temperature differences between the internal and the external temperature sensors have to be small under normal circulation conditions. Means and standard deviations for the temperature differences as well as the number of data with a difference larger than 1 ◦C are given in the following table and are shown in Figure 3. As can be seen in Figure 3 some abnormalities occured during cruise PS120. Usually, internal temperatures are slightly higher than external temperatures because of flow conditions in the TSG system. However, during the first part of cruise PS120 the opposite is the case with internal temperatures being smaller than external temperatures and scatter being strik- ingly reduced. Things changed to normal after port time in Las Palmas where the whole system was restarted. No further explanations could be obtained by concrete demands. Therefore we suggest careful handling of the data of cruise PS120.
TSG2 temperature difference
mean±standard dev. no. > 1◦C
Spot values -0.0213±0.0434◦C 5 10-min means -0.0214±0.0366◦C 0
Figure 3: Differences between internal and external temperature sensors of TSG2
Result file
The result file is a plain text (tab-delimited values) file named PS120_surf_oce.tabwith one data row in 10-min interval. For further information on the result file see the General Processing Report.
Comments
Data gaps due to system maintenance or system shutdown during harbour time:
- 19.06.2019 08:35 UTC till 08:53 UTC Update of Dship data aquisition - 20.06.2019 07:30 UTC till 16:42 UTC harbour time at Las Palmas
Apart from this, data gaps are caused by speed flagging or manual removal of outliers.
4 Appendix
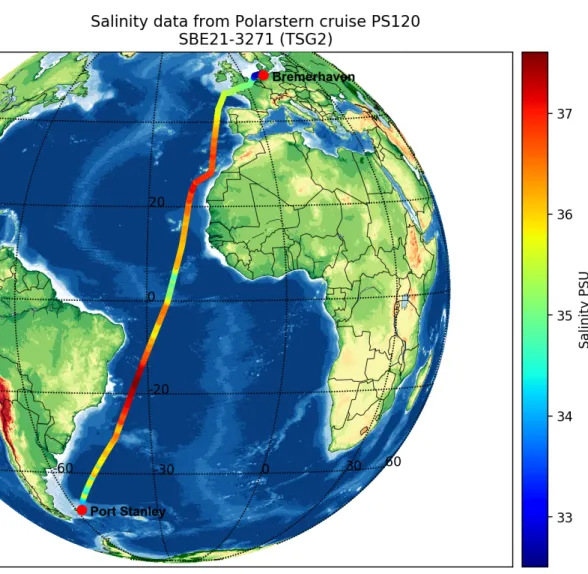
Figure 4: Salinity data from TSG2
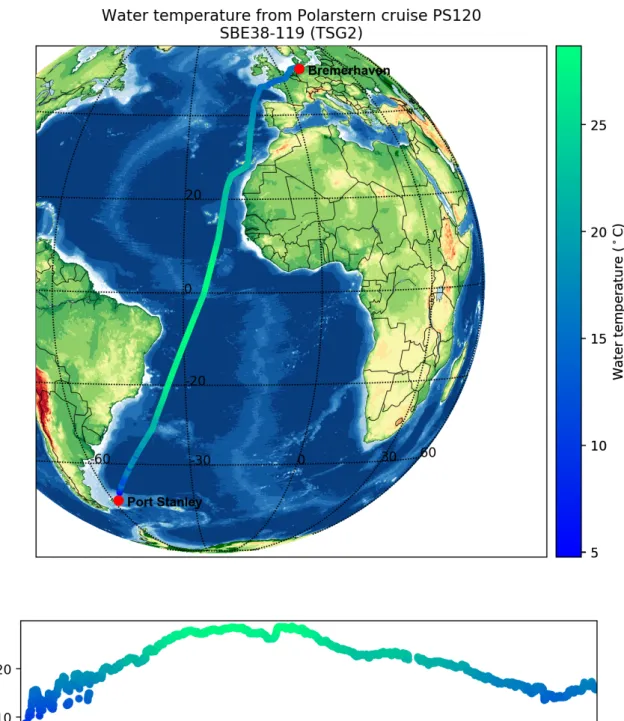
Figure 5: Temperature data from TSG2