CTD Data Processing Report
RV POLARSTERN Cruise PS118
Dr. Sandra Tippenhauer and Gerd Rohardt
Contents
1. Introduction ... 1
2. Cruise Details ... 1
3. Instrument and Software Configuration ... 1
4. Station list and notes ... 2
5. In-situ Salinity Calibration ... 3
6. In-situ Oxygen Calibration ... 7
7. Data Processing ... 7
Appendix
A Pre-cruise Calibration B Post-cruise Calibration
1
1. Introduction
This document reports about the processing of CTD raw data acquired during expedition PS118 by a Seabird SBE 911plus CTD on board RV POLARSTERN.
2. Cruise Details
Vessel RV POLARSTERN
Cruise PS118
Region Weddell Sea
Departure Punta Arenas, 19 February 2019
Arrival Punta Arenas, 10 April 2019
Responsible operator Markus Janout, Alfred-Wegener-Institute, Germany Responsible for data processing Sandra Tippenhauer, Alfred-Wegener-Institute, Germany
Number of CTD casts 52
Number of processed casts 52
3. Instrument and Software Configuration
This chapter summarized the configuration of the acquisition software, the rosette assembly, CTD sensors, and salinometer.
Software
CTD data acquisition SBE1 SeasaveV7, Version 7.23.1 CTD on board
processing
ManageCTD2
Matlab® Individual tools
Rosette assembly
CTD/Deckunit SBE911 plus; SN 937 (on board system) Carousel Water
Sampler SBE32
Sensors
Type SN Pre-calibration Post-calibration
Pressure Digiquartz with TC 937 14-Nov-2017 -/-
Primary Temperature SBE3plus 2929 23-Nov-2017 13-Sep-2019
Primary Conductivity SBE4c 1198 15-Nov-2017 17-Sep-2019
Secondary Temperature SBE3plus 5112 29-Jun-2018 13-Sep-2019
Secondary Conductivity SBE4c 3570 03-Jul-2018 17-Sep-2019
Oxygen SBE43 1597 06-Jul-2018 25-Sep-2019
Transmisometer3 Wetlabs CSTAR 1198 17-Dec-2008 -/-
Fluorometer3 Wetlabs EcoFLR 1853 26-May-2010 -/-
Altimeter3 Benthos PSA900D 51533 -/- -/-
2 Salinometer
OPS SN 006
Standard Seawater P160; K15 = 0.99983, expiry date 2019-07-20.
Remarks:
1 : SBE = Sea Bird Scientific
2 : AWI software package which includes SBEDateProcessing, Version 7.22.5
3 : Not calibrated, use relative values only or no required
4. Station list and notes
This chapter contains a station list and the notes made during CTD casts. CTD worked fine without any serious problems.
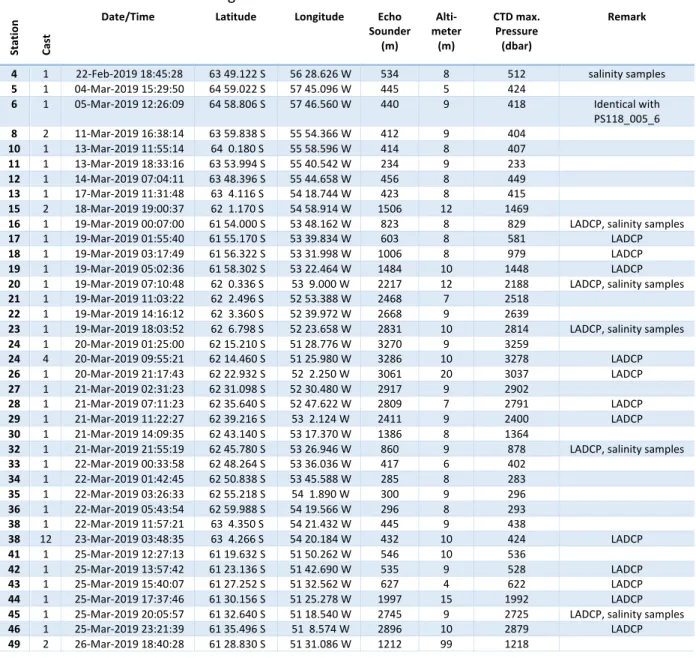
Tab. 1: List of CTD stations from leg PS118
Station Cast
Date/Time Latitude Longitude Echo
Sounder (m)
Alti- meter
(m)
CTD max.
Pressure (dbar)
Remark
4 1 22-Feb-2019 18:45:28 63 49.122 S 56 28.626 W 534 8 512 salinity samples 5 1 04-Mar-2019 15:29:50 64 59.022 S 57 45.096 W 445 5 424
6 1 05-Mar-2019 12:26:09 64 58.806 S 57 46.560 W 440 9 418 Identical with PS118_005_6 8 2 11-Mar-2019 16:38:14 63 59.838 S 55 54.366 W 412 9 404
10 1 13-Mar-2019 11:55:14 64 0.180 S 55 58.596 W 414 8 407 11 1 13-Mar-2019 18:33:16 63 53.994 S 55 40.542 W 234 9 233 12 1 14-Mar-2019 07:04:11 63 48.396 S 55 44.658 W 456 8 449 13 1 17-Mar-2019 11:31:48 63 4.116 S 54 18.744 W 423 8 415 15 2 18-Mar-2019 19:00:37 62 1.170 S 54 58.914 W 1506 12 1469
16 1 19-Mar-2019 00:07:00 61 54.000 S 53 48.162 W 823 8 829 LADCP, salinity samples
17 1 19-Mar-2019 01:55:40 61 55.170 S 53 39.834 W 603 8 581 LADCP
18 1 19-Mar-2019 03:17:49 61 56.322 S 53 31.998 W 1006 8 979 LADCP
19 1 19-Mar-2019 05:02:36 61 58.302 S 53 22.464 W 1484 10 1448 LADCP
20 1 19-Mar-2019 07:10:48 62 0.336 S 53 9.000 W 2217 12 2188 LADCP, salinity samples 21 1 19-Mar-2019 11:03:22 62 2.496 S 52 53.388 W 2468 7 2518
22 1 19-Mar-2019 14:16:12 62 3.360 S 52 39.972 W 2668 9 2639
23 1 19-Mar-2019 18:03:52 62 6.798 S 52 23.658 W 2831 10 2814 LADCP, salinity samples 24 1 20-Mar-2019 01:25:00 62 15.210 S 51 28.776 W 3270 9 3259
24 4 20-Mar-2019 09:55:21 62 14.460 S 51 25.980 W 3286 10 3278 LADCP
26 1 20-Mar-2019 21:17:43 62 22.932 S 52 2.250 W 3061 20 3037 LADCP
27 1 21-Mar-2019 02:31:23 62 31.098 S 52 30.480 W 2917 9 2902
28 1 21-Mar-2019 07:11:23 62 35.640 S 52 47.622 W 2809 7 2791 LADCP
29 1 21-Mar-2019 11:22:27 62 39.216 S 53 2.124 W 2411 9 2400 LADCP
30 1 21-Mar-2019 14:09:35 62 43.140 S 53 17.370 W 1386 8 1364
32 1 21-Mar-2019 21:55:19 62 45.780 S 53 26.946 W 860 9 878 LADCP, salinity samples 33 1 22-Mar-2019 00:33:58 62 48.264 S 53 36.036 W 417 6 402
34 1 22-Mar-2019 01:42:45 62 50.838 S 53 45.588 W 285 8 283 35 1 22-Mar-2019 03:26:33 62 55.218 S 54 1.890 W 300 9 296 36 1 22-Mar-2019 05:43:54 62 59.988 S 54 19.566 W 296 8 293 38 1 22-Mar-2019 11:57:21 63 4.350 S 54 21.432 W 445 9 438
38 12 23-Mar-2019 03:48:35 63 4.266 S 54 20.184 W 432 10 424 LADCP
41 1 25-Mar-2019 12:27:13 61 19.632 S 51 50.262 W 546 10 536
42 1 25-Mar-2019 13:57:42 61 23.136 S 51 42.690 W 535 9 528 LADCP
43 1 25-Mar-2019 15:40:07 61 27.252 S 51 32.562 W 627 4 622 LADCP
44 1 25-Mar-2019 17:37:46 61 30.156 S 51 25.278 W 1997 15 1992 LADCP
45 1 25-Mar-2019 20:05:57 61 32.640 S 51 18.540 W 2745 9 2725 LADCP, salinity samples
46 1 25-Mar-2019 23:21:39 61 35.496 S 51 8.574 W 2896 10 2879 LADCP
49 2 26-Mar-2019 18:40:28 61 28.830 S 51 31.086 W 1212 99 1218
3
Station Cast
Date/Time Latitude Longitude Echo
Sounder (m)
Alti- meter
(m)
CTD max.
Pressure (dbar)
Remark
51 1 27-Mar-2019 04:32:23 60 50.808 S 50 11.898 W 1899 8 1881 LADCP
52 1 27-Mar-2019 06:54:45 60 51.024 S 50 0.198 W 2147 10 2137 LADCP
53 1 27-Mar-2019 10:14:51 60 51.108 S 49 45.630 W 2599 11 2612 LADCP, salinity samples 54 1 27-Mar-2019 13:17:02 60 50.436 S 49 35.502 W 2689 7 2671
55 1 27-Mar-2019 16:10:22 60 50.844 S 49 23.442 W 2553 13 2524 LADCP
56 1 27-Mar-2019 18:44:47 60 50.652 S 49 12.336 W 1903 10 1868 LADCP
57 1 27-Mar-2019 21:00:21 60 50.682 S 49 0.228 W 1122 10 1094 LADCP
58 1 27-Mar-2019 23:59:29 60 51.234 S 48 31.968 W 2090 10 2054
59 1 28-Mar-2019 03:04:34 60 51.030 S 48 11.790 W 2632 10 2608 LADCP
60 1 28-Mar-2019 06:08:35 60 51.090 S 47 54.054 W 2253 11 2218 LADCP, salinity samples
61 1 28-Mar-2019 09:32:05 60 50.994 S 47 31.032 W 1973 10 1947 LADCP
62 1 28-Mar-2019 13:22:59 60 55.842 S 46 33.516 W 327 7 324
71 2 31-Mar-2019 20:21:26 61 4.644 S 51 46.458 W 890 12 862 LADCP
82 2 04-Apr-2019 14:39:05 61 13.392 S 52 29.406 W 1002 11 971 LADCP
5. In-situ Salinity Calibration
To monitor the accuracy and precision of the CTD’s conductivity sensors, water samples were taken on 23 CTD casts for salinity/conductivity measurements. 22 double samples were taken to increase accuracy. 11 samples where contaminated and are thus not discussed here.
Samples were taken from different depths to investigate the influence of pressure on the conductivity sensor. The sampled water depth with the corresponding bottle data is given in Table 2.
During data processing (CTDdespike) it was found that the T/S profiles from the secondary sensor pair are noisier than from the primary sensor pair. Therefore, the data from the primary sensor pair was taken for the final data set.
The statistics of the differences between the primary and secondary sensor pair is shown in Figure 1.
The general behavior of the sensors was good.
The difference of salinities measured with the Optimare Precision Salinometer (OPS) and salinities measured with the CTD are used to correct for the pressure-effect and for a temporal drift of the sensors. The mean of the difference of salinities measured with the OPS and salinities measured with the CTD primary sensor pair (S0) was -0.0017 with a standard deviation of 7.25e-4.
Tab. 2: Comparison of CTD measured salinities and salinity samples measured with the OPS. The table gives the station name (Station) and date (Date Time) of each station where samples have been taken, the depth of the sample origin (press), the salinities measured with the CTD primary sensor (s0) and secondary sensor (s1), the salinity measured with the OPS, as well as the differences of the OPS measurements and the primary (OPS-s0) and secondary (OPS-s1) sensor pair of the CTD.
Station Date Time press s0 s1 OPS OPS-s0 OPS-s1
ps118_004_1 22.02.2019 18:30 404 34,5056 34,5031 34,5086 0,0030 0,0055 404 34,5056 34,5031 34,5083 0,0027 0,0052 404 34,5056 34,5031 34,5090 0,0034 0,0059 404 34,5056 34,5031 34,5088 0,0032 0,0057 ps118_005_1 04.03.2019 15:15 423 34,5760 34,5736 34,5775 0,0015 0,0039 253 34,5517 34,5490 34,5542 0,0025 0,0052 ps118_013_1 17.03.2019 11:19 415 34,5642 34,5606 34,5638 -0,0004 0,0032 303 34,5018 34,4986 34,5014 -0,0004 0,0028 102 34,2020 34,2031 34,2156 0,0136 0,0125
3 33,8378 33,8356 33,8405 0,0027 0,0049
ps118_015_2 18.03.2019 18:27 1215 34,5741 34,5712 34,5738 -0,0003 0,0026 809 34,5502 34,5472 34,5504 0,0002 0,0032 405 34,5305 34,5270 34,5304 -0,0001 0,0034
20 33,5432 33,5418 33,5457 0,0025 0,0039
ps118_016_1 18.03.2019 23:47 455 34,5417 34,5390 34,5419 0,0002 0,0029
4
Station Date Time press s0 s1 OPS OPS-s0 OPS-s1
455 34,5417 34,5390 34,5423 0,0006 0,0033 ps118_018_1 19.03.2019 02:52 810 34,6301 34,6268 contaminated
ps118_018_1 19.03.2019 02:52 810 34,6301 34,6268 34,6302 0,0001 0,0034 530 34,6432 34,6369 contaminated
530 34,6432 34,6369 34,6437 0,0005 0,0068 ps118_020_1 19.03.2019 06:22 1827 34,6422 34,6386 34,6414 -0,0008 0,0028 1827 34,6422 34,6386 34,6410 -0,0012 0,0024
2 33,4280 33,4260 33,4299 0,0019 0,0039
2 33,4280 33,4260 33,4310 0,0030 0,0050
ps118_022_1 19.03.2019 13:18 2031 34,6468 34,6431 34,6454 -0,0014 0,0023 1013 34,6785 34,6748 34,6776 -0,0009 0,0028 ps118_023_1 19.03.2019 17:06 911 34,6773 34,6735 34,6761 -0,0012 0,0026 911 34,6773 34,6735 34,6754 -0,0019 0,0019
20 33,3955 33,3947 33,4568 0,0613 0,0621
20 33,3955 33,3947 33,4552 0,0597 0,0605
ps118_027_1 21.03.2019 01:31 1012 34,6830 34,6792 34,6820 -0,0010 0,0028 1012 34,6830 34,6792 34,6812 -0,0018 0,0020
505 34,6841 34,6807 contaminated
505 34,6841 34,6807 34,6833 -0,0008 0,0026 ps118_030_1 21.03.2019 13:39 1113 34,6401 34,6366 34,6398 -0,0003 0,0032 1113 34,6401 34,6366 34,6385 -0,0016 0,0019 608 34,6609 34,6573 34,6602 -0,0007 0,0029 608 34,6609 34,6573 34,6592 -0,0017 0,0019 ps118_032_1 21.03.2019 21:31 877 34,6346 34,6313 contaminated
877 34,6346 34,6313 34,6351 0,0005 0,0038 ps118_033_1 22.03.2019 00:21 303 34,6087 34,6055 34,6099 0,0012 0,0044 303 34,6087 34,6055 34,6089 0,0002 0,0034 ps118_035_1 22.03.2019 03:16 278 34,4938 34,4906 34,4960 0,0022 0,0054 278 34,4938 34,4906 34,4954 0,0016 0,0048
2 33,9433 33,9404 33,9666 0,0233 0,0262
2 33,9433 33,9404 33,9662 0,0229 0,0258
ps118_041_1 25.03.2019 12:11 505 34,5760 34,5731 contaminated
505 34,5760 34,5731 34,5744 -0,0016 0,0013 404 34,5745 34,5718 34,5760 0,0015 0,0042 404 34,5745 34,5718 34,5760 0,0015 0,0042 ps118_043_1 25.03.2019 15:22 557 34,6048 34,6012 contaminated
25.03.2019 15:22 557 34,6048 34,6012 contaminated 305 34,5560 34,5528 contaminated
305 34,5560 34,5528 34,5559 -0,0001 0,0031 ps118_045_1 25.03.2019 19:08 2437 34,6454 34,6416 34,6431 -0,0023 0,0015 2437 34,6454 34,6416 34,6432 -0,0022 0,0016
709 34,6877 34,6839 contaminated
709 34,6877 34,6839 34,6861 -0,0016 0,0022 ps118_051_1 27.03.2019 03:50 1624 34,6500 34,6462 34,6483 -0,0017 0,0021 1624 34,6500 34,6462 34,6483 -0,0017 0,0021 1216 34,6521 34,6484 34,6507 -0,0014 0,0023 1216 34,6521 34,6484 34,6505 -0,0016 0,0021 ps118_054_1 27.03.2019 12:21 2540 34,6446 34,6406 34,6423 -0,0023 0,0017 2540 34,6446 34,6406 34,6421 -0,0025 0,0015 2030 34,6476 34,6440 34,6455 -0,0021 0,0015 2030 34,6476 34,6440 34,6454 -0,0022 0,0014 ps118_055_1 27.03.2019 15:13 2439 34,6460 34,6422 34,6444 -0,0016 0,0022 2439 34,6460 34,6422 34,6443 -0,0017 0,0021 2130 34,6476 34,6439 34,6454 -0,0022 0,0015 2130 34,6476 34,6439 34,6452 -0,0024 0,0013 ps118_058_1 27.03.2019 23:15 1622 34,6554 34,6518 contaminated
1622 34,6554 34,6518 contaminated
1318 34,6574 34,6538 34,6547 -0,0027 0,0009 1318 34,6574 34,6538 34,6541 -0,0033 0,0003 ps118_060_1 28.03.2019 05:21 769 34,6674 34,6654 34,6681 0,0007 0,0027 769 34,6674 34,6654 34,6683 0,0009 0,0029
5 Fig. 1: The statistics of the differences between the primary and secondary sensor pair from layers below 100 m and gradients less than 0.002 (°C/m or mS/m2).
Determining the pressure effect and temporal drift
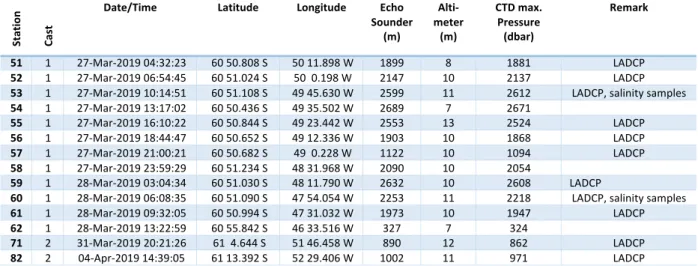
To determine a pressure effect or a temporal drift of the sensors, the difference of salinities (Sdiff) measured with the OPS (SOPS) and salinities measured with the CTD (SSenor1 or SSensor2), is fitted against pressure and time using a first order polynomial and the matlab function polyfit.
Sdiff = SOPS - SSenor1 or 2
Because gradients are strong in shallow water depths, only samples taken from deep layers should be used for the corrections (below 1000m). For this cruise only 10 samples were taken below 1000m.
Therefor we use all samples taken below 500m depth, to better constrain the fit for correcting the pressure-effect. Additionally, Sdiff was set to be zero at the surface, as the pressure effect should vanish there. The resulting pressure-effect-correction has an offset of -8.0797e-5 and a slope of -8.8099e-7 (Fig.
2 and 3).
After correcting the bottle-data for the pressure effect, we determine the temporal drift using samples taken below 1000m depth. Here we use only the deep samples, as their temporal distribution is such, that we would not cover a lager timeframe by using the shallow samples. We would thus not gain precision by including the shallow and less accurate samples. The resulting correction for the temporal drift has an offset of 66.3881 and a slope of -9.0017e-5.
6 Figure 4 shows the diference of salinities measured with the OPS and salinities derived from the primary CTD conductivity sensor after applying the correction for pressure effect and temporal drift on the bottle data. The corrections are applied to the data as documented in section 7.
The pressure effect and temporal drift where determined without taking the temporal drift of the temperature sensor into account, because it is unknown.
Fig. 2: Differences of salinities measured with the OPS and salinities measured with the CTD (blue – primary sensor pair, red – secondary sensor pair) from all water samples taken. Upper panel shows the temporal evolution, the lower panel shows the pressure dependence.
Fig. 3: Same as fig. 2 but zoomed, showing only samples taken below 500m depths. Upper panel shows the temporal evolution, the lower panel shows the pressure dependence with the coefficients of the fit.
7 Fig. 4: Differences of salinities measured with the OPS and salinities measured with the CTD primary sensor pair before (dark blue) and after applying the corrections (light blue). Upper panel shows the temporal evolution, the lower panel shows the pressure dependence.
6. In-situ Oxygen Calibration
During this cruise, no oxygen samples were taken, but the same sensor was used as on the cruise before (PS117). On PS117, water samples were taken on 31 CTD casts. Duplicates were taken to verify the results. In total 216 comparisons between SBE43 and measured samples exist. Therefore, the correction used for PS117 was also applied to the data of this cruise. Details of the corrections can be found in the Processing Report of PS117 https://doi.pangaea.de/10.1594/PANGAEA.910663.
7. Data Processing
CTD data processing at AWI is performed using the software ManageCTD. It consists of several processing steps including:
• conversion of raw data into physical units using the SeaBird Data Processing software
• cutting the profile to start at the surface
• merge meta data from the DShip system into the CTD data
• despike the data
• compare data from primary and secondary sensor pair
• visual inspection of T-S-properties
• export data for Ocean Data View
In the processing step Despike, spikes (suspicious, incorrect values) can be removed from the profile.
The respective data point can be set to NAN or the gab can be interpolated. Table 3 gives an overview which profiles where edited.
8 Tab. 3: Number of interpolated or removed spikes in the respective profile. The table gives the Station number (Station), Cast number (cast), the total length of the profile in number of bins (Record), and the channels that have been edited (Temp – temperature, SAL – salinity, O2 – oxygen, FCHL – Fluorescence Chlorophyll a, Trans – Transmissometer). All profiles where checked but the ones not edited, are not listed here.
Station Cast Records TEMP SAL O2 FCHL TRANS
8 2 402 1 0 0 0 0
16 1 826 0 0 0 0 2
17 1 579 1 1 0 0 0
19 1 1447 0 1 0 0 0
23 1 2811 0 1 0 0 0
28 1 2789 0 0 0 0 1
41 1 533 0 1 0 0 0
46 1 2878 0 0 0 0 2
51 1 1879 0 0 0 0 2
58 1 2052 1 2 0 0 0
61 1 1947 0 1 0 0 0
71 2 858 0 0 0 0 3
Applying the temperature and salinity correction from in-situ-calibration
The primary sensor pair was selected for the final dataset because it was slightly less noisy compared to the second sensor pair. The calibration coefficient for temperature, as determined from Seabird in the post-cruise-calibration (Appendix B), was applied with a factor of 0.5, as usually done. This has shown to give the best results in recent years, by comparing the data to other data sets recorded in the same area (personal communication, Gerd Rohardt). The salinity was corrected for the effects of pressure and temporal drift.
T0corr = T0 + 0.00087/2 S0corr1 = S0 – (ap + bp * PRES) S0corr2 = S0corr1 – (at + bt * time)
with ap = 8.0797e-5, bp = -8.8099e-7, at = 66.3881, and bt = -9.0017e-5. The mean of the difference of salinities measured with the OPS and measured with the CTD before the corrections, was -0.0017 with a standard deviation of 7.25e-4. After applying the corrections, the mean of salinities measured with the OPS and measured with the CTD was -2.64e-14 with a standard deviation of 5.98e-4.
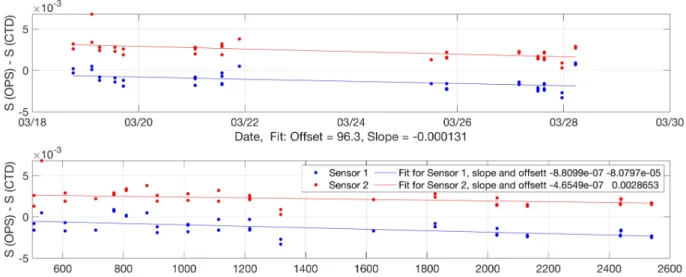
Plots of potential temperature, salinity, potential density (sigma), oxygen, fluorescence, and beam transmission are shown in Figure 8 before the corrections, and in Figure 9, after the corrections have been applied for visual comparison.
Transmissometer and fluorometer
The transmissometer (CSTAR) and fluorometer (ecoFLR) were not calibrated during the cruise. Thus, data is given as “relative units”.
9 Fig. 8: Scatter plot of potential temperature, salinity, potential density (sigma), oxygen, fluorescence, and beam transmission from the 52 CTD casts before the corrections.
Fig. 9: Scatter plot of potential temperature, salinity, potential density (sigma), oxygen, fluorescence, and beam transmission from the 52 CTD casts after the corrections have been applied.
10
Appendix
A. Pre-cruise Calibration
The pre-cruise calibration is presented as the copy of the report file create from SeasaveV7 configuration file.
PSA file: C:\Users\stippenh\AppData\Local\Sea-Bird\Seasave\Seasave_2.psa Date: 02/03/2020
Instrument configuration file: \\psf\Home\Documents\Data\CTD\PS118\conf1\raw\PS118_082_2.XMLCON Configuration report for SBE 911plus/917plus CTD
Frequency channels suppressed : 0 Voltage words suppressed : 0 Computer interface : RS-232C
Deck unit : SBE11plus Firmware Version >= 5.0 Scans to average : 1
NMEA position data added : Yes NMEA depth data added : No NMEA time added : No NMEA device connected to : PC Surface PAR voltage added : No Scan time added : No 1) Frequency 0, Temperature Serial number : 2929 Calibrated on : 23-Nov-17 G : 4.35518269e-003 H : 6.44137593e-004 I : 2.29025545e-005 J : 2.09099434e-006 F0 : 1000.000 Slope : 1.00000000 Offset : 0.0000 2) Frequency 1, Conductivity Serial number : 1198 Calibrated on : 15-Nov-17 G : -4.01609586e+000 H : 5.10250929e-001 I : 1.13545511e-004 J : 2.19067195e-005 CTcor : 3.2500e-006 CPcor : -9.57000000e-008 Slope : 1.00000000 Offset : 0.00000
3) Frequency 2, Pressure, Digiquartz with TC Serial number : 0937
Calibrated on : 14-Nov-17 C1 : -4.377396e+004 C2 : -6.751446e-001 C3 : 1.352380e-002 D1 : 3.663800e-002 D2 : 0.000000e+000 T1 : 3.012220e+001 T2 : -5.074259e-004 T3 : 3.788210e-006 T4 : 4.207950e-009 T5 : 0.000000e+000 Slope : 1.00001734 Offset : -1.54026 AD590M : 1.281700e-002 AD590B : -9.363100e+000
11
4) Frequency 3, Temperature, 2 Serial number : 5112 Calibrated on : 29-Jun-18 G : 4.37936431e-003 H : 6.42094687e-004 I : 2.21867063e-005 J : 2.03044704e-006 F0 : 1000.000 Slope : 1.00000000 Offset : 0.0000
5) Frequency 4, Conductivity, 2 Serial number : 3570 Calibrated on : 03-Jul-18 G : -9.80508724e+000 H : 1.21366567e+000 I : -1.29509578e-003 J : 1.48863867e-004 CTcor : 3.2500e-006 CPcor : -9.57000000e-008 Slope : 1.00000000 Offset : 0.00000 6) A/D voltage 0, Altimeter Serial number : 51533 Calibrated on : 2015 Scale factor : 15.000 Offset : 0.000 7) A/D voltage 1, Free
8) A/D voltage 2, Fluorometer, WET Labs ECO-AFL/FL Serial number : 1853
Calibrated on : 26-May-2010 Dark output : 0.0240
Scale factor : 2.50000000e+001
9) A/D voltage 3, Transmissometer, WET Labs C-Star Serial number : 1198
Calibrated on : 17-Dec-2008 M : 21.6701
B : -1.1919 Path length : 0.250 10) A/D voltage 4, Free 11) A/D voltage 5, Free
12) A/D voltage 6, Oxygen, SBE 43 Serial number : 1597
Calibrated on : 06-Jul-18 Equation : Sea-Bird Soc : 5.14000e-001 Offset : -5.04500e-001 A : -4.30040e-003 B : 1.95920e-004 C : -2.98350e-006 E : 3.60000e-002 Tau20 : 1.10000e+000 D1 : 1.92634e-004 D2 : -4.64803e-002 H1 : -3.30000e-002 H2 : 5.00000e+003 H3 : 1.45000e+003 13) A/D voltage 7, Free
12
B. Post-cruise Calibration
The post-cruise calibration is presented as the scan from original SBE calibration sheets.
13
14
15
-0.004 -0.002 0 0.002 0.004
0 1 2 3 4 5 6 7
Residual (S/m)
Conductivity (S/m)
03-Jul-18 0.9996077 17-Sep-19 1.0000000 f = Instrument Output (kHz)
t = temperature (°C); p = pressure (decibars); d = CTcor; e = CPcor;
Conductivity (S/m) = (g + h * f2+ i * f3 + j * f4) /10 (1 + d * t + e * p) Residual (Siemens/meter) = instrument conductivity - bath conductivity SENSOR SERIAL NUMBER: 3570
CALIBRATION DATE: 17-Sep-19
SBE 4 CONDUCTIVITY CALIBRATION DATA PSS 1978: C(35,15,0) = 4.2914 Siemens/meter COEFFICIENTS:
g = -9.81435640e+000 h = 1.21561666e+000 i = -1.64660992e-003 j = 1.71094168e-004
CPcor = -9.5700e-008 (nominal) CTcor = 3.2500e-006 (nominal)
BATH TEMP (° C)
BATH SAL (PSU)
BATH COND (S/m)
INSTRUMENT OUTPUT (kHz)
INSTRUMENT COND (S/m)
RESIDUAL (S/m) 0.0000
-1.0000 1.0000 15.0000 18.5000 29.0000 32.5000
0.0000 34.8229 34.8234 34.8241 34.8230 34.8194 34.8078
0.00000 2.80506 2.97651 4.27247 4.61916 5.70277 6.07468
2.84527 5.58998 5.71506 6.58360 6.79702 7.42409 7.62729
0.00000 2.80506 2.97651 4.27245 4.61918 5.70275 6.07468
0.00000 0.00000 -0.00000 -0.00002 0.00002 -0.00002 0.00001
Date, Slope Correction
POST CRUISE CALIBRATION
1 Sea-Bird GmbH
Postfach 1167 87401 Kempten Germany
+49 831 9 60994 701 seabird.eu@ seabird.com www.seabird.com Sea-Bird GmbH