CTD Data RV Heincke HE570
Data Processing Report
Contents
1 Introduction 1
2 Workflow 1
3 Cruise details 3
4 Sensor Layout 3
5 Processing 3
6 Results 5
Contact:
Gerd Rohardt
Alfred-Wegener-Institute
Am Handelshafen 12, D-27570 Bremerhaven, GERMANY Mail: info@awi.de
Processing Agency:
FIELAX GmbH
Schleusenstr. 14, D-27568 Bremerhaven, GERMANY
1 Introduction
This report describes the processing of CTD raw data acquired by Seabird SBE 911plus CTD on board RV Heincke during expedition HE570.
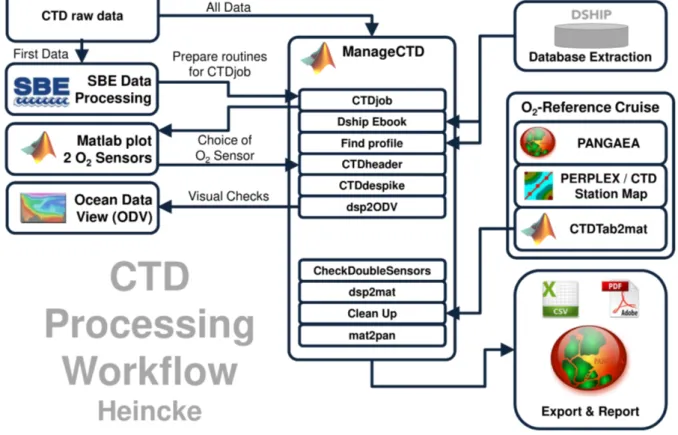
2 Workflow
The different steps of processing and validation are visualized in Figure 1. The CTD raw data and station books are delivered from Gerd Rohardt or Sandra Tippenhauer (AWI). The first CTD station and cast is processed manually in SBE Data Processing to configure the *.psa Seabird routines Data Conversion, Wild Edit, Bottle Summary, Split, Translate, Cell Thermal Mass, Loop Edit and Bin Average. The Seabird routines are then run in a batch jobCTDjobin ManageCTD to process the complete CTD data set. The downcast of each CTD station/cast is used for further processing.
In CTDjob the start record and the lowest altimeter point of the downcast is selected. From the downcast data figures to compare both oxygen sensors are generated. The oxygen sensor choice and the offset between the two oxygen sensors is documented in the processing summary table.
With the Utilities→Dship Ebook function of ManageCTD the DAVIS SHIP station book extraction is used for getting the header information of all CTD stations/casts of the cruise. ManageCTD Utilities→Find Profile function compares station times of the header with the entries in the station book to find out the correct naming of the stations and casts. In CTDheader in ManageCTD the header information of each CTD station/cast is displayed, controlled and corrected if necessary.
CTDdespike in ManageCTD is used for a visual check of the data and to erase/interpolate spikes in the data if necessary. Additionally, a sensor pair (Temp1/Sal1 or Temp2/Sal2) is chosen for each station/cast of the RV Heincke cruise inCTDdespike.
ManageCTD Utilities→CheckDoubleSensors controls the quality of temperature and conductivity sensors. For this purpose outliers of too high sensor pair differences could be removed. The data is then converted to spreadsheet format withdsp2odvfor visualization of the data in Ocean Data View (ODV). The second visual inspection of the CTD data allows a comparison with data from other CTD casts from close-by stations to verify the oxygen sensor data. Therefore, potential reference cruise data is downloaded from PANGAEA (http://www.PANGAEA.de). The reference data is converted to *.mat format. In the ManageCTD Final Processing the CTD data is displayed together with the reference data. Bad data points, sensors or casts are interpolated or erased from the data set and filters are applied if necessary. The processed CTD data are written to text files and imported to PANGAEA (http://www.PANGAEA.de) for publication.
Figure 1: CTD data Processing Workflow
3 Cruise details
Vessel name RV Heincke Cruise name HE570
Cruise start 01.03.2021 Bremerhaven Cruise end 18.03.2021 Bremerhaven Cruise duration 18 days
No. of CTD casts 42
4 Sensor Layout
This chapter describes the CTD sensors mounted during this cruise:
SBE 911plus CTD (SN: 1015), SBE Instrument Configuration Version 7.23.0.1.
ID Sensor Name Serial No. Calibration Date
55 TemperatureSensor 1373 11-Oct-19
3 ConductivitySensor 1198 17-Sep-19
45 PressureSensor 1015 26-Jan-17
55 TemperatureSensor 2929 13-Sep-19
3 ConductivitySensor 1199 17-Sep-19
0 AltimeterSensor 46466 23-Mar-09
71 WET_LabsCStar 1348DR 28-Jan-2016
20 FluoroWetlabECO_AFL_FL_Sensor 1365 15-Jan-2016
38 OxygenSensor 2292 26-Aug-20
38 OxygenSensor 3654 13-Feb-20
5 Processing
Details of processing procedures and processing parameters are described inCTD Processing Log- book of RV Heincke(hdl: 10013/epic.47427).
Density Inversions and Manual Validation
Obvious outliers were removed manually. For the visual check density inversions > 0.005kg/m3and
> 0.01kg/m3 were flagged differently for display but not removed automatically. Decisions whether the flagged values were manually removed or not are based on the description inCTD Processing Logbook of RV Heincke(hdl:10013/epic.47427).
Sensor Differences
6 Results
A complete processing overview for each sensor at each station is summarized in the table in the Appendix (Figure 3).
Double Sensor Check
In Figure 2, the absolute residuals between the sensorpairs are shown for the measured param- etersTemperature and Conductivity, the derived parameter Salinity and the measured parameter Oxygen. Measurements in shallow water depths < 15 m (blue crosses) and gradients between two datapoints exceeding a defined threshold (red crosses) were omitted for accuracy calculation.
Parameter Accuracy Measurements
removed
Remaining measurements given by manufacturer Surface 0-15m within accuracy
+ gradient filter specifications
Temperature ±0.001◦C 11.74% 93.16%
Conductivity ±0.003mS/cm 7.30% 96.70%
Salinity ±0.0015P SU 4.74% 91.83%
Oxygen ±2.0 %of saturation 4.93% 41.08%
Comments
• 37 CTD "max depth/on ground" entries in DShip station book
• 4 CTD "in the water" entries in DShip station book without comment "max depth/ on ground"
(HE570_043-1, HE570_107-1, HE570_142-1, HE570_187-1)
• 41 CTD raw data sets delivered
• 1 CTD cast was invalid or test (HE570_004, HE570_004b)
• 1 CTD station book entry (HE570_118-1) has no corresponding CTD cast
• 39 CTD casts processed and uploaded
• of these 39 processed CTD casts:
– 0 oxygen profiles deleted (spiky and not matching to reference casts) – 1747 data points interpolated
– 63 data points erased
Result files
Text File (HE570_phys_oce.tab):
The format is a plain text (tab-delimited values) file.
Column separator Tabulator "\t"
Column 1 Event label
Column 2 Date/Time of event
Column 3 Latitude of event
Column 4 Longitude of event
Column 5 Elevation of event
Column 6 DEPTH, water
Column 7 Pressure, water
Column 8 Temperature, water
Column 9 Conductivity
Column 10 Salinity
Column 11 Temperature, water, potential Column 12 Density, sigma-theta (0)
Column 13 Oxygen
Column 14 Oxygen, saturation
Column 15 Attenuation, optical beam transmission
Column 16 Fluorometer
Column 17 Number of observations
Processing Report (CTD-HE570-report.pdf):
This PDF document.