General processing report of continuous thermosalinograph oceanography
from RV POLARSTERN cruises: PS116, PS117, PS118, PS119, PS120 (11.11.2018 - 29.06.2019)
Contents
1 Introduction 1
2 Workflow 1
3 Sensor Details 2
4 Campaign Details 3
5 Processing results 3
6 Appendix 12
Contact:
Gerd Rohardt
Alfred-Wegener-Institute
Am Handelshafen 12, D-27570 Bremerhaven, GERMANY Mail: info@awi.de
Processing Agency:
FIELAX
Gesellschaft für wissenschaftliche Datenverarbeitung mbH Schleusenstr. 14, D-27568 Bremerhaven, GERMANY Tel: +49 (0) 471 30015 0
Fax: +49 (0) 471 30015 22 Mail: info@fielax.de
1 Introduction
This report describes the processing of raw data acquired by the thermosalinographs on board RV Polarstern during the expeditions PS116, PS117, PS118, PS119, PS120 to receive cleaned up and corrected salinity data.
2 Workflow
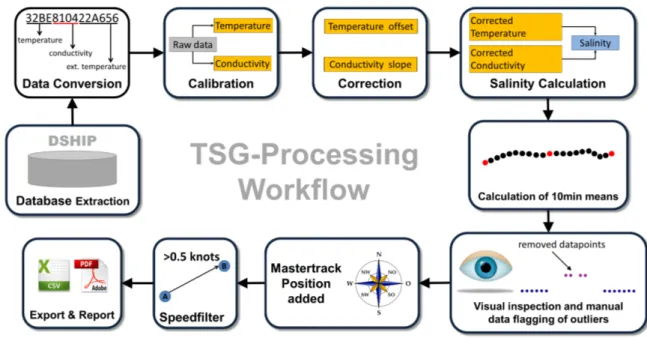
The different steps of processing are visualized in Figure 1. Two thermosalinographs (SBE21, Sea- Bird GmbH) are installed in the same tank in the keel of RV Polarstern for simultaneous measure- ments of temperature and conductivity. Both sensors are equipped with an internal and an exter- nal temperature sensor (SBE38, Sea-Bird GmbH). The external temperature sensors are installed close to the sea water inlet. After the cruise, the measured conductivity and temperature data of both sensors are extracted in hexadecimal form as 1 sec values from the DAVIS SHIP database (https://dship.awi.de). Data of every cruise are processed separately. First, the hexadecimal sen- tences are converted to raw data according to the instruction given by the manufacturer and time shifts between the sensors of max. 1sec are aligned. Afterwards the raw data are converted to temperature and conductivity values using the calibration coefficients from the calibration before de- ployment. However, data can only be finally processed after replacement and renewed calibration because correction values for the sensor drift can only be obtained by the post cruise calibration.
The sensor drift is treated as a linear function during deployment and correction factors are calcu- lated and applied for every day of deployment. See chapter 5 for further details on conductivity slope and temperature offset corrections. From the obtained internal temperature and conductivity data the salinity can be calculated according to the instructions from the Practical Salinity Scale PSS-78.
Afterwards 10-min-means are calculated with outliers outside a 2-times standard deviation range being removed from the calculations of the 10-min-means. Statistics about the differences between both sensors are calculated and referred to in this report. The 10-min-means are visually inspected and - if necessary - manually despiked. Finally, the positions from the corrected mastertracks are assigned as spot-positions for the corresponding times. A speed filter of 0.5 knots minimum speed is applied to avoid redundant data.
Measurements of salinity with an OPTIMARE Precision Salinomter conducted during the cruises are represented for comparison in the Appendix of this report. Drift corrections using bottle samples were not attempted.
Both sensors are processed together and treated as equal. If there are no further objections, data from the sensor with the slope correction closer to 1.0 are prepared for the upload in PANGAEA.
Also see the single detailled processing reports for each cruise.
Figure 1: Workflow of Salinity data processing
3 Sensor Details
TSG1 TSG2
Serial number SBE21-3203 SBE21-3271
Installation 2018-10-16 2018-10-16
Deinstallation 2019-06-28 2019-06-28
Days installed 255 255
External temperature sensor SBE38-110 SBE38-119
Calibration before installation 2018-07-12 2017-11-15
Calibration after installation 2019-07-09 2019-07-09
Temperature offset -0.00362 -0.00116
Conductivity slope 1.0004949 1.0000546
4 Campaign Details
Data of following cruises were processed with the above mentioned sensors and calibration data.
(Data extracted fromhttps://www.pangaea.de/expedition)
Campaign Start Stop From To Days
PS116 2018-11-11 2018-12-11 Bremerhaven Cape Town 30 PS117 2018-12-15 2019-02-07 Cape Town Punta Arenas 54 PS118 2019-02-09 2019-04-10 Punta Arenas Punta Arenas 60 PS119 2019-04-13 2019-05-31 Punta Arenas Port Stanley 48 PS120 2019-06-02 2019-06-29 Port Stanley Bremerhaven 27
Following table shows the data details of the cruises considered in this report. The number of TSG1 and TSG2 messages is the number of data downloaded from DSHIP for the individual cruises.
The number of result messages is the number of data remaining after calculation of 10min means, manual flagging and speed flagging.
Campaign first message last message TSG1
messages
TSG2 messages
Result messages PS116 2018-11-12T15:36:47 2018-12-10T06:28:58 736569 736749 3295 PS117 2018-12-16T07:56:30 2019-02-03T19:24:35 1045891 1046029 4787 PS118 2019-02-09T04:00:02 2019-04-05T15:03:11 861937 862027 3203 PS119 2019-04-17T22:55:30 2019-05-29T21:08:32 897843 897844 4243 PS120 2019-06-03T11:27:32 2019-06-28T12:39:59 531332 531329 3341
5 Processing results
Correction for conductivity and temperature drift
Correction for conductivity and temperature drift of the sensors was accomplished following the instructions by SEA-BIRD Application Note 31 (Revision June 2016). Conductivity slope and tem- perature offset values were calculated for each day of deployment of the TSG1 and TSG2 sensors using following equations.
Correction of conductivity data: islope = 1.0 + (b / n) [(1 / postslope) - 1.0]
b = number of days between begin of deployment and day of measurement n = number of days between deployment and deinstallation
postslope = slope from post-cruise calibration sheet
corrected conductivity = islope * computed conductivity Correction of temperature data: offset = b * (residual / n)
b = number of days between begin of deployment and day of measurement n = number of days between deployment and deinstallation
residual = residual from post-cruise calibration sheet
corrected temperature = offset + computed temperature
Data for the correction values are given in the following two table for TSG1 and TSG2 respectively.
The deployed days columns indicate the number of the first and the last day of each cruise within the deployment interval of TSG1 (255 days) and TSG2 (255 days). The start and stop values in the columns conductivity slope and temperature offset show the correction values for the first and last day of the cruise.
TSG1 deployed days Conductivity slope Temperature offset
Cruise first last start stop start stop
PS116 27 55 0.99994762 0.99989331 -0.00038329 -0.00078078 PS117 61 110 0.99988167 0.99978662 -0.00086596 -0.00156157 PS118 116 171 0.99977498 0.99966829 -0.00164675 -0.00242753 PS119 183 225 0.99964501 0.99956354 -0.00259788 -0.00319412 PS120 230 255 0.99955384 0.99950534 -0.00326510 -0.00362000
TSG2 deployed days Conductivity slope Temperature offset
Cruise first last start stop start stop
PS116 27 55 0.99999422 0.99998822 -0.00012282 -0.00025020 PS117 61 110 0.99998694 0.99997645 -0.00027749 -0.00050039 PS118 116 171 0.99997516 0.99996339 -0.00052769 -0.00077788 PS119 183 225 0.99996082 0.99995183 -0.00083247 -0.00102353 PS120 230 255 0.99995076 0.99994540 -0.00104627 -0.00116000
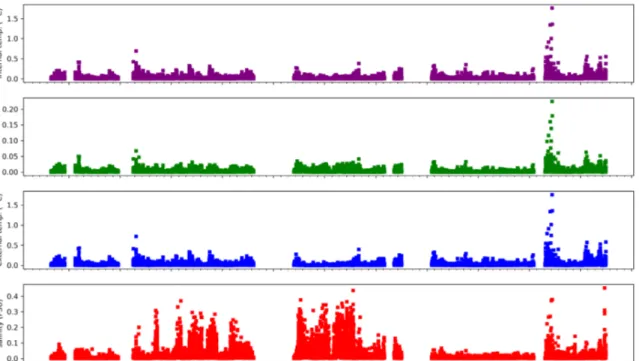
Measured data
Data from the time range considered are show in Figures 2 and 4. Salinometer measurements of bottle samples are depicted in the plots of the salinity of TSG1 and TSG2 (also see Appendix:
Measurements of salinity with the OPTIMARE salinometer). Also given are plots of the standard deviations of the 10min means for every parameter (Figures 3 and 5).
Figure 2: 10min means of data from TSG1
Figure 3: Standard deviations of 10min means of data from TSG1
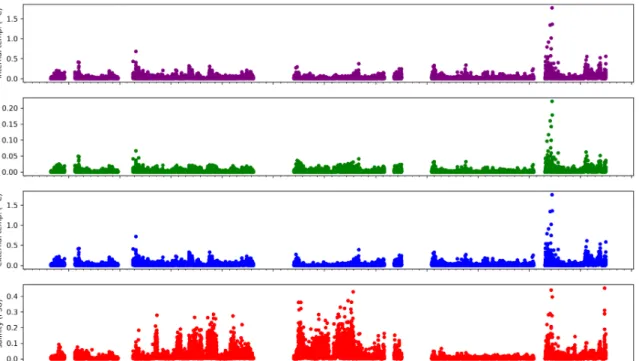
Figure 4: 10min means of data from TSG2
Figure 5: Standard deviations of 10min means of data from TSG2
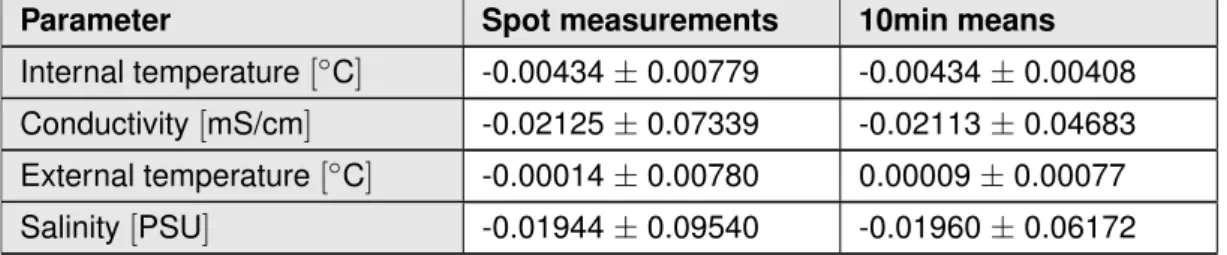
Differences between TSG1 and TSG2
Differences between the two thermosalinographs are show in Figure 6. Only data within 2-times standard deviation are depicted. For the comparison of the spot values only data with a maximum time difference of 1sec between TSG1 und TSG2 are considered.
Parameter Spot measurements 10min means
Internal temperature[◦C] -0.00434±0.00779 -0.00434±0.00408 Conductivity[mS/cm] -0.02125±0.07339 -0.02113±0.04683 External temperature[◦C] -0.00014±0.00780 0.00009±0.00077 Salinity[PSU] -0.01944±0.09540 -0.01960±0.06172
Figure 6: Differences between 10min means TSG1 - TSG2
Post calibration values show a greater temperature offset (-0.00362) and greater slope correction values (1.0004949) for TSG1 compared to TSG2 (-0.00116 and 1.0000546).Therefore the TSG2 (SBE21-3271) data of the cruises dealed with in this report are uploaded to PANGAEA.
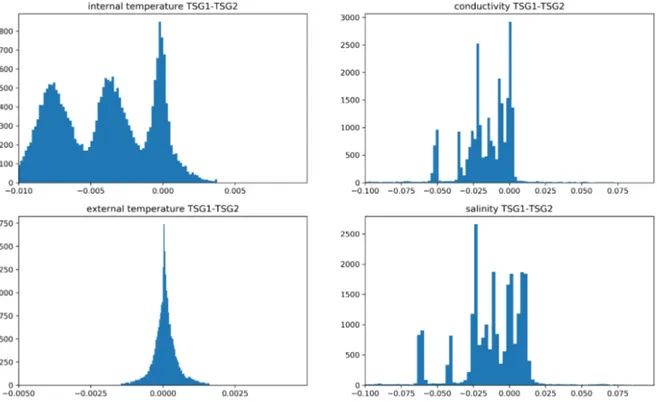
The histograms for the differences between TSG1 and TSG2 shown in Figure 7 show some strange effects for the comparison of the internal temperatures of TSG1 and TSG2. Three major groups can be distinguished in the histogram. Cruises PS117 and PS118 took place in very cold regions with water temperatures below -1◦C. During these cruises the differences between TSG1 and TSG2 in- ternal temperatures range between -0.005 and -0.01◦C causing one of the maxima in the histogram.
The second maxima around -0.003◦C correlates with water temperatures below 5◦C. Smallest dif-
ferences of -0.001 till +0.001◦C are found together with water temperatures greater than 15◦C. This behaviour may be explained by calibration data of the TSG which are calibrated only in the tempera- ture range between +1 and +32◦C. Although measurement range is given with -5 till +35◦C the cold water cruises approximate the lower limit of the measurement range where small deviations from the ideal behaviour seem likely. Additionally, the accuracy of the sensor is given with 0.01◦C and even the higher differences are well within the accuracy range. Furthermore, occasional pollution and blocking of the filter system by biological material as well as malfunction of the system pump may have disturbed flow conditions in the TSG tank causing temperature inhomogeneities in the tank.
The system pump was exchanges after PS118 at the beginning of April resulting in less scatter dur- ing the following cruises (Figure 6). Also, especially cruises PS117 and PS118 took place in areas with possible sea ice conditions probably causing some of the scatter in the conductivity values.
Figure 7: Histogramm of differences TSG1 - TSG2
Differences between internal and external temperature of TSG1 and TSG2 sensors
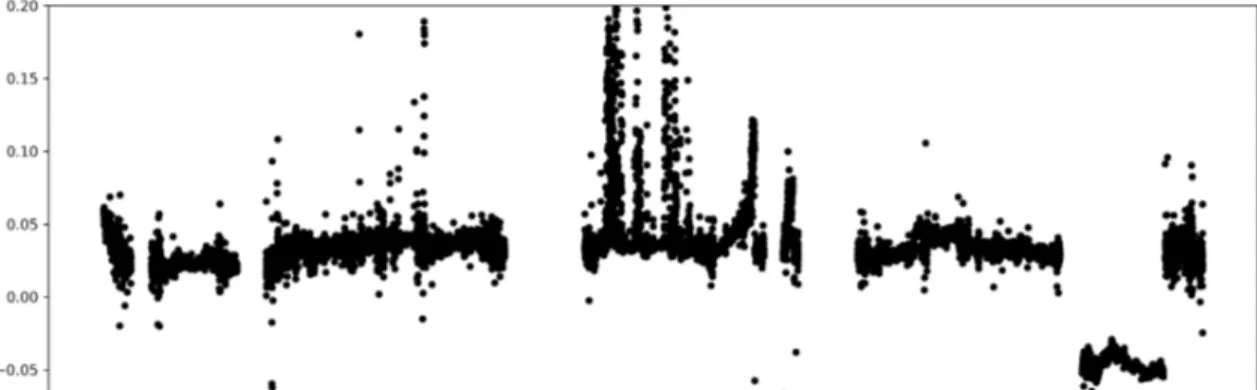
Temperature differences between the internal and the external temperature sensors have to be small under normal circulation conditions. Means and standard deviations for the temperature differences are given in the following table and are shown in Figure 8.
TSG1(mean±std. dev.) TSG2(mean±std. dev.)
Spot values 0.03044±0.06056◦C 0.03438±0.05994◦C 10-min means 0.02868±0.03389◦C 0.03307±0.03665◦C
Some abnormalities are obvious for the first half cruise PS120 between 2019-06-03 and 2019-06-20 where internal temperatures are lower than external temperatures for both TSG systems (Figure 8). This is contradictory to all other cruises considered so far. No further explanations could be obtained by concrete demands among Polarsterns crew. It is only known that after port time in Las Palmas and restart of the system on 2019-06-20 the ratio between internal and external tempera- tures changed back to normal with internal temperatures being higher than external temperatures.
Since the internal temperature is included in the salinity calculations we suggest careful handling of the data of PS120.
Figure 8: Temperature differences between internal and external temperature sensors of 10min means
Result file
Result files are given for each cruise individually. The result file is a plain text (tab-delimited val- ues) file named *Cruise*_surf_oce.tab with one data row in 10-min interval. The water depth in the result file is the depth of the water inlet for the thermosalinographs. Further information about pro- cessing of the data of each cruise can be obtained from following cruise reports: PS116_nav.pdf, PS117_TSG_nav.pdf, PS118_TSG_nav.pdf, PS119_TSG_nav.pdf, PS120_TSG_nav.pdf .
Column separator Tabulator "\t"
Column 1 Date and time expressed according to ISO 8601 Column 2 Latitude in decimal format, unit degree
Column 3 Longitude in decimal format, unit degree
Column 4 Water depth, unit metre
Column 5 Temperature, unit degree Celsius
Column 6 Salinity PSU
6 Appendix
Measurements of salinity with the OPTIMARE salinometer
Bottle samples of sea water were continously taken during the cruises. Those samples were mea- sured with the Optimare Salinometer onboard after temperature equalization. The bottle data are given here for reference. Drift correction using the bottle data was not applied.
Time of sampling OPS Salinity [PSU]
2018-11-24T14:51:00 36.4602 2018-11-27T08:54:00 34.7333 2018-11-28T16:31:00 35.6079 2018-11-29T08:35:00 35.6234 2018-12-03T08:12:00 36.6935 2018-12-04T08:53:00 36.2524 2018-12-08T06:48:30 35.2769 2018-12-30T15:14:05 33.9439 2019-01-03T08:49:00 33.3955 2019-01-04T14:07:30 34.0319 2019-01-21T09:29:00 34.0602 2019-01-29T09:41:00 33.3754 2019-01-31T15:29:30 33.3652 2019-02-01T14:29:00 33.9454 2019-02-21T11:40:30 34.1867 2019-02-21T11:42:00 34.1839 2019-02-24T11:23:00 33.1050 2019-02-28T12:58:00 33.6229 2019-03-12T19:50:00 33.7709 2019-03-23T18:56:30 33.4842 2019-03-27T19:07:00 33.8635 2019-04-03T19:34:30 33.5033 2019-04-04T11:25:00 33.7783 2019-04-05T14:37:00 33.8922 2019-04-05T14:40:30 33.8795 2019-04-18T12:33:00 34.0644 2019-04-26T12:09:00 33.9336 2019-05-03T15:57:00 33.9112 2019-05-06T16:05:00 33.9607 2019-05-13T13:16:00 33.9130 2019-05-21T10:36:00 34.0281 2019-05-26T11:08:00 34.0994 2019-05-29T17:28:00 34.0664 2019-06-05T13:41:00 34.5421 2019-06-07T15:03:00 36.0793