General processing report of continuous thermosalinograph oceanography
from RV POLARSTERN cruises: PS121, PS122_1, PS122_2, PS122_3, PS122_4, PS122_5
(10.08.2019 - 12.10.2020)
Contents
1 Introduction 1
2 Workflow 1
3 Sensor Details 2
4 Campaign Details 3
5 Processing results 3
6 Appendix 11
Contact:
Gerd Rohardt
Alfred-Wegener-Institute
Am Handelshafen 12, D-27570 Bremerhaven, GERMANY Mail: info@awi.de
Processing Agency:
FIELAX
Gesellschaft für wissenschaftliche Datenverarbeitung mbH Schleusenstr. 14, D-27568 Bremerhaven, GERMANY Tel: +49 (0) 471 30015 0
Fax: +49 (0) 471 30015 22 Mail: info@fielax.de
Ref.: TSG_Data_PS121, PS122_1, PS122_2, PS122_3, PS122_4, PS122_5 .pdf
Vers.: 1 Date: 2021/05/06 Status: final
1 Introduction
This report describes the processing of raw data acquired by the thermosalinographs on board RV Polarstern during the expeditions PS121, PS122_1, PS122_2, PS122_3, PS122_4, PS122_5 to receive cleaned up and corrected salinity data.
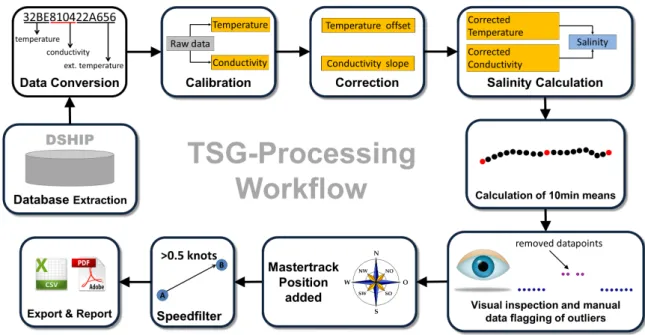
2 Workflow
The different steps of processing are visualized in Figure 1. Two thermosalinographs (SBE21, Sea- Bird GmbH) are installed in the same tank in the keel of RV Polarstern for simultaneous measure- ments of temperature and conductivity. Both sensors are equipped with an internal and an exter- nal temperature sensor (SBE38, Sea-Bird GmbH). The external temperature sensors are installed close to the sea water inlet. After the cruise, the measured conductivity and temperature data of both sensors are extracted in hexadecimal form as 1 sec values from the DAVIS SHIP database (https://dship.awi.de). Data of every cruise are processed separately. First, the hexadecimal sen- tences are converted to raw data according to the instruction given by the manufacturer and time shifts between the sensors of max. 1sec are aligned. Afterwards the raw data are converted to temperature and conductivity values using the calibration coefficients from the calibration before de- ployment. However, data can only be finally processed after replacement and renewed calibration because correction values for the sensor drift can only be obtained by the post cruise calibration.
The sensor drift is treated as a linear function during deployment and correction factors are calcu- lated and applied for every day of deployment. See chapter 5 for further details on conductivity slope and temperature offset corrections. From the obtained internal temperature and conductivity data the salinity can be calculated according to the instructions from the Practical Salinity Scale PSS-78.
A pressure of 11dbar representing the 11m water depth of the water inlet of the TSG system on R.V.
Polarstern is applied for the salinity calculations.
Afterwards 10-min-means are calculated with outliers outside a 2-times standard deviation range being removed from the calculations of the 10-min-means. Statistics about the differences between both sensors are calculated and referred to in this report. The 10-min-means are visually inspected and - if necessary - manually despiked. Finally, the positions from the corrected mastertracks are assigned as spot-positions for the corresponding times. A speed filter of 0.5 knots minimum speed is applied to the data of PS121 in order to avoid redundant data. The speed filter was NOT applied to the different legs of PS122 because of the slow drifting speeds during these expeditions which would have resulted in almost complete deletion of the data by the speed filter.
Measurements of salinity with an OPTIMARE Precision Salinomter conducted during the cruises are represented for comparison in the Appendix of this report. Drift corrections using bottle samples were not attempted.
Both sensors are processed together and treated as equal. If there are no further objections, data from the sensor with the slope correction closer to 1.0 are prepared for the upload in PANGAEA.
Also see the single detailled processing reports for each cruise.
Figure 1: Workflow of Salinity data processing
3 Sensor Details
TSG1 TSG2
Serial number SBE21-3189 SBE21-3354
Installation 2019-06-28 2019-06-28
Deinstallation 2020-10-30 2020-10-30
Days installed 490 490
External temperature sensor SBE38-0136 SBE38-0154
Calibration before installation 2018-10-31 2018-07-12
Calibration after installation 2021-02-09 2021-02-09
Temperature offset -0.0010 0.000800
Conductivity slope 0.9997775 0.9996833
4 Campaign Details
Data of following cruises were processed with the above mentioned sensors and calibration data.
(Data extracted fromhttps://www.pangaea.de/expedition)
Campaign Start Stop From To Days
PS121 2019-08-10 2019-09-13 Bremerhaven Tromsoe 34
PS122_1 2019-09-20 2019-12-13 Tromsoe Arctic Ocean 84
PS122_2 2019-12-13 2020-02-24 Arctic Ocean Arctic Ocean 73 PS122_3 2020-02-24 2020-06-04 Arctic Ocean Longyearbyen 101 PS122_4 2020-06-04 2020-08-12 Longyearbyen North Greenland Sea 69 PS122_5 2020-08-12 2020-10-12 North Greenland Sea Bremerhaven 61
Following table shows the data details of the cruises considered in this report. The number of TSG1 and TSG2 messages is the number of data downloaded from DSHIP for the individual cruises.
The number of result messages is the number of data remaining after calculation of 10min means, manual flagging and speed flagging.
Campaign first message last message TSG1
messages
TSG2 messages
Result messages PS121 2019-08-11T07:31:31 2019-09-13T06:01:43 710531 710286 2992 PS122_1 2019-09-27T02:51:46 2019-12-13T09:09:58 1664702 1664698 11099 PS122_2 2019-12-13T09:04:02 2020-02-24T08:59:58 1576674 1576673 10511 PS122_3 2020-02-24T09:00:02 2020-06-03T13:58:15 2164132 2164131 14426 PS122_4 2020-06-08T20:32:31 2020-08-12T09:59:56 1394514 1394514 9296 PS122_5 2020-08-12T10:00:04 2020-10-11T06:10:25 1290043 1290045 8599
5 Processing results
Correction for conductivity and temperature drift
Correction for conductivity and temperature drift of the sensors was accomplished following the instructions by SEA-BIRD Application Note 31 (Revision June 2016). Conductivity slope and tem- perature offset values were calculated for each day of deployment of the TSG1 and TSG2 sensors using following equations.
Correction of conductivity data: islope = 1.0 + (b / n) [(1 / postslope) - 1.0]
b = number of days between begin of deployment and day of measurement n = number of days between deployment and deinstallation
postslope = slope from post-cruise calibration sheet
corrected conductivity = islope * computed conductivity
Correction of temperature data: offset = b * (residual / n)
b = number of days between begin of deployment and day of measurement n = number of days between deployment and deinstallation
residual = residual from post-cruise calibration sheet
corrected temperature = offset + computed temperature
Data for the correction values are given in the following two table for TSG1 and TSG2 respectively.
The deployed days columns indicate the number of the first and the last day of each cruise within the deployment interval of TSG1 (490 days) and TSG2 (490 days). The start and stop values in the columns conductivity slope and temperature offset show the correction values for the first and last day of the cruise.
TSG1 deployed days Conductivity slope Temperature offset
Cruise first last start stop start stop
PS121 44 77 1.00001998 1.00003497 -0.00008980 -0.00015714 PS122_1 91 168 1.00004133 1.00007630 -0.00018571 -0.00034286 PS122_2 168 241 1.00007630 1.00010946 -0.00034286 -0.00049184 PS122_3 241 341 1.00010946 1.00015488 -0.00049184 -0.00069592 PS122_4 346 411 1.00015715 1.00018667 -0.00070612 -0.00083878 PS122_5 411 471 1.00018667 1.00021392 -0.00083878 -0.00096122
TSG2 deployed days Conductivity slope Temperature offset
Cruise first last start stop start stop
PS121 44 77 1.00002845 1.00004978 0.00007184 0.00012571 PS122_1 91 168 1.00005883 1.00010862 0.00014857 0.00027429 PS122_2 168 241 1.00010862 1.00015581 0.00027429 0.00039347 PS122_3 241 341 1.00015581 1.00022047 0.00039347 0.00055673 PS122_4 346 411 1.00022370 1.00026572 0.00056490 0.00067102 PS122_5 411 471 1.00026572 1.00030452 0.00067102 0.00076898
Measured data
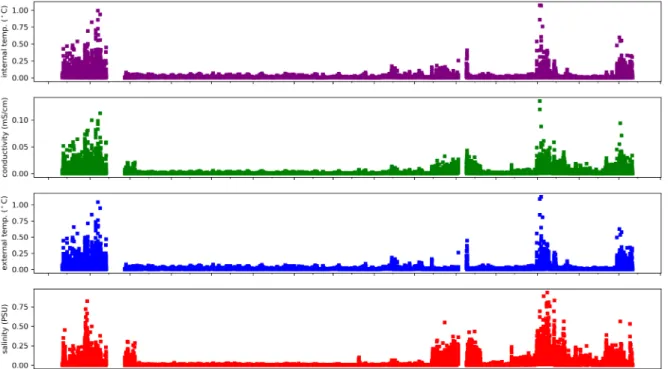
Data from the time range considered are show in Figures 2 and 4. Salinometer measurements of bottle samples are depicted in the plots of the salinity of TSG1 and TSG2 (also see Appendix:
Measurements of salinity with the OPTIMARE salinometer). Also given are plots of the standard deviations of the 10min means for every parameter (Figures 3 and 5).
Figure 2: 10min means of data from TSG1
Figure 3: Standard deviations of 10min means of data from TSG1
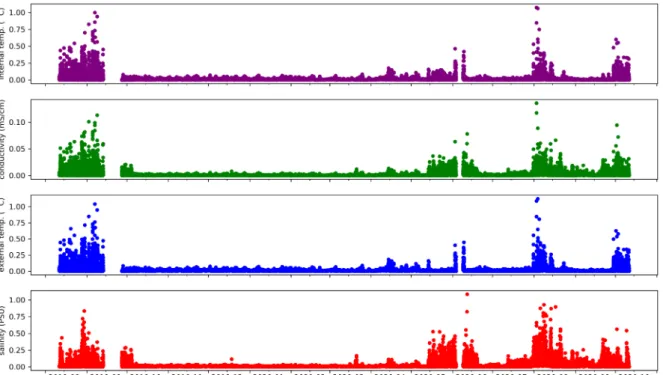
Figure 4: 10min means of data from TSG2
Figure 5: Standard deviations of 10min means of data from TSG2
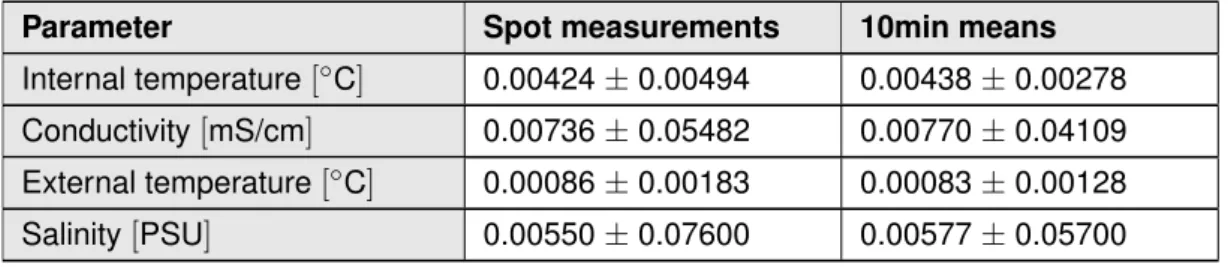
Differences between TSG1 and TSG2
Differences between the two thermosalinographs are show in Figure 6. Only data within 2-times standard deviation are depicted. For the comparison of the spot values only data with a max- imum time difference of 1sec between TSG1 und TSG2 are considered. During the slow drift of PS122_1, PS122_2 and PS122_3 the differences of the internal temperatures between TSG1 and TSG2 shows less deviation but higher values compared to the conditions during PS122_4 and PS122_5 with less ice coverage, faster drifts and cruise segments with normal cruise speeds.
Parameter Spot measurements 10min means
Internal temperature[◦C] 0.00424±0.00494 0.00438±0.00278 Conductivity[mS/cm] 0.00736±0.05482 0.00770±0.04109 External temperature[◦C] 0.00086±0.00183 0.00083±0.00128 Salinity[PSU] 0.00550±0.07600 0.00577±0.05700
Figure 6: Differences between 10min means TSG1 - TSG2
Post calibration values show a slightly greater temperature offset (-0.0010) but a slope correction value closer to 1 (0.9997775) for TSG1 compared to TSG2 (0.000800 and 0.9996833). Without further quality criteria the decision was to upload the TSG1 (SBE21-3189) data to PANGAEA.
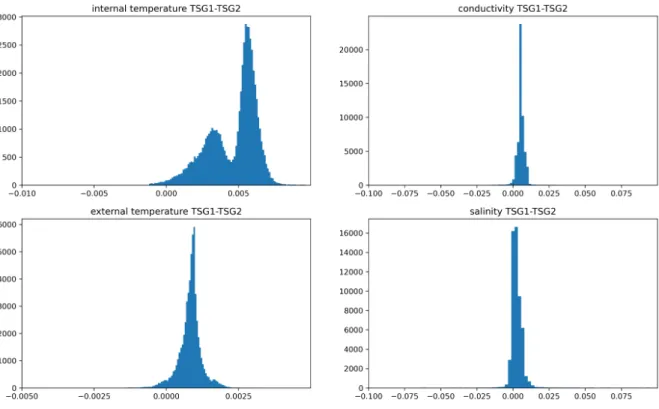
The histograms for the differences between TSG1 and TSG2 shown in Figure 7 show a bimodal behaviour for the comparison of the internal temperatures of TSG1 and TSG2. Two major groups can be distinguished in the histogram. Cruises PS122_1, PS122_2 and PS122_3 took place in
very cold regions with water temperatures around -1.7◦C with complete ice coverage and very slow drift. During these cruises the differences between TSG1 and TSG2 internal temperatures range around 0.006◦C causing one of the maxima in the histogram. The second maxima around 0.004◦C correlates with the cruises PS121, PS122_4 and PS122_5 with higher water temperatures and nor- mal cruise speed during PS121 and the transitions between the PS122 legs as well as higher drift speeds during PS122_4 and PS122_5. Please consider, that some of this behaviour may be ex- plained by calibration data of the TSG which are calibrated only in the temperature range between +1 and +32◦C. Although measurement range is given with -5 till +35◦C the cold water cruises ap- proximate the lower limit of the measurement range where small deviations from the ideal behaviour seem likely. Additionally, the accuracy of the sensor is given with 0.01◦C and even the higher differ- ences are well within the accuracy range.
Figure 7: Histogramm of differences TSG1 - TSG2
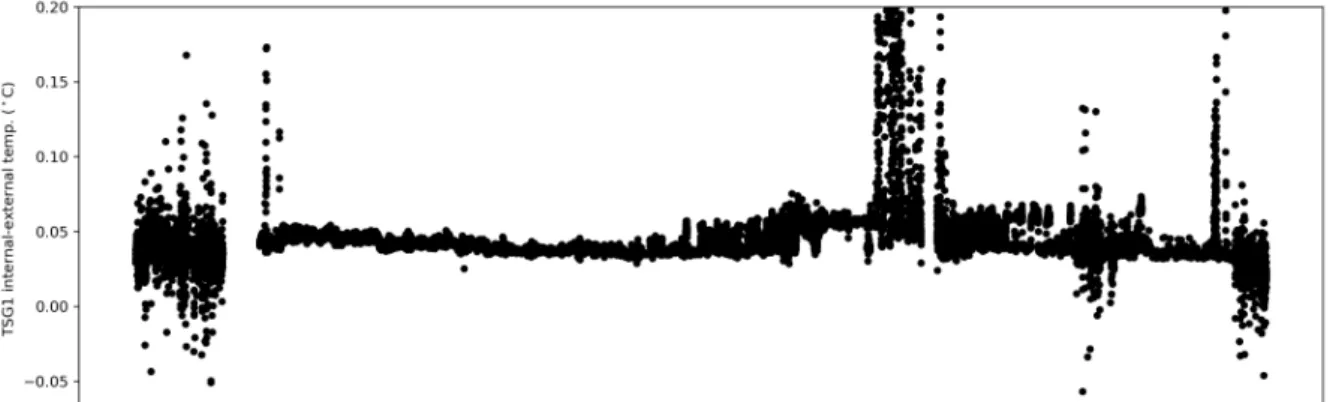
Differences between internal and external temperature of TSG1 and TSG2 sensors
Temperature differences between the internal and the external temperature sensors have to be small under normal circulation conditions. Means and standard deviations for the temperature differences are given in the following table and are shown in Figure 8. Higher scatter obvious in Figure 8 is connected to higher cruise speeds during PS121 as well as on the transits between the PS122 legs PS122_3, PS122_4 and PS122_5.
TSG1(mean±std. dev.) TSG2(mean±std. dev.)
Spot values 0.04493±0.03555◦C 0.04144±0.03578◦C 10-min means 0.04507±0.03293◦C 0.04152±0.03352◦C
Figure 8: Temperature differences between internal and external temperature sensors of 10min means
Result files
Result files are provided for each cruise. These files are plain text (tab-delimited values) file named
*Cruise*_surf_oce.tab with one data row in 10-min interval. Salinity values are calculated from the 10min means of conductivity and internal temperature data using a pressure of 11 dbar for the cal- culations. The pressure refers to the 11m water depth of the water inlet of the TSG system on R.V.
Polarstern. Water temperature taken from the TSG external temperature sensor is given for refer- ence.
Column separator Tabulator "\t"
Column 1 Date and time expressed according to ISO 8601 Column 2 Latitude in decimal format, unit degree
Column 3 Longitude in decimal format, unit degree Column 4 Water Temperature, unit degree celsius Column 5 TSG Internal Temperature, unit degree celsius
Column 6 Conductivity, unit mS/cm
Column 7 Salinity, PSU
6 Appendix
Measurements of salinity with the OPTIMARE salinometer
Bottle samples of sea water were continously taken during the cruises. Those samples were mea- sured with the Optimare Salinometer onboard after temperature equalization. The bottle data are given here for reference. Drift correction using the bottle data was not applied.
Time of sampling OPS Salinity [PSU]
2019-08-12T08:01:00 33.2231 2019-08-21T07:48:00 34.0872 2019-08-27T12:07:00 34.7738 2019-09-02T07:32:00 30.1975 2019-09-09T07:24:00 34.7210 2019-10-08T00:45:00 32.3910 2019-11-10T02:36:00 32.7210 2019-11-19T02:57:00 32.6168 2019-11-25T04:46:00 32.4351 2019-12-03T05:15:00 32.6228 2019-12-18T07:26:00 32.0093 2019-12-26T06:06:00 31.8594 2020-01-01T08:23:00 31.7793 2020-01-13T07:45:00 31.5695 2020-01-31T06:52:30 31.8020 2020-02-05T06:45:00 31.7627 2020-02-08T07:04:00 31.7682 2020-02-15T06:25:00 32.3798 2020-03-15T07:11:00 33.2289 2020-03-27T12:31:00 33.6759
Time of sampling OPS Salinity [PSU]
2020-04-07T07:02:00 34.2154 2020-04-14T07:18:00 34.2370 2020-05-06T09:21:00 34.3343 2020-05-10T07:01:00 34.3245 2020-06-09T07:36:00 34.9036 2020-06-09T07:40:00 34.9023 2020-06-13T06:35:00 33.9842 2020-06-13T06:39:00 33.9847 2020-06-19T12:23:00 33.9485 2020-07-03T12:19:00 33.7532 2020-07-13T12:13:00 33.4299 2020-08-04T11:13:00 30.5880 2020-08-25T12:11:00 31.5326 2020-08-28T03:31:00 30.5638 2020-08-31T09:16:00 29.1812 2020-09-07T04:30:00 28.8674 2020-09-15T04:06:00 29.3593 2020-09-17T03:53:00 29.2727 2020-09-20T05:53:00 29.2697 2020-09-24T09:51:00 32.7207