...
Modulation of physiological performance by temperature and salinity in the sugar kelp Saccharina latissima
Cátia Monteiro ,1,2,3Huiru Li,1,4Nora Diehl,1Jonas Collén,3Sandra Heinrich,5Kai Bischof1* and Inka Bartsch6
1Marine Botany- BreMarE, FB 02, University of Bremen, Bremen, Germany,2Plateforme ABiMS, Station Biologique de Roscoff, CNRS: FR2424, Sorbonne Université (UPMC), Roscoff, France,3Integrative Biology of Marine Models (LBI2M), Station Biologique de Roscoff, CNRS, Sorbonne Université (UPMC), Roscoff, France,4Fisheries College, Ocean University of China, Qingdao, China,5Institute for Plant Science and Microbiology, University of Hamburg, Hamburg, Germany and
6Alfred-Wegener-Institute, Helmholtz Centre for Marine and Polar Research, Bremerhaven, Germany
...
SUMMARY
The sugar kelpSaccharina latissimaexperiences a wide range of environmental conditions along its geographical and vertical distribution range. Temperature and salinity are two critical drivers influencing growth, photosynthesis and biochemical composition. Moreover, interactive effects might modify the results described for single effects. In shallow water coastal systems, exposure to rising temperatures and low salinity are expected as consequence of global warming, increased precipi- tation and coastal run-off. To understand the acclimation mechanisms of S. latissima to changes in temperature and salinity and their interactions, we performed a mechanistic lab- oratory experiment in which juvenile sporophytes from Brittany, France were exposed to a combination of three temperatures (0, 8 and 15C) and two salinity levels (20 and 30 psu (practi- cal salinity units)). After a temperature acclimation of 7 days, sporophytes were exposed to low salinity (20 psu) for a period of 11 days. Growth, and maximal quantum yield of photosys- tem II (Fv/Fm), pigments, mannitol content and C:N ratio were measured over time. We report for thefirst time inS. latissima afivefold increase in the osmolyte mannitol in response to low temperature (0C) compared to 8 and 15C that may have eco- logical and economic implications. Low temperatures signifi- cantly affected all parameters, mostly in a negative way.
Chlorophylla, the accessory pigment pool, growth andFv/Fm were significantly lower at 0C, while the de-epoxidation state of the xanthophyll cycle was increased at both 0 and 8C com- pared to 15C. Mannitol content and growth decreased with decreased salinity; in contrast, pigment content and Fv/Fm were to a large extent irresponsive to salinity. In comparison to S. latissimaoriginating from an Arctic population, despite some reported differences, this study reveals a remarkably similar impact of temperature and salinity variation, reflecting the large degree of adaptability in this species.
Key words: brown algae, global warming, growth, Laminariales, mannitol, photosynthesis, pigments, seaweed.
...
INTRODUCTION
Kelps (order Laminariales, class Phaeophyceae) are important primary producers and ecosystem engineers in coastal
ecosystems (Dayton 1985; Bartschet al. 2008).Saccharina latissima is a common kelp species in temperate to polar rocky shores in the northern hemisphere. Its distribution in Europe ranges from the Arctic (Spitsbergen, Svalbard) to the north of Portugal (Araújo et al. 2016; Neiva et al. 2018).
Recent reports of local extinction and range shifts (e.g. Moy &
Christie 2012; Araújoet al. 2016) as result of environmental change might compromise the survival of the species and its associated ecosystem functions (Harleyet al. 2012). The bio- chemical composition of seaweeds is modulated by environ- mental factors, such as temperature, salinity, light and nutrients (Stengelet al. 2011). Therefore, several studies pro- vide chemical composition profiles offield-collected kelps by season and geographical location (e.g. Fernandeset al. 2016;
Schmidet al. 2017). However, to elucidate how abiotic fac- tors, singly or in interaction, drive biochemical composition laboratory experiments with cultivated material are necessary to exclude confounding effects. In addition, multifactorial designs allow the exploration of interactive effects in a way that may better allow relation to field conditions than uni- factorial investigations without the associated confounding effects (Davison 1987).
Temperature is a major factor driving distributional ranges both at global and local scale by modulating survival, growth and reproduction of macroalgae (van den Hoek 1982;
Lüning 1990; Limaet al. 2007; Harleyet al. 2012). Temper- ature influences photosynthesis of macroalgae by regulating photosynthetic efficiency and pigment concentrations (Davison 1987; Andersenet al. 2013). Furthermore, salinity variation significantly influences the physiology and biochem- istry of seaweeds which affects growth and survival (e.g. Gordillo et al. 2002; Spurkland & Iken 2011). In Phaeophyceae, besides its role as storage compound, manni- tol also has a function in osmotic adjustment and therefore concentration changes may follow variation in the salinity regime (Iwamoto & Shiraiwa 2005; Gylle et al. 2009).
...
*To whom correspondence should be addressed.
Email:kbischof@uni-bremen.de Communicating Editor: Chikako Nagasato Received 4 June 2020; accepted 1 October 2020.
© 2020 The Authors.
Phycological Researchpublished by John Wiley & Sons Australia, Ltd on behalf of Japanese Society of Phycology.
This is an open access article under the terms of the Creative Commons Attribution License, which permits use, distribution
Subtidal kelps, such asS. latissima, are locally and intermit- tently subjected to hyposalinity driven by precipitation events, tidal ranges and freshwater input that often occur in short- time scales–a few hours to a day. In the case of freshwater input from rivers or glaciers, exposure to low salinity might last longer (for several days) depending on the geomorphology of the site (Lüning 1990; Borum et al. 2002; Mor- tensen 2017). Moreover, S. latissima is known to inhabit brackish waters such as the Baltic Sea (Nielsenet al. 2016) and the intertidal in British Columbia, Canada which grants long-term exposure to hyposalinity (Druehl & Hsiao 1977).
Hence,S. latissimahas been reported to survive salinities of 10 psu (practical salinity units) and to grow above 13 psu (Karsten 2007; Spurkland & Iken 2011). Nevertheless, the interaction of temperature and salinity on macroalgal perfor- mance has been rarely investigated. Understanding acclima- tion strategies to both temperature and salinity changes will support conservation practices and shed light on ecological consequences of local environmental changes.
Additionally, interest in the cultivation of S. latissima in Europe and North America is rising given the emergent food and industrial applications (e.g. Sanderson et al. 2012;
Boderskovet al. 2016; Fernandet al. 2017). Namely, certain kelp pigments, such as carotenoids, and mannitol are relevant for human health (Iwamoto & Shiraiwa 2005; Wellset al. 2017).
S. latissimahas been traditionally harvested and it is recently also commercially cultivated in Brittany, France (Mesnildrey et al. 2012; Bernard et al. 2019). In Roscoff, Brittany, S. latissima is exposed to high tidal coefficients (Gévaert et al. 2003) and low tides might lead to exposure to low salinity during rain and hyperosmotic stress when desiccated (Lüning 1990). Therefore, understanding how chemical profiles ofS. latissimareact to changes in abiotic factors can support site selection for commercial purposes (Haftinget al. 2015).
To investigate acclimation mechanisms to temperature and salinity and their interaction, the physiological and biochemical responses of juvenile sporophytes of the sugar kelpS. latissima to variations in both abiotic factors were investigated under controlled laboratory conditions within 18 days. Thereby, this study further explores the physiological capacity ofS. latissima, which may help to interpret its wide response plasticity along the distributional gradient. Data reported here forS. latissima from Roscoff, Brittany is compared to results from a study with Arctic material from Spitsbergen which took place under the same experimental conditions (Liet al. 2020). Both studies were performed under one common hypothesis: We assumed that material from both locations represent locally adapted eco- types (Kawecki & Ebert 2004), and thereby we expected that our Brittany material would grow and perform better at 15C and saline conditions than the Arctic material. In turn, we expected the Arctic material to perform better at low tempera- ture and low salinity (0C, 20 psu) than algae from Brittany.
MATERIALS AND METHODS
Algal material and experimental design
Young sporophytes of Saccharina latissima (L.) C.E. Lane, C. Mayes, Druehl, et G. W. Saunders were raised from stock
cultures of uniparental male and female gametophytes (AWI culture numbers 3425, 3426 isolated 2013 from Roscoff, 48 430 3900 N, 3 590 13.200 W; Brittany, France) as described by Heinrichet al. (2012). Sporophytes were culti- vated in 5 L glass beakers at 8C under a photonfluence rate of 20μmol photons m−2s−1of photosynthetically active radi- ation (PAR) (Mitras Lightbar Daylight 150, GHL, Germany) in a 18:6 h–light:dark (LD) photoperiod in an environmentally controlled room. Algae were cultivated for 3 months in sterile seawater enriched with Provasoli (Starr & Zeikus 1993; modi- fications: HEPES-buffer instead of TRIS, double concentra- tion of Na2glycerophosphate, iodine enrichment after Tatewaki (1966)) with a salinity of approximately 30 psu until they reached a length of 5–7 cm with an average fresh weight of 0.58 g. At the start of the experiment, sporophytes were directly exposed to the temperatures 0, 8 and 15C for 7 days (n = 5). This was regarded as the temperature acclimation phase. Temperature levels were chosen to include a control temperature (8C) that falls in the middle of the temperature range suitable forS. latissimagrowth (Bolton & Lüning 1982) and a higher (15C) and lower value (0C) that are locally experienced by S. latissima throughout the distributional range (15C in Brittany (SOMLIT 2017) fr/fr/, 0C in the Arctic (COSYNA Data 2017)). After 7 days, sporophytes were directly exposed to a low salinity treatment (20 psu) while the control was kept at the original salinity (30 psu) by each tem- perature for 11 days resulting in a total of 18 experimental days in 5 L beakers with 12 sporophytes each (n = 5) (see Appendix S1 in the Supporting Information for experimental design and physiological and biochemical parameters mea- sured). The Provasoli solution was added to the low-salinity treatment after the latter was prepared by mixing deionized water with seawater. Physiological and biochemical parame- ters were measured infive replicates unless practical limita- tions during experiment and technical analysis reduced this number.
Physiological parameters
During the experimental phase (18 days) fresh weight (n = 3) of spot-labeled sporophytes was measured twice a week by an analytical digital balance Sartorius LA310S (Göttingen, Ger- many) after blotting dry. Biomass increase was calculated as percentage of initial fresh weight (day 0) to account for natu- ral variability among replicates.
Maximal quantum yield of photosystem II (Fv/Fm, n = 5) of a randomly sampled sporophyte was measured twice a week with an Imaging PAM maxi-version (Pulse Amplitude Fluorometer; Walz, Effeltrich, Germany) after 10 min dark acclimation in seawater. Initial values of Fv/Fm (~0.5) were slightly lower than the value considered healthy for brown algae (~0.7) (Dringet al. 1996; Hanelt 1998) most likely due to the use of the Imaging PAM that often records lower values than other PAM instruments (Nielsen & Nielsen 2008).
Biochemical parameters
One sporophyte per replicate and per sampling day (see Appen- dix S1 in the Supporting Information) was randomly sampled for biochemical analyses (pigments, mannitol and carbon to nitrogen ratio (C:N)). Samples were frozen in liquid nitrogen,
stored at−80C and then lyophilized with a freeze-dryer alpha 1–4 LD plus (Martin Christ Gefriertrocknungsanlagen GmbH, Germany) for 24 h at 1 mbar and−55C.
Mannitol content was measured on days 8, 11 and 18 (n = 3). For the extraction, lyophilized and homogenized three aliquots of 8–10 mg sample were incubated with 1 mL aque- ous ethanol (70%, v/v) for 3–4 h in a water bath at 70C. The mannitol concentration was determined after Diehl et al. (2020), using the method described in Karsten et al. (1991a). D(−)-mannitol standards (C6H14O6, Roth) of 1, 6 and 10 mM were used for calibration. Mannitol content was calculated in mg g−1dry weight (DW).
C:N ratios were analyzed on samples taken on days 8, 11 and 18 (n = 4) following Graiff et al. (2015). 2–3 mg of lyophilized and ground samples were weighed and packed into tin cartridges (6×6×12 mm) and combusted at 950C.
The content of C and N were quantified automatically in an elemental analyzer (Vario EL III, Elementar, Langenselbold, Germany). The standard used was acetanilide (C8H9NO). Total C and total N content were calculated in mg g−1dry weight (DW). The C:N ratios were calculated based on these results.
Pigment content was determined on samples taken on days 8 and 18 (n = 5) using a high performance liquid chro- matography (HPLC) following the protocol by Koch et al. (2016), with minor changes– no guard cartridge was used here and the samples were filtered through a 0.2 μm filter. The accessory pigment pool (Acc.) was calculated by adding chlorophyll c2 and fucoxanthin. The xanthophyll cycle pigment pool (VAZ) is the sum of the pigments violaxanthin (V), antheraxanthin (A) and zeaxanthin (Z). The de-epoxidation state (DPS) was calculated based on the for- mula DPS=ðVZ+ 0+A:+5AZÞ as described in Colombo-Pallotta et al. (2006).
Statistical analysis
We performed a Grubb’s test to detect outliers (Grubbs 1969) through the webpage GraphPad (https://www.graphpad.com/
quickcalcs/grubbs1/;P< 0.05). For subsequent analysis one outlier found in the values of VAZ and another one in the DPS values were excluded. Statistical analyses were performed with the software IBM SPSS statistics version 25. The normal- ity assumption was tested with the Shapiro–Wilk test and the homogeneity of variances assumption with the Levene’s test (P> 0.05). A repeated measures ANOVA was applied to fresh weight with between-subjects factors temperature and salinity and within-subjects factor time. To test the effect of tempera- ture on Fv/Fm during the temperature acclimation phase, a non-parametric test was applied to day 4 and a one-way ANOVA to day 7. When data complied with the assumptions, separate two-way ANOVAs with temperature and salinity as fixed factors were applied to pigment content on days 8 and 18, toFv/Fmon days 8, 11, 14 and 18, to mannitol and C:N ratio on days 8, 11 and 18. When data failed to comply with the normality and homogeneity of variances assumptions, non-parametric tests were applied – independent samples Kruskal–Wallis test for the effect of temperature and Mann– WhitneyUtest for the effect of salinity. Following the statisti- cal tests above, Post-Hoc multiple comparisons per factor
were performed with Bonferroni corrections to identify the sig- nificant differences among treatments.
RESULTS
Physiological parameters
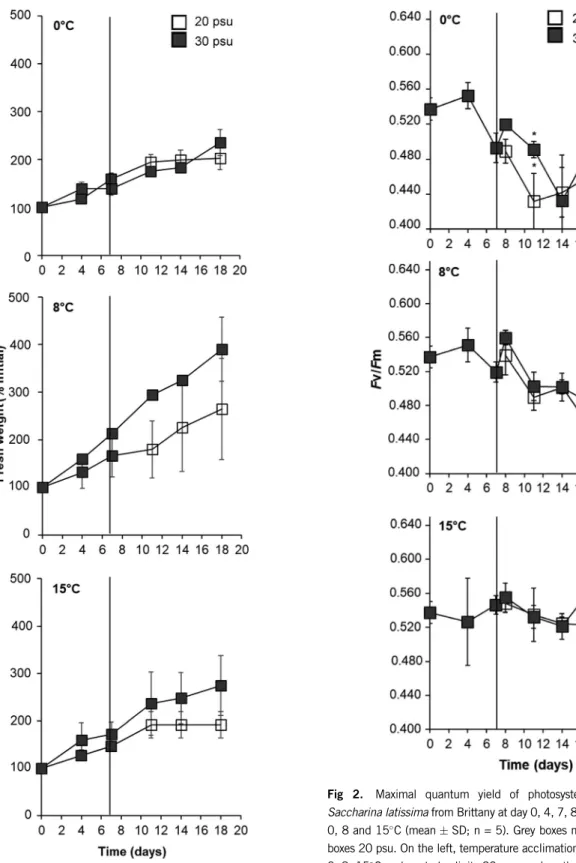
Fresh weight was significantly affected by the interaction of time and temperature and by the main effect of time. After 7 days of temperature acclimation, fresh weight (as percentage of initial) was 27% higher at 8C than at 0C (non-significant after Bonferroni adjustment for multiple comparisons,P= 0.062) but not different from 15C. Fresh weight was overall 19% significantly higher on day 7 than on day 4 (Fig. 1, Appendix S2 – Table 1 in the Supporting Information).
During the subsequent salinity×temperature treatment, there was a significant interaction between time and tempera- ture, between time and salinity but not between temperature and salinity on fresh weight. Main effects of temperature and salinity were significant (Appendix S2 – Table 2 in the Supporting Information). Overall fresh weight was significantly higher at 30 psu than at 20 psu on days 11 (24%) and 18 (36%) and significantly lower at 0C than at 8C on days 14 (145%) and 18 (145%), while no significant differences were found between 15C and 0C or 8C. Fresh weight sig- nificantly increased from day 8 to days 11, 14 and 18 at 0 and 15C and significantly increased in each measuring day at 8C (Fig. 1).
After 7 days of temperature acclimation, maximal quantum yield of photosystem II (Fv/Fm)
Fv/Fm was significantly higher at 15C than at 8C (0.3%) and 4.5% higher at 8C than at 0C (15C > 8C > 0C). On day 11,Fv/Fm was significantly affected by the interaction of temperature and salinity. Fv/Fm was significantly higher at 30 psu than 20 psu at 0C, but not at 8 and 15C. At the end of the salinity treatment (day 18), the interaction of tempera- ture and salinity could not be tested due to the application of non-parametric tests. Quantum yield at 15C again was signif- icantly higher than at 8C (9.2%); not significant differences were observed between 8 or 15C and 0C. Salinity did not significantly affectedFv/Fmon day 18. (Fig. 2, Appendix S2– Table 3 in the Supporting Information).
Biochemical parameters
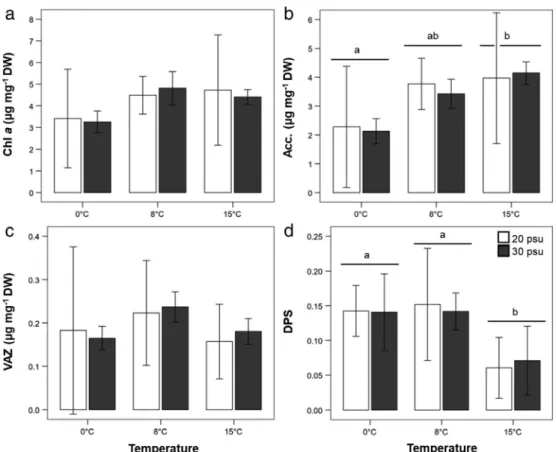
At the end of the experiment, on day 18, no significant interac- tion between temperature and salinity and no effect of salinity on pigment content was observed. Acc. and DPS were only sig- nificantly affected by temperature, but not Chl a and VAZ.
While DPS was significantly lower at 15C than at 0 and 8C (219%), Acc. content was significantly higher at 15C than at 0C (185%) and there was no significant difference to 8C (Fig. 3– Appendix S2– Table 4 in the Supporting Informa- tion). On day 8 (24h of salinity exposure), VAZ was affected by the interaction of temperature and salinity while Chl a(chlorophylla), Acc. and DPS were all significantly affected by temperature alone but not by salinity (Appendix S3 in the Supporting Information).
At the end of the salinity treatment (day 18) no significant interactions between temperature and salinity were detected in mannitol content but there were significant main effects. Mannitol Fig 1. Fresh weight ofSaccharina latissimafrom Brittany at day
0, 4, 7, 11, 14 and 18 at 0, 8 and 15C (% of initial weights;
meanSD; n = 3). Grey boxes mark 30 psu, white boxes 20 psu.
On the left, temperature acclimation phase–7 days at 0, 8, 15C and control salinity 30 psu; and on the right, hyposalinity expo- sure phase–sporophytes were exposed to low (20 psu) and con- trol (30 psu) salinity at 0, 8, 15C for 11 days.
Fig 2. Maximal quantum yield of photosystem II (Fv/Fm) of Saccharina latissimafrom Brittany at day 0, 4, 7, 8, 11, 14 and 18 at 0, 8 and 15C (meanSD; n = 5). Grey boxes mark 30 psu, white boxes 20 psu. On the left, temperature acclimation phase–7 days at 0, 8, 15C and control salinity 30 psu; and on the right, hyposalinity exposure phase–sporophytes were exposed to low (20 psu) and con- trol (30 psu) salinity within 0, 8, 15C for 11 days. Asterisks indicate significant differences between salinities (P< 0.05).
content was 550% significantly higher at 0C than at 8C and 15C and significantly lower at low salinity than at the control (203%) (Fig. 4, Appendix S2–Table 4 in the Supporting Informa- tion). Pattern of mannitol variation was similar for days 8 and 11, however, differences between salinity levels were only signifi- cant on day 18 (Appendix S4 in the Supporting Information).
On day 18, the interaction between temperature and salinity on C:N ratios could not be tested due to the application of non- parametric test. The C:N ratio was significantly higher at 15C than at 8C (11%) and no significant difference to 0C was observed. There was no significant effect of salinity (Fig. 5, Appendix S2–Table 4 in the Supporting Information). The var- iation in the C:N ratio across the experimental period is depicted in the Appendix S5 in the Supporting Information. On days 8 and 11, the C:N ratios were not significantly affected by the interaction of temperature and salinity, however single effects were significant. Overall C:N increased from 0C to 15C to 8C, and overall higher C:N ratio was measured at lower salinities. Total carbon and nitrogen content are available on the Appendixes S6 and S7 in the Supporting Information.
DISCUSSION
The current investigation of Saccharina latissima from Brit- tany revealed that juvenile sporophytes are especially sensitive
to low temperatures of 0C and to a decreased salinity of 20 psu, both compromising fitness and causing increasing stress while little differences were identified between interme- diate (8C) and high (15C) temperatures. While all biochemi- cal and physiological parameters significantly responded to temperature, low salinity was also a stress agent but on a lower level and both factors did not interact where testable.
Most interesting, and reported here for the first time, is the fivefold increase of mannitol levels inS. latissima under low temperature (0C) which already became activated after a short treatment of 8 days. Comparison with a study with S. latissimafrom an Arctic location (Liet al. 2020) which was performed under identical conditions reveals that both populations in general exhibited the same response pattern and cannot thereby be considered as ecotypes in the condi- tions of this experiment. Nevertheless, differences in initial values, morphology, the time-dependent modulation of some parameters and earlier studies of transcriptomic response, indicate divergence between the two locations, suggesting that ecotypes might be forming and that they might be rev- ealed at the phenotypic level with more extreme stress levels or with different parameters measured. This would be in accordance with the ecotypic differentiation between Arctic and temperate populations (Helgoland, North Sea) already suggested by previous studies (Mülleret al. 2008; Olischläger et al. 2014).
Fig 3. Chlorophylla(Chla) content (a), accessory pigment pool (Acc.) (b), pool of xanthophylls (VAZ) (c) (μg mg−1DW; meanSD; n = 5) and de-epoxydation state (DPS) (d) (meanSD; n = 5) ofSaccharina latissimafrom Brittany after exposure to two salinity conditions (20 psu, 30) at three temperatures (0, 8, 15C) on day 18. Grey boxes mark 30 psu, white boxes 20 psu. Different lower-case letters indicate significant differences between temperatures (P< 0.05). Significant differences were identified for Chlaand Acc. after exponential transformation.
Exposure to 0C indicates compromised photosynthesis at low temperature as effective quantum yieldFv/Fm decreased at several time points and the accessory pigments pool was lowered at day 18; both may explain the overall lower growth of sporophytes at 0C. The xanthophyll cycle (VAZ and DPS)
is a component of stress response of plants, brown and green seaweeds (Goss & Jakob 2010). The xanthophyll cycle pig- ment pool (VAZ) was unaffected by temperature in this study.
In turn, the Arctic material ofS. latissima increased its VAZ content at 15C compared to 0 and 8C (Liet al. 2020). Dif- ferent modulation of VAZ content between algae originating from different locations (Spitsbergen and Helgoland) has already been reported (Olischlägeret al. 2017). VAZ was also significantly affected by salinity. Higher VAZ content was already measured at 20 psu after one day of salinity treatment (day 8) but only at 0C. In contrast, in material from the Arc- tic this effect was more pronounced as VAZ was higher at 20 psu at all temperatures (Liet al. 2020). Furthermore, we observed a decrease of the de-epoxidation state (DPS) at 15C when compared to 0 and 8C in algae from Brittany.
Similarly, in algae from the Arctic under similar experimental conditions, DPS was significantly higher at 0C than at 8 and 15C (Liet al. 2020). This is in accordance with Olischläger et al. (2017) who observed a decrease in DPS with increasing temperature for sporophytes from the Arctic and Helgoland after 18 days of exposure to a combination of temperature and pCO2 levels. High DPS values provide protection from photo-oxidative damage by energy dissipation and therefore it is expected to be higher under stressful conditions (Mülleret al. 2001, Fernández-Marínet al. 2011). This was the case at low temperature and at the low salinity treatment applied in this study and thereby supports our hypothesis that a combi- nation of low temperature and low salinities is most stressful for the Brittany population.
Mannitol concentrations were more than 500% higher at 0C than at 8 and 15C across the experimental period. This drastic increase at low temperature suggests a cryoprotectant role for mannitol that has not been described in kelps so far.
Sugar alcohols, such as mannitol, have been reported as cryo- protectant agents–conferring protection against anti-freezing in several organisms (Elliottet al. 2017). In fungi, cold toler- ance in polar habitats is positively correlated with sugar alco- hol content, among other mechanisms (Robinson 2001).
Although the role of mannitol as cryoprotectant has not been described in brown algae so far, a survey of seasonal variation on mannitol concentrations inSargassum mangarevenseand Turbinaria ornatarevealed that the content was higher in win- ter than summer– 108% inS. mangarevenseand 164% in T. ornata(Zubiaet al. 2008). Similarly, in a marine ecotype of Fucus vesiculosus, mannitol content was higher at 0C than at 10C (around 125%), although there were no signifi- cant changes in the brackish ecotype (Gylleet al. 2009). In the present study, increase in mannitol concentration was considerably higher and it was also a relatively fast response to cold shock, already apparent 8 days after transfer to 0C.
As expected, hypoosmotic conditions led to a decrease in mannitol content compared with control salinity. Mannitol acts as osmolyte and compatible solute in brown macroalgae and thereby maintains the cellular functions under varying salinities (e.g. Kirst 1990; Eggert et al. 2007; Diehl et al. 2020). Adjustment in osmolyte concentration has been described as the second stage of osmotic acclimation, being a slow and long-term response to changing osmotic conditions, taking up to a few days and being energy demanding (Kirst 1990; Karstenet al. 1991b). Mannitol concentration at 20 psu was significantly lower than at 30 psu in all Fig 4. Mannitol content (mg g−1 DW; meanSD; n = 3) of
Saccharina latissimafrom Brittany after exposure to two salinity conditions (20 psu, 30) at three temperatures (0, 8, 15C) on day 18. Grey boxes mark 30 psu, white boxes 20 psu. Different lower- case letters indicate significant differences between temperatures (P< 0.05). Different upper-case letters indicate significant differ- ences between salinities (P< 0.05). Significant differences were identified after log10 transformation.
Fig 5. C:N ratio (meanSD; n = 4) of Saccharina latissima from Brittany after exposure to two salinity conditions (20 psu, 30) at three temperatures (0, 8, 15C) on day 18. Grey boxes mark 30 psu, white boxes 20 psu. Different lower-case letters indicate significant differences between temperatures (P< 0.05).
temperatures after 11 experimental days (day 18), suggesting that adjustment in osmolyte concentrations is a long-term process.
Temperate and tropicalfield macroalgae feature a mean C:
N ratio of 20, with lower values indicating N limitation (Atkinson & Smith 1983). The samples measured in this study had a C:N ratio of approximately 6–10, meaning that the algae did not suffer from N limitation in any experimental condition as expected due to a high NO3content supplied by the cultivation medium (Provasoli, Starr & Zeikus 1993). C:N ratios measured in the present work inS. latissimawere lower than reported before infield Phaeophyceae (Peterset al. 2005;
Scheschonket al. 2019). Several studies report increasing C:
N ratios at sub-optimal temperatures on brown macroalgae (e.g. Gordillo et al. 2006; Graiff et al. 2015). Temperature variation induces changes in the enzymatic reaction, affecting for instance nutrient uptake and assimilation (Hurd et al. 2014). We could not detect distinct impacts of tempera- ture or salinity on the C:N ratio on day 18. Though the varia- tion is marginal, significant differences in C:N ratio were detected between 8 and 15C, possibly since our sporophytes were grown at 8C.
Genomic basis of stress response to salinity and temperature variation
Transcriptomic analyses of material from the same experiment as reported here, revealed that after 24 h of exposure to low salinity (day 8) extensive metabolic reprogramming took place in Arctic and Brittany S. latissima material (Monteiro et al. 2019). Metabolic pathways involved included photosyn- thesis, pigment synthesis, transport, signaling, cell wall syn- thesis and reorganization and stress related enzymes.
Interestingly, the overall extensive repression of photosynthe- sis related DEGs after 1 day of salinity treatment was not mir- rored in the pigment contents and quantum yield of the sporophytes (this study; Monteiroet al. 2019; Liet al. 2020).
Although no data on gene expression is available for day 18, we assume that effects at the physiological level are rev- ealed later than at the transcriptomic level as has been reported earlier (Heinrichet al. 2015; Iñiguez et al. 2017).
An alternative explanation is that algae were able to acclimate to short-term hyposalinity (one day) by metabolic reorganiza- tion that stabilized physiological responses. While this may be valid for explaining short-term responses, long-term regulation possibly is different as the algae were no longer able to with- stand the effects of low salinity after 11 days of exposure and growth was compromised. An ameliorating effect of high tem- perature was observed at the transcriptomic level for S. latissima sporophytes from both Brittany and the Arctic (Monteiroet al. 2019). At 15C, low salinity drove less trans- criptomic changes than at the lower temperatures of 0 and 8C. In contrast, interactive effects at the photo-physiological level (Fv/Fm and pigment content) were less prominent within material of both populations (this study and Liet al. 2020).
Differences driven by geographical variation
The existence of ecotypes has been described forS. latissima across its latitudinal range (e.g. Gerard & Du Bois 1988;
Mülleret al. 2008). An ecotype is defined to perform better at the local conditions than another population from a distant location with other local environmental factors (Kawecki &
Ebert 2004). Therefore, we compared data gathered here for material from Roscoff, Brittany to Arctic material from Spits- bergen presented in Li et al. (2020). Algae from both loca- tions were cultivated at similar conditions from the gametophyte stage and were exposed to an identical experi- mental design. Samples from the Arctic grew faster than algae from Brittany in all conditions. For both locations, growth, pig- ment content,Fv/Fm was generally higher at higher tempera- tures than at 0C. Overall, low salinity led to a decrease in growth and Fv/Fm and an increase in xanthophyll cycle pig- ments VAZ in algae from both locations significantly at certain time points. Therefore, different to our hypothesis, we do not observe a higher growth rate and physiological performance of S. latissimafrom the Arctic at the local conditions (low salin- ity and low temperature) compared to material from Brittany.
Hence, ecotypic differentiation cannot be implied from the results of biochemical and physiological parameters measured during this experiment. Nonetheless, we observed differences between sporophytes from both locations in several parame- ters, at the end of the cultivation phase on day 0 - namely fresh weight, pigment content, andFv/Fm (data not shown).
Similarly, differences in biochemical composition and fresh weight in response to the same level of temperature (10C) have been previously reported between a temperate and Artic population (Olischlägeret al. 2014). In addition, morphology differed considerably between algae from Brittany and the Arctic indicating phenotypes. Sporophytes from the Arctic were narrower and longer while algae from Brittany were wider and shorter. This diverging morphology was also described between sporophytes of S. latissima from a glacially- influenced site and an oceanic site in Alaska, USA (Spurkland & Iken 2012). Moreover, even though similar trends in pigment content variation were observed for both locations, there were differences across exposure time. A stronger short-term response was observed in sporophytes from Brittany than from Spitsbergen. On day 18, only DPS and Acc. were significantly modulated in algae from both locations; however, DPS was significantly higher at low salin- ity only in sporophytes from the Arctic. Moreover, a significant decrease in growth due to low salinity was evident already on day 11 in algae from Brittany but only on day 18 for algae from the Arctic. Furthermore, at the transcriptomic level, short-term transcriptomic responses between sporophytes of both locations diverged both in magnitude and metabolic pathways involved that correlate to a certain extent with local conditions (Monteiroet al. 2019). Therefore, we suggest that ecotypic differentiation is already taking place and might in future be revealed at the physiological and biochemical level by studies targeting extreme abiotic factor levels and/or longer exposure times.
ACKNOWLEDGMENTS
We are grateful to Andreas Wagner for his support during algae cultivation and laboratory experiments and to Britta Meyer-Schlosser for her support with pigment measurements.
Thank you to Ulf Karsten and Juliane Müller from the Univer- sity of Rostock for the support in analyzing Mannitol and C:N.
This work was supported by the German Research Foundation for funding within the ERA-Net Cofund BiodivERsA 3 program MARFOR (DFG; grant no.VA 105/25-1). Further funding was provided by the MARES Joint Doctoral Programme on Marine Ecosystem Health & Conservation through Erasmus Mundus.
Open access funding enabled and organized by Projekt DEAL.
REFERENCES
Andersen, G. S., Pedersen, M. F. and Nielsen, S. L. 2013. Tempera- ture acclimation and heat tolerance of photosynthesis in Norwe- gian Saccharina latissima (Laminariales, Phaeophyceae).
J. Phycol.49: 689–700.
Araújo, R., Assis, J., Aguillar, R. et al. 2016. Status, trends and drivers of kelp forests in Europe: an expert assessment.Biodivers.
Conserv.25: 1319–48.
Atkinson, M. and Smith, S. 1983. C: N: P ratios of benthic marine plants.Limnol. Oceanogr.28: 568–74.
Bartsch, I., Wiencke, C., Bischof, K.et al. 2008. The genusLaminaria sensu lato: recent insights and developments. Eur. J. Phycol.
43: 1–86.
Bernard, M., Rousvoal, S., Collet, N.et al. 2019. A highly prevalent filamentous algal endophyte in natural populations of the sugar kelp Saccharina latissimais not detected during cultivation in Northern Brittany.Aquat. Living Resour.32: 21.
Boderskov, T., Schmedes, P. S., Bruhn, A., Rasmussen, M. B., Nielsen, M. M. and Pedersen, M. F. 2016. The effect of light and nutrient availability on growth, nitrogen, and pigment contents of Saccharina latissima (Phaeophyceae) grown in outdoor tanks, under natural variation of sunlight and temperature, during autumn and early winter in Denmark. J. Appl. Phycol. 28: 1153–65.
Bolton, J. J. and Lüning, K. 1982. Optimal growth and maximal sur- vival temperatures of AtlanticLaminariaspecies (Phaeophyta) in culture.Mar. Biol.66: 89–94.
Borum, J., Pedersen, M., Krause-Jensen, D., Christensen, P. and Nielsen, K. 2002. Biomass, photosynthesis and growth ofLami- naria saccharinain a high-arctic fjord, NE Greenland.Mar. Biol.
141: 11–9.
Colombo-Pallotta, M. F., García-Mendoza, E. and Ladah, L. B. 2006.
Photosynthetic performance, light absorption, and pigment com- position of Macrocystis pyrifera (Laminariales, Phaeophyceae) blades from different depths.J. Phycol.42: 1225–34.
COSYNA Data. 2010. Coastal Observing System for Northern and Arctic Seas. [Cited on 01 February 2017]. Available from: http://
codm.hzg.de/codm/
Davison, I. R. 1987. Adaptation of photosynthesis in Laminaria saccharina (Phaeophyta) to changes in growth temperature.
J. Phycol.23: 273–83.
Dayton, P. K. 1985. Ecology of kelp communities.Annu. Rev. Ecol.
Syst.16: 215–45.
Diehl, N., Karsten, U. and Bischof, K. 2020. Impacts of combined temperature and salinity stress on the endemic Arctic brown sea- weedLaminaria solidungulaJ. Agardh.Polar Biol.43: 647–56.
Dring, M. J., Makarov, V., Schoschina, E., Lorenz, M. and Lüning, K.
1996. Influence of ultraviolet-radiation on chlorophyll fluores- cence and growth in different life-history stages of three species of Laminaria(Phaeophyta).Mar. Biol.126: 183–91.
Druehl, L. D. and Hsiao, S. I. C. 1977. Intertidal kelp response to sea- sonal environmental changes in a British Columbia inlet.J. Fish.
Res. Board Can.34: 1207–11.
Eggert, A., Raimund, S., Michalik, D., West, J. and Karsten, U. 2007.
Ecophysiological performance of the primitive red algaDixoniella
grisea (Rhodellophyceae) to irradiance, temperature and salinity stress: growth responses and the osmotic role of mannitol.
Phycologia46: 22–8.
Elliott, G. D., Wang, S. and Fuller, B. J. 2017. Cryoprotectants: a review of the actions and applications of cryoprotective solutes that modulate cell recovery from ultra-low temperatures.Cryobiol- ogy76: 74–91.
Fernand, F., Israel, A., Skjermo, J., Wichard, T., Timmermans, K. R.
and Golberg, A. 2017. Offshore macroalgae biomass for bioenergy production: environmental aspects, technological achievements and challenges.Renew. Sustain. Energy Rev.75: 35–45.
Fernandes, F., Barbosa, M., Oliveira, A. P.et al. 2016. The pigments of kelps (Ochrophyta) as part of theflexible response to highly vari- able marine environments.J. Appl. Phycol.28: 3689–96.
Fernández-Marín, B., Míguez, F., Becerril, J. M. and García- Plazaola, J. I. 2011. Activation of violaxanthin cycle in darkness is a common response to different abiotic stresses: a case study in Pelvetia canaliculata.BMC Plant Biol.11: 181.
Gerard, V. and Du Bois, K. 1988. Temperature ecotypes near the southern boundary of the kelpLaminaria saccharina. Mar. Biol.
97: 575–80.
Gévaert, F., Créach, A., Davoult, D.et al. 2003.Laminaria saccharina photosynthesis measuredin situ: photoinhibition and xanthophyll cycle during a tidal cycle.Mar. Ecol. Prog. Ser.247: 43–50.
Gordillo, F. J., Dring, M. J. and Savidge, G. 2002. Nitrate and phos- phate uptake characteristics of three species of brown algae cul- tured at low salinity.Mar. Ecol. Prog. Ser.234: 111–8.
Gordillo, F. J., Aguilera, J. and Jiménez, C. 2006. The response of nutrient assimilation and biochemical composition of Arctic seaweeds to a nutrient input in summer. J. Exp. Bot. 57: 2661–71.
Goss, R. and Jakob, T. 2010. Regulation and function of xanthophyll cycle-dependent photoprotection in algae. Photosyn. Res. 106: 103–22.
Graiff, A., Liesner, D., Karsten, U. and Bartsch, I. 2015. Temperature tolerance of western Baltic SeaFucus vesiculosus–growth, photo- synthesis and survival.J. Exp. Mar. Biol. Ecol.471: 8–16.
Grubbs, F. E. 1969. Procedures for detecting outlying observations in samples.Dent. Tech.11: 1–21.
Gylle, A. M., Nygård, C. A. and Ekelund, N. G. 2009. Desiccation and salinity effects on marine and brackish Fucus vesiculosus L. (Phaeophyceae).Phycologia48: 156–64.
Hafting, J. T., Craigie, J. S., Stengel, D. B.et al. 2015. Prospects and challenges for industrial production of seaweed bioactives.
J. Phycol.51: 821–37.
Hanelt, D. 1998. Capability of dynamic photoinhibition in Arctic macro- algae is related to their depth distribution.Mar. Biol.131: 361–9.
Harley, C. D. G., Anderson, K. M., Demes, K. W.et al. 2012. Effects of climate change on global seaweed communities.J. Phycol.48: 1064–78.
Heinrich, S., Valentin, K., Frickenhaus, S., John, U. and Wiencke, C.
2012. Transcriptomic analysis of acclimation to temperature and light stress inSaccharina latissima(Phaeophyceae).PLoS One7: e44342.
Heinrich, S., Valentin, K., Frickenhaus, S. and Wiencke, C. 2015.
Temperature and light interactively modulate gene expression in Saccharina latissima(Phaeophyceae).J. Phycol.51: 93–108.
van den Hoek, C. 1982. The distribution of benthic marine algae in relation to the temperature regulation of their life histories.Biol.
J. Linn. Soc. Lond.18: 81–144.
Hurd, C. L., Lobban, C. S., Bischof, K. and Harrison, P. J. 2014.
Nutrients. In Seaweed Ecology and Physiology, 2nd ed.
Cambridge, England: Cambridge University Press. 238–293.
Iñiguez, C., Heinrich, S., Harms, L. and Gordillo, F. J. L. 2017.
Increased temperature and CO2 alleviate photoinhibition inDes- marestia anceps: from transcriptomics to carbon utilization.
J. Exp. Bot.68: 3971–84.
Iwamoto, K. and Shiraiwa, Y. 2005. Salt-regulated mannitol metabo- lism in algae.Marine Biotechnol.7: 407–15.
Karsten, U. 2007. Salinity tolerance of Arctic kelps from Spitsbergen.
Phycol. Res.55: 257–62.
Karsten, U., Thomas, D. N., Weykam, G., Daniel, C. and Kirst, G. O.
1991a. A simple and rapid method for extraction and separation of low molecular weight carbohydrates from macroalgae using high-performance liquid chromatography.Plant Physiol. Biochem.
29: 373–8.
Karsten, U., Wiencke, C. and Kirst, G. 1991b. The effect of salinity changes upon the physiology of eulittoral green macroalgae from Antarctica and southern Chile: II intracellular inorganic ions and organic compounds.J. Exp. Bot.42: 1533–9.
Kawecki, T. J. and Ebert, D. 2004. Conceptual issues in local adapta- tion.Ecol. Lett.7: 1225–41.
Kirst, G. 1990. Salinity tolerance of eukaryotic marine algae.Annu.
Rev. Plant Biol.41: 21–53.
Koch, K., Thiel, M., Hagen, W. et al. 2016. Short- and long-term acclimation patterns of the giant kelp Macrocystis pyrifera (Laminariales, Phaeophyceae) along a depth gradient.J. Phycol.
52: 260–73.
Li, H., Monteiro, C., Heinrich, S.et al. 2020. Responses of the kelp Saccharina latissima(Phaeophyceae) to the warming Arctic: from physiology to transcriptomics.Physiol. Plant.168: 5–26.
Lima, F. P., Ribeiro, P. A., Queiroz, N., Hawkins, S. J. and Santos, A. M. 2007. Do distributional shifts of northern and south- ern species of algae match the warming pattern? Glob. Chang.
Biol.13: 2592–604.
Lüning, K. 1990.Seaweeds: Their Environment, Biogeography, and Ecophysiology. USA: John Wiley & Sons.
Mesnildrey, L., Jacob, C., Frangoudes, K., Reunavot, M., and Lesueur, M. 2012. Seaweed industry in France. Report Interreg program NETALGAE. Pôle halieutique AGROCAMPUS OUEST.
Interreg IVb WP1 and 2 report. Rennes.
Monteiro, C. M. M., Li, H., Bischof, K.et al. 2019. Is geographi- cal variation driving the transcriptomic responses to multiple stressors in the kelp Saccharina latissima? BMC Plant Biol.
19: 513.
Mortensen, L. M. 2017. Diurnal carbon dioxide exchange rates of Saccharina latissimaandLaminaria digitataas affected by salinity levels in Norwegian fjords.J. Appl. Phycol.29: 3067–75.
Moy, F. E. and Christie, H. 2012. Large-scale shift from sugar kelp (Saccharina latissima) to ephemeral algae along the south and west coast of Norway.Mar. Biol. Res.8: 309–21.
Müller, P., Li, X.-P. and Niyogi, K. K. 2001. Non-photochemical quenching. A response to excess light energy.Plant Physiol.125: 1558–66.
Müller, R., Wiencke, C. and Bischof, K. 2008. Interactive effects of UV radiation and temperature on microstages of Laminariales (Phaeophyceae) from the Arctic and North Sea.Climate Res.37: 203–13.
Neiva, J., Paulino, C., Nielsen, M. M.et al. 2018. Glacial vicariance drives phylogeographic diversification in the amphi-boreal kelp Saccharina latissima.Sci. Rep.8: 1112.
Nielsen, H. D. and Nielsen, S. L. 2008. Evaluation of imaging and conventional PAM as a measure of photosynthesis in thin-and thick-leaved marine macroalgae.Aquat. Biol.3: 121–31.
Nielsen, M. M., Manns, D., D’Este, M.et al. 2016. Variation in bio- chemical composition of Saccharina latissima and Laminaria digitataalong an estuarine salinity gradient in inner Danish waters.
Algal Res.13: 235–45.
Olischläger, M., Iñiguez, C., Gordillo, F. J. L. and Wiencke, C. 2014.
Biochemical composition of temperate and Arctic populations of Saccharina latissimaafter exposure to increased pCO2 and tem- perature reveals ecotypic variation.Planta240: 1213–24. https://
doi.org/10.1007/s00425-014-2143-x.
Olischläger, M., Iñiguez, C., Koch, K., Wiencke, C. and Gordillo, F. J. L. 2017. Increased pCO2and temperature reveal ecotypic differences in growth and photosynthetic performance of temperate and Arctic populations ofSaccharina latissima.Planta 245: 119–36.
Peters, K. J., Amsler, C. D., Amsler, M. O., McClintock, J. B., Dunbar, R. B. and Baker, B. J. 2005. A comparative analysis of the nutritional and elemental composition of macroalgae from the western Antarctic Peninsula.Phycologia44: 453–63.
Robinson, C. H. 2001. Cold adaptation in Arctic and Antarctic fungi.
New Phytol.151: 341–53.
Sanderson, J. C., Dring, M. J., Davidson, K. and Kelly, M. S. 2012.
Culture, yield and bioremediation potential of Palmaria palmata (Linnaeus) Weber & Mohr and Saccharina latissima (Linnaeus) C.E. Lane, C. Mayes, Druehl & G.W. Saunders adjacent to fish farm cages in northwest Scotland.Aquaculture354-355: 128–35.
Scheschonk, L., Becker, S., Hehemann, J. H., Diehl, N., Karsten, U.
and Bischof, K. 2019. Arctic kelp eco-physiology during the polar night in the face of global warming: a crucial role for laminarin.
Mar. Ecol. Prog. Ser.611: 59–74.
Schmid, M., Guihéneuf, F. and Stengel, D. B. 2017. Ecological and commercial implications of temporal and spatial variability in the composition of pigments and fatty acids infive Irish macroalgae.
Mar. Biol.164: 158.
SOMLIT Service d’Observation en Milieu LITtoral. 1995. The Coastal Environment Observation Service. [Cited 01 February 2017].
Available from: http://somlit.epoc.ubordeaux1.fr/fr/
Spurkland, T. and Iken, K. 2011. Salinity and irradiance effects on growth and maximum photosynthetic quantum yield in subarctic Saccharina latissima(Laminariales, Laminariaceae).Bot. Mar.54: 355–65.
Spurkland, T. and Iken, K. 2012. Seasonal growth patterns of Saccharina latissima(Phaeophyceae, Ochrophyta) in a glacially- influenced subarctic estuary.Phycol. Res.60: 261–75.
Starr, R. C. and Zeikus, J. A. 1993. UTEX—the culture collection of algae at the University of Texas at Austin 1993 list of cultures.
J. Phycol.29: 1–106.
Stengel, D. B., Connan, S. and Popper, Z. A. 2011. Algal chemodiversity and bioactivity: sources of natural variability and implications for commercial application. Biotechnol. Adv. 29: 483–501.
Tatewaki, M. 1966. Formation of a crustaceous sporophyte with uni- locular sporangia inScytosiphon lomentaria.Phycologia6: 62–6.
Wells, M. L., Potin, P., Craigie, J. S.et al. 2017. Algae as nutritional and functional food sources: revisiting our understanding.J. Appl.
Phycol.29: 949–82.
Zubia, M., Payri, C. and Deslandes, E. 2008. Alginate, mannitol, phe- nolic compounds and biological activities of two range-extending brown algae, Sargassum mangarevense and Turbinaria ornata (Phaeophyta: Fucales), from Tahiti (French Polynesia). J. Appl.
Phycol.20: 1033–43.
SUPPORTING INFORMATION
Additional Supporting Information may be found in the online version of this article at the publisher’s web-site:
Appendix S1. Experimental design and parameters measured during the temperature and salinity experiment in sporophytes ofSaccharina latissima. In laboratory, sporophytes were culti- vated at 8C and 30 psu. At the start of the experiment, they were acclimated for seven days at 0, 8 and 15C. After seven days, they were exposed to a low salinity of 20 psu for eleven days, resulting in a total of 18 experimental days. Sampling days are indicated for pigment content, growth, maximal
quantum yield of photosystem II (Fv/Fm), mannitol content;
carbon (C) and nitrogen (N) contents and carbon to nitrogen ratio (C:N).
Appendix S2. Results of the statistical tests applied to the parameters Fv/Fm, fresh weight, pigments, mannitol and C:N.
Appendix S3. Chlorophylla(Chla) content (A), accessory pig- ment pool (Acc.) (B), pool of xanthophylls (VAZ) (C) (μg mg−1 DW; meanSD; n = 5) and de-epoxydation state (DPS) (D) (meanSD; n = 5) of Saccharina latissima from Brittany after exposure to two salinity conditions (20 psu, 30) and three temperatures (0, 8, 15C) on day 8. Grey boxes mark 30 psu, white boxes 20 psu. Different lower-case letters indi- cate significant differences between temperatures (P< 0.05).
Significant differences were identified for Chlaand Acc. after exponential transformation.
Appendix S4. Mannitol content (mg g−1 DW; meanSD;
n = 3) ofSaccharina latissimafrom Brittany after exposure to two salinity conditions (20 psu, 30) and three temperatures (0, 8, 15C) across experimental days 8, 11 and 18. Different lower-case letters indicate significant differences between
temperatures (P< 0.05). Different upper-case letters indicate significant differences between salinities (P< 0.05). For day 18, significant differences were identified on day 18 after log10 transformation.
Appendix S5. C:N ratio (meanSD; n = 4) of Saccharina latissima from Brittany after exposure to two salinity condi- tions (20 psu, 30) and three temperatures (0, 8, 15C) across experimental days 8, 11 and 18. Different lower-case letters indicate significant differences between temperatures (P< 0.05). Different upper-case letters indicate significant differences between salinities (P< 0.05). For days 8 and 11, significant differences were identified at day 8 and 11 after log10 transformation.
Appendix S6. Carbon content (mg g−1DW; meanSD; n = 4) of Saccharina latissima from Brittany after exposure to two salinity conditions (20 psu, 30) and three temperatures (0, 8, 15C) across experimental days 8, 11 and 18.
Appendix S7. Nitrogen content (mg g−1 DW; meanSD;
n = 4) ofSaccharina latissimafrom Brittany after exposure to two salinity conditions (20 psu, 30) and three temperatures (0, 8, 15C) across experimental days 8, 11 and 18.