Continuous thermosalinograph oceanography along RV POLARSTERN cruise track PS122_1
Data Processing Report
Contents
1 Introduction 1
2 Sensor Details 1
3 Processing Report 2
4 Appendix 6
Contact:
Gerd Rohardt
Alfred-Wegener-Institute
Am Handelshafen 12, D-27570 Bremerhaven, GERMANY Mail: info@awi.de
Processing Agency:
FIELAX
Gesellschaft für wissenschaftliche Datenverarbeitung mbH Schleusenstr. 14, D-27568 Bremerhaven, GERMANY Tel: +49 (0) 471 30015 0
Fax: +49 (0) 471 30015 22 Mail: info@fielax.de
Ref.: PS122_1_TSG.pdf Vers.: 1 Date: 2021/05/06 Status: final
1 Introduction
This report describes the processing of raw data acquired by the thermosalinographs on board RV Polarstern during expedition PS122_1 to receive cleaned up and corrected salinity data. Detailed description of the processing of the data and the workflow is given in the general report: “General processing report of continuous thermosalinograph oceanography from RV POLARSTERN cruises:
PS121, PS122_1, PS122_2, PS122_3, PS122_4, PS122_5 ” .
Cruise details
Vessel name: RV Polarstern Cruise name: PS122_1 Cruise start: 2019-09-20 Cruise end: 2019-12-13 Cruise duration: 84 days Working area: Arctic Ocean
2 Sensor Details
Following sensors were installed during cruise PS122_1. Only data from TSG1 are uploaded to PANGAEA for cruise PS122_1 and are furthermore considered in this report (for reasoning see General Processing Report).
TSG1 TSG2
Serial number SBE21-3189 SBE21-3354
Installation 2019-06-28 2019-06-28
Deinstallation 2020-10-30 2020-10-30
Days installed 490 490
External temperature sensor SBE38-0136 SBE38-0154
3 Processing Report
Database Extraction
Data source DSHIP database (dship.awi.de)
Start of raw file 2019-09-20T17:30:00
End of raw file 2019-12-13T09:09:59
Number of lines in hexadecimal raw file
7227600
First dataset 2019-09-27T02:51:46
Last dataset 2019-12-13T09:09:58
TSG1 valid data 1664702
Calculation of 10min means
The calculation of 10min means included the removal of outliers outside a 2-times standard devia- tion for each data interval. The number of outliers for each parameter are given here.
Number of outliers >2*std Internal temperature 65838
Conductivity 60481
External temperature 68177
Salinity 77320
Result after outlier removal Number 10-min-means 11102
Manual flagging
After processing the data were visually inspected. The whole data from a specific timestamp were deleted if there was only one parameter to be manually flagged. 0data points were manually re- moved from the TSG1 dataset of PS122_1.
Assigning navigation data
Data from the corrected mastertrack of cruise PS122_1 were assigned to the 10min means of TSG1.
Normally, a speed filter of 0.5 knots minimum speed is applied to the TSG data in order to avoid redundant data. The speed filter was NOT applied to the data of PS122_1 because of the slow drifting speeds during expedition. See Figure 1 and Figure 2 for the processed and corrected data of TSG1.
Number of speed flags: 10175 (data maintained in final output file)
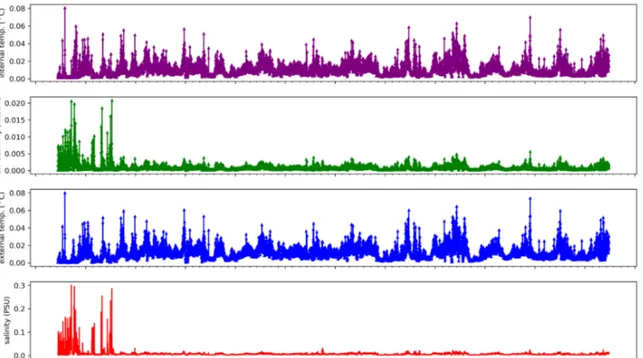
Figure 1: 10min means of data from TSG1
Figure 2: Standard deviations of 10min means of data from TSG1
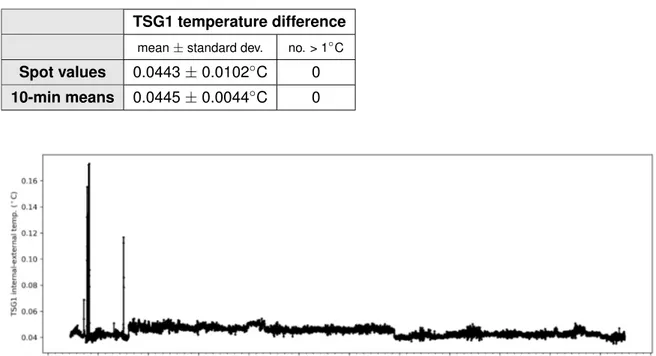
Differences between internal and external temperature of TSG1 temperature sensors
Temperature differences between the internal and the external temperature sensors have to be small under normal circulation conditions. Means and standard deviations for the temperature differences as well as the number of data with a difference larger than 1◦C are given in the following table and are shown in Figure 3.TSG1 temperature difference
mean±standard dev. no. > 1◦C
Spot values 0.0443±0.0102◦C 0 10-min means 0.0445±0.0044◦C 0
Figure 3: Differences between internal and external temperature sensors of TSG1
Result file
The result file is a plain text (tab-delimited values) file namedPS122_1_surf_oce.tabwith one data row in 10-min interval. Salinity values are calculated from the 10min means of conductivity and in- ternal temperature data using a pressure of 11 dbar for the calculations. The pressure refers to the 11m water depth of the water inlet of the TSG system on R.V. Polarstern. Water temperature taken from the TSG external temperature sensor is given for reference.
Column separator Tabulator "\t"
Column 1 Date and time expressed according to ISO 8601 Column 2 Latitude in decimal format, unit degree
Column 3 Longitude in decimal format, unit degree Column 4 Water Temperature, unit degree celsius Column 5 TSG Internal Temperature, unit degree celsius
Column 6 Conductivity, unit mS/cm
Comments
Data gaps due to system maintenance or system shutdown during harbour time:
- 29.09.2019; 02:47 UTC until 06:41 UTC; data gap because of system updates - 04.10.2019; several data gaps because of system updates
- 05.10.2019; 06:24 UTC until 06:32 UTC; data gap because of system updates Apart from this, data gaps are caused by speed flagging or manual removal of outliers.
4 Appendix
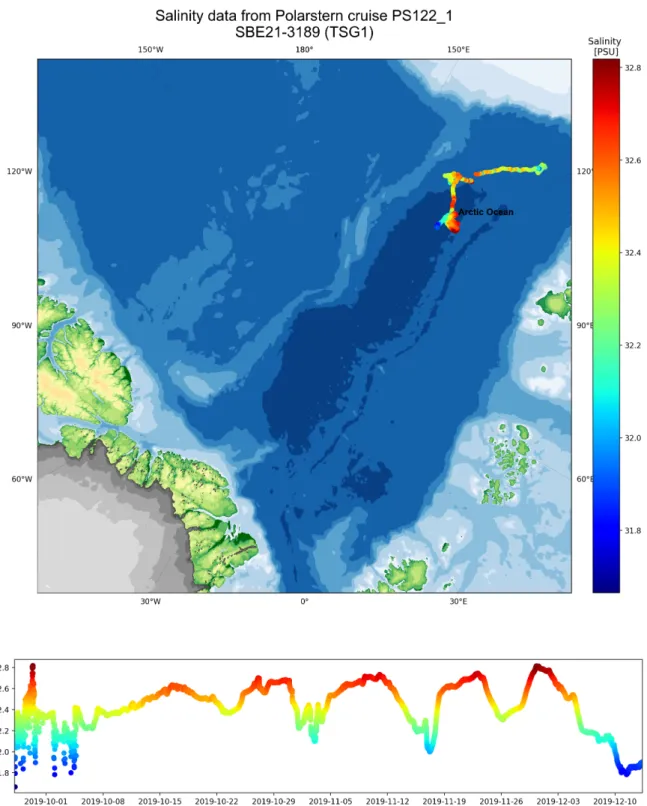
Figure 4: Salinity data from TSG1
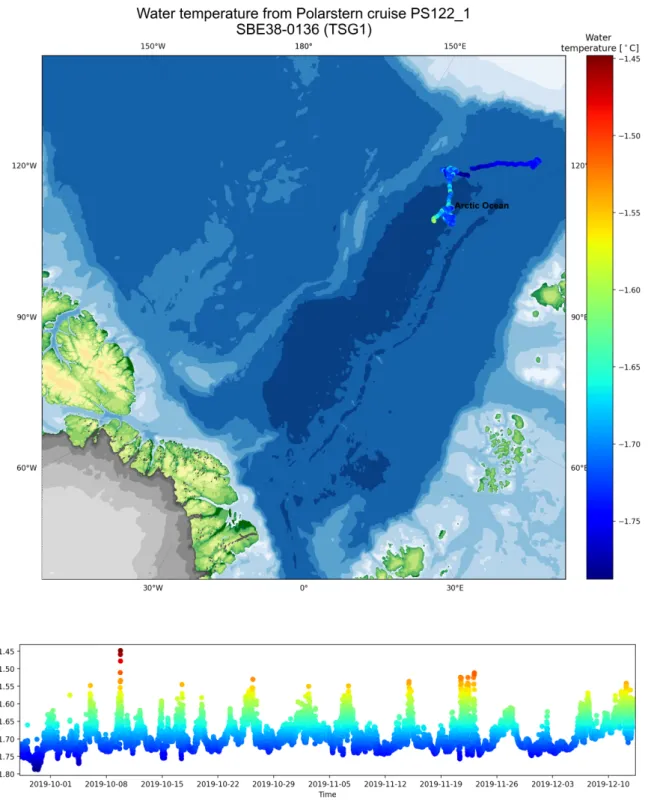
Figure 5: Temperature data from TSG1