Continuous thermosalinograph oceanography along RV POLARSTERN cruise track PS116
Data Processing Report
Contents
1 Introduction 1
2 Sensor Details 1
3 Processing Report 1
4 Appendix 5
Contact:
Gerd Rohardt
Alfred-Wegener-Institute
Am Handelshafen 12, D-27570 Bremerhaven, GERMANY Mail: info@awi.de
Processing Agency:
FIELAX
Gesellschaft für wissenschaftliche Datenverarbeitung mbH Schleusenstr. 14, D-27568 Bremerhaven, GERMANY Tel: +49 (0) 471 30015 0
Fax: +49 (0) 471 30015 22 Mail: info@fielax.de
Ref.: PS116_TSG.pdf Vers.: 1 Date: 2019/08/29 Status: final
1 Introduction
This report describes the processing of raw data acquired by the thermosalinographs on board RV Polarstern during expedition PS116 to receive cleaned up and corrected salinity data. Detailed description of the pro- cessing of the data and the workflow is given in the general report “General Processing Report of Surface T/S Data RV Polarstern Cruises PS116, PS117, PS118, PS119 and PS120”.
Cruise details
Vessel name: RV Polarstern Cruise name: PS116 Cruise start: 2018-11-11 Cruise end: 2018-12-11 Cruise duration: 30 days Working area: Atlantic Ocean
2 Sensor Details
Following sensors were installed during cruise PS116. Only data fromTSG2are uploaded to PANGAEA for cruise PS116 and are furthermore considered in this report (for reasoning see General Processing Report).
TSG1 TSG2
Serial number SBE21-3203 SBE21-3271
Installation 2018-10-16 2018-10-16
Deinstallation 2019-06-28 2019-06-28
Days installed 255 255
External temperature sensor SBE38-110 SBE38-119
3 Processing Report
Database Extraction
Data source DSHIP database (dship.awi.de)
Start of raw file 2018-11-10T09:00:00
End of raw file 2018-12-11T05:59:59
Number of lines in hexadecimal raw file 2667600
First dataset 2018-11-12T15:36:47
Last dataset 2018-12-10T06:28:58
TSG1 valid data 736569
Calculation of 10min means
The calculation of 10min means included the removal of outliers outside a 2-times standard deviation for each data interval. The number of outliers for each parameter are given here.
Number of outliers >2*std Internal temperature 19397
Conductivity 19464
External temperature 20534
Salinity 26464
Result after outlier removal Number 10-min-means 3340
Manual flagging
After processing the data were visually inspected. The whole data from a specific timestamp were deleted if there was only one parameter to be manually flagged. 4data points were manually removed from the TSG2 dataset of PS116.
Assigning navigation data
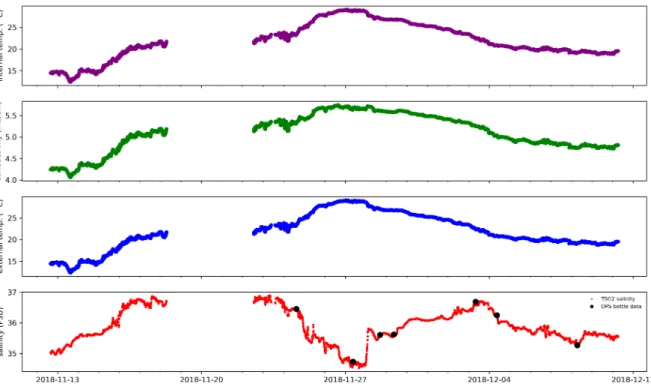
Data from the corrected mastertrack of cruise PS116 were assigned to the 10min means of TSG2. A speed filter of 0.5 knots minimum speed is applied to avoid redundant data. See Figure 1 and Figure 2 for the processed and corrected data of TSG2.
Number of speed flags: 41
Number of data in final output file: 3295
Figure 1: 10min means of data from TSG2
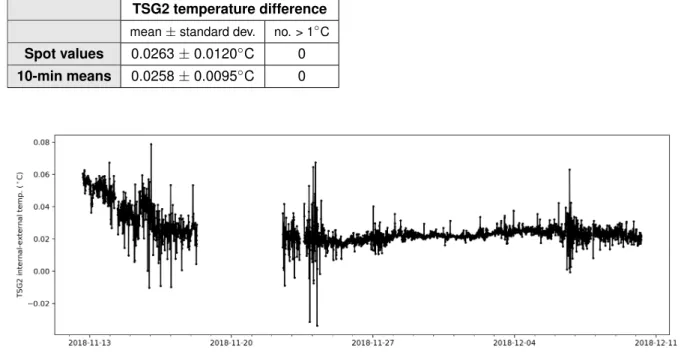
Differences between internal and external temperature of TSG2 temperature sensors
Temperature differences between the internal and the external temperature sensors have to be small under normal circulation conditions. Means and standard deviations for the temperature differences as well as the number of data with a difference larger than 1◦C are given in the following table and are shown in Figure 3.
TSG2 temperature difference mean±standard dev. no. > 1◦C Spot values 0.0263±0.0120◦C 0 10-min means 0.0258±0.0095◦C 0
Figure 3: Differences between internal and external temperature sensors of TSG2
Result file
The result file is a plain text (tab-delimited values) file namedPS116_surf_oce.tabwith one data row in 10- min interval. For further information on the result file see the General Processing Report.
Comments
Data gaps caused by system maintenance or system shutdown during harbour time:
18.11.2018 - 22.11.2018 harbour of Las Palmas
23.11.2018 system maintenance due to pollution of TSG2 07.12.2018 pollution of TSG1
10.12.2018 system maintenance due to pollution of TSG1
Apart from this, data gaps are due to speed flagging or manual flagging of outliers.
4 Appendix
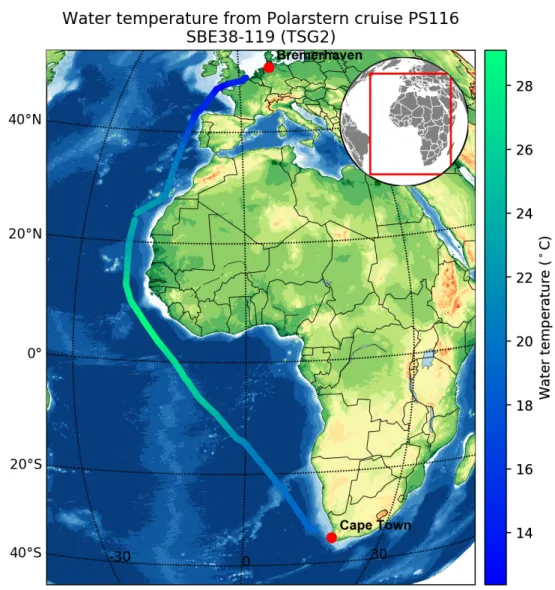
Figure 5: Temperature data from TSG2