Pyrolysis/Gasification
Operating Experience from Japanese Waste Gasification Plants with Direct Melting System
Nobuhiro Tanigaki, Tomo Kashiwabara and Toshimi Nagata
1. Introduction ...380
2. Materials and methods ...381
2.1. Process description ...381
2.2. Plant description and feedstock property ...382
3. Results and discussion ...383
3.1. Operational results ...383
3.2. Two years operation after completion in plant A ...384
3.3. Co-gasification for minimizing final landfill amount ...386
4. Conclusions ...387
5. References ...388
Gasification of municipal solid waste has been widely researched all over the world, is still of their interest and is recognized as an alternative thermal treatment. The Direct melting system is shaft-furnace type gasification and melting technology for various kinds of wastes. It has more than 46 references and has been operated for 38 years.
This gasification technology is employed to process municipal solid waste, but can also process various kinds of wastes together. Thanks to this process advantages, this gasification technology can achieve both the energy and material recovery from waste in one process. In other words, this technology can recover resources from waste using its waste flexibility.
Since 1979, this waste gasification technology has several R&D and has improved its operating conditions. Especially, in this study, operating results of two latest commercial waste gasification plants were reported.
Both the plants have been operated stably. Plant A, which focused on higher operating hours, was operated more than 7,200 hours per annum in the first two years. As the unexpected outages were 184 and 168 hours in the first year, and 34 and 48 hours in the second year, the plant availability is calculated to be similar level of European standard (more than 8,000 hours).
Pyrolysis/Gasification
Plant B employed co-gasification system, processing not only municipal solid waste but also Incineration bottom ash, rejects from recycling center, sewage sludge and in- combustibles in order to minimize the final landfill amount and maximize the resource recovery from waste. Because of this co-gasification concept, rejects and incombustibles which were generally landfilled can be recycled as slag and metal produced from gasifier, minimizing final landfill amount. According to our previous study and co-gasification concept, this gasification system has possibilities to achieve the Zero Waste and Cir- cular Economy recycling not only slag and metal containing no heavy metals but also air pollution control resides which heavy metals are highly concentrated, separately.
1. Introduction
Gasification of waste or biomass is becoming the great interest all over the world.
Especially, gasification of municipal solid waste (MSW) has been well-researched and developed in Japan. The development of MSW gasification technology was started in the 1970s in Japan because of oil crisis. Several technologies have been researched and developed. The direct melting system (DMS), which is the gasification and melting technology developed by Nippon Steel & Sumikin Engineering Co., Ltd., is one of the developed waste gasification technologies in this era. This technology was introduced for commercial use in Kamaishi City, Japan in 1979. This waste gasification technology with direct melting is a shaft-furnace type gasification and melting process and is clas- sified as an atmospheric fixed bed gasifier. The gasification technology is in commercial operation at more than 46 plants in Japan and South Korea [4, 5, 7, 9]. Nowadays, this is also used for Tsunami waste and radio-active waste to reducing the final landfill amount.
As well as this proven waste gasification technology, other gasification technologies have been developed for commercial use and installed in 1970’s. Andco-Torrax sys- tem and Purox system were also employed as a gasification and melting technology for MSW. They were introduced in Hamamatsu City in 1980, and in Chichibu City in 1981, respectively. Dual fluidized bed gasifiers, was introduced in Funabashi City in 1979. At that time, almost the all gasification technologies have faced to operational difficulties and went out from the commercial market. Today, no waste gasification technology except the DMS, which has been developed in 1970’s is still in the market.
One of the reasons why this gasification technology is still in the market is their con- tinuous R&D activities for its improvement and optimization. Compared with the operation conditions in 1980’s, operation conditions have been improved dramatically.
Especially, R&D activities for two technical issues were well managed in these three decades. Firstly, waste flexibility has been improved. Their continuous R&D activities can expand their capabilities to treat various kind of waste together. Nowadays, this waste gasification technology can process not only MSW or RDF, but also other waste which cannot be treated easily, such as sewage sludge, incineration bottom ash (IBA), automobile shredder residues (ASR), landfill reclamation waste, and clinical waste etc.
using its high temperature atmosphere in the gasifier. Secondly, utility consumptions, especially coke consumption, have been dramatically reduced compared with the
Pyrolysis/Gasification
operation in 1980’s. In 1990’s and 2000’s, several development have been achieved and been installed to this waste gasification system. Multiple tuyere system has improved the gasification reactions in the gasifier, and developed cyclone system has reduced not only coke consumption but also air pollution control (APC) residues. In addition, thanks to the development of air pre-heating technology [8], the coke consumptions were reduced down to approximately two percent from more than ten percent in 1980’s.
These R&D activities have made this waste gasification technology more robust and prove. Nowadays, in almost every year this gasification technology has continuously new references and is counted up to 46 references as of April 2017. The developed technologies via R&D activities are installed to the latest commercial plants to optimize its operating conditions.
In this study, we focused on two latest waste gasification plants which have different objectives and reported its operating conditions. Plant A processes MSW with higher operating hours and lower consumables in Japan. On the other hand, plant B is focused on its waste flexibility, processing not only MSW but also IBA, rejects from recycling center, and sewage sludge. There are many technical papers which introduce waste gasification technology overview, but a few papers which show its operation data and conditions in detail.
2. Materials and methods 2.1. Process description
A detailed description of the DMS has already been given previously [6, 7]. One of the advantages of this gasification technology is no pre-treatment of waste, which is different from other gasification technologies, such as fluidized bed gasifiers. As well as grate technology, waste is directly charged into the gasifier from the top with coke and limestone. In the gasifier, combustible waste is thermally decomposed and syngas is discharged from the top of the gasifier. The syngas, which mainly contains carbon monoxide, carbon dioxide, hydrogen, methane, hydrocarbons and nitrogen, is trans- ferred to the independent secondary combustion chamber in the downstream of the gasifier and then completely burned. Incombustibles descend to the combustion and melting zone (1,000 to 1,800 ºC) at the bottom and are melted with the heat genera- ted by coke burning. Molten materials are intermittently discharged from a tap hole, quenched with water and magnetically separated into slag and metal.
High temperature gasification has several advantages for the waste treatment and re- source recycling. Due to the high-temperature and reducing atmosphere generated at the bottom of the gasifier, toxic heavy metals are volatilized and few toxic heavy metals remain in molten materials, which can be widely recycled. Because of this, this waste gasification technology with melting function can maximize material recovery from waste without any further pre- and post-treatment such as drying, crashing or aging.
Secondary, This atmosphere is also effective for the waste flexibility. Due to the high- temperature in the gasifier, toxic waste and other waste which is difficult to be treated in the conventional systems can be destroyed and be recycled as resources.
Pyrolysis/Gasification
2.2. Plant description and feedstock property
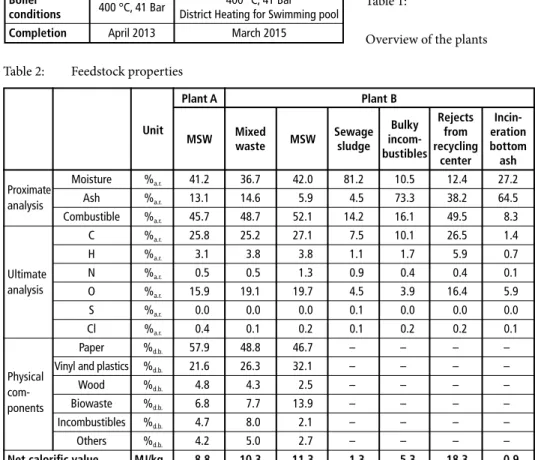
Table 1 shows the overview of the plants which conduct co-gasification of MSW with other wastes. In plant A, processing waste is only MSW and the capacity is 9.38 t/h. The completion of the plant was 2013. The capacity of plant B is 7.92 t/h and the completion was 2015. Plant B process four kinds of waste, which are MSW, sewage sludge, IBA and rejects from recycling center. As there is no IBA recycling facility, such as cement fac- tories, in the long term nearby and strong interest in minimizing final landfill amount, plant B processes IBA with MSW. Plant B also has a district heating system for swimming pool and public bath in the facility, contributing to local society. A combustible dust collection and injection system is also applied in both the plants [4, 7].
Plant A Plant B Capacity 9.38 t/h, 2 lines 7.92 t/h, 2 lines Processing Municipal Municipal Solid Waste, Sewage Waste Solid Waste Sludge, Rejects from recycling Center, Incineration Bottom Ash Boiler
400 °C, 41 Bar 400 °C, 41 Bar conditions District Heating for Swimming pool Completion April 2013 March 2015
Table 1:
Overview of the plants Table 2: Feedstock properties
Plant A Plant B
Bulky Rejects Incin-
Unit MSW Mixed
MSW Sewage
incom- from eration waste sludge bustibles recycling bottom
center ash
Proximate Moisture %a.r. 41.2 36.7 42.0 81.2 10.5 12.4 27.2 analysis Ash %a.r. 13.1 14.6 5.9 4.5 73.3 38.2 64.5 Combustible %a.r. 45.7 48.7 52.1 14.2 16.1 49.5 8.3 C %a.r. 25.8 25.2 27.1 7.5 10.1 26.5 1.4 H %a.r. 3.1 3.8 3.8 1.1 1.7 5.9 0.7 Ultimate N %a.r. 0.5 0.5 1.3 0.9 0.4 0.4 0.1 analysis O %a.r. 15.9 19.1 19.7 4.5 3.9 16.4 5.9 S %a.r. 0.0 0.0 0.0 0.1 0.0 0.0 0.0 Cl %a.r. 0.4 0.1 0.2 0.1 0.2 0.2 0.1 Paper %d.b. 57.9 48.8 46.7 – – – – Physical Vinyl and plastics %d.b. 21.6 26.3 32.1 – – – – com- Wood %d.b. 4.8 4.3 2.5 – – – – ponents Biowaste %d.b. 6.8 7.7 13.9 – – – – Incombustibles %d.b. 4.7 8.0 2.1 – – – – Others %d.b. 4.2 5.0 2.7 – – – – Net calorific value MJ/kga.r. 8.8 10.3 11.3 1.3 5.3 18.3 0.9
Feedstock properties are shown in Table 2. In plant B, mixed waste is sampled in waste bunker after mixture of MSW with other waste. IBA and bulky incombustibles processed in plant B contain high ash contents of 64.5 %a.r. and 73.3 %a.r.. Rejects from recycling
Pyrolysis/Gasification
center also contains higher ash and combustibles, compared with MSW to be processed in plant B. However, as the inert contents of MSW in plant B is significantly low (5.9 %), the inert contents of mixed waste is almost the same amount of plant A. Incombustibles and others (fine particles) of mixed waste in plant B was higher than MSW of plant A and B, which was caused by the mixture of IBA or bulky incombustibles.
3. Results and discussion 3.1. Operational results
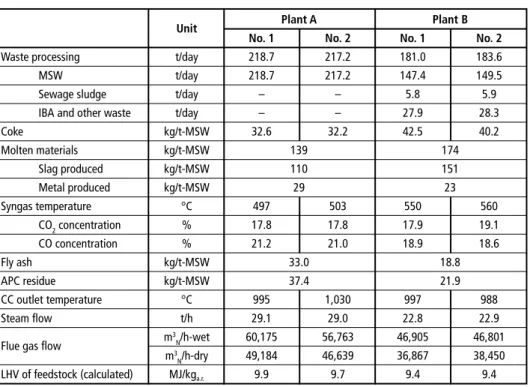
Table 3 shows the operation results of latest waste gasification plants. Both the plants process MSW and other waste stably. Plant A has almost the full-load operation with relatively lower coke consumption. The outlet temperatures of combustion chamber were 995 and 1,030 ºC, respectively, which were high enough for preventing PCDD/DFs regeneration in a boiler. Plant B is also operated stably with processing several kind of waste together. Mixing ratio of other waste, such as sewage sudge, IBA and rejects from recycling center, was 18.6 % in both lines. Because of this co-gasification, the amount of the molten materials discharged from the gasifier was 174 kg/t-waste, which was much higher than that in plant A. Other process data was similar to those of plant A.
Table 3: Operation results
Unit Plant A Plant B
No. 1 No. 2 No. 1 No. 2 Waste processing t/day 218.7 217.2 181.0 183.6 MSW t/day 218.7 217.2 147.4 149.5 Sewage sludge t/day – – 5.8 5.9 IBA and other waste t/day – – 27.9 28.3 Coke kg/t-MSW 32.6 32.2 42.5 40.2 Molten materials kg/t-MSW 139 174 Slag produced kg/t-MSW 110 151 Metal produced kg/t-MSW 29 23 Syngas temperature °C 497 503 550 560 CO2concentration % 17.8 17.8 17.9 19.1 CO concentration % 21.2 21.0 18.9 18.6 Fly ash kg/t-MSW 33.0 18.8 APC residue kg/t-MSW 37.4 21.9 CC outlet temperature °C 995 1,030 997 988 Steam flow t/h 29.1 29.0 22.8 22.9 Flue gas flow m3N/h-wet 60,175 56,763 46,905 46,801 m3N/h-dry 49,184 46,639 36,867 38,450 LHV of feedstock (calculated) MJ/kga.r. 9.9 9.7 9.4 9.4
Plan A: Average data between January and March 2014 Plan B: Average data between January and March 2017
Table 4 shows the emission data at stacks in plant A and B. Though Japanese regulation for emissions is different from that in Europe (Industrial Emission Directive – IED), all emissions are significantly low. HCl concentrations at stacks in plant A and B were
Pyrolysis/Gasification
9.1 and 6.0 mg/m3N, respectively, which were lower than the European regulation (10 mg/m3N) and much lower than the regulated valued of the plants. The concentra- tion of PCDD/DFs in plant A was 0.00023 ng-TEQ/m3N, which was significantly low.
It seems to be caused by higher combustion temperature in the combustion chamber.
Longer retention time with high temperature in the combustion chamber could affect the prevention of de novo synthesis in boiler.
Nowadays, the same as in Europe, mercury emissions are becoming of our interest in Japan because of Minamata Convention on Mercury [3], which was issued to protect the human health and the environment from anthropogenic emissions and releases of mercury and mercury compounds. As a domestic measure for this convention in Japan, Air Pollution Control Act will be revised and be coming into force on April 1, 2018. This Act is also applicable to waste to energy plants. The regulations for mercu- ry are 0.05 mg/m3N for existing plants and 0.03 mg/m3N for new plants (oxygen 12 % equivalent). Therefore, effective measures for mercury prevention from waste to energy plants will be also required in 2018 in Japan.
Both the plants have been already ready for this Minamata Convention on Mercury and Air Pollution Control Act revision. The mercury concentration in plant A was 0.038 mg/m3N without activated carbon injection, which was lower than that of Eu- ropean standard (0.05 mg/m3N) and Japanese new act. The mercury concentration in plant B was significantly low (less than 5.6 mg/m3N), which was caused by the activated carbon injection at flue gas cleaning system.
Plant A Plant B
Unit Regulation Measured Regulation Measured Dust mg/m3N 22 < 2.2 9 < 1.1 SO2 mg/m3N 63 < 1.3 63 4.0 HCl mg/m3N 36 9.1 45 6.0 NOX mg/m3N 114 60 91 52 Hg µg/m3N – 38 56 < 5.6 PCDD/DFs ng-TEQ/m3N 0.1 0.00023 0.01 0.0017 CO mg/m3N 42 6.9 35 9.0
Plant A: n = 11, PCDD/DFs n-4 Plant B: n = 6
Table 4:
Emissions values in plant A and plant B
3.2. Two years operation after completion in plant A
As explained in previous chapter, plant A focuses higher operating hours than other Japanese waste-to-energy (WtE) plant. In general, Japanese WtE plants are designed with 280 days operation basis in order to secure waste treatment. In other words, municipalities have responsibility to treat waste generated in their own area, but not bring waste from other municipalities to keep higher operating hours. This means that once the waste to be treated is reduced, the waste to energy plant is stopped, causing relatively lower operating hours of the plants than those in Europe. Therefore, the availability and operating hours is shorter than those of European plants, as they stop the plants when waste to be processed is shortage.
Pyrolysis/Gasification
Table 5 shows the operating data during two years after completion. In two years, both the lines have operated more than 7,200 hours per annum. Unexpected outages of line 1 and 2 in the first year were 184 and 168 hours per annum, respectively, which has been caused by initial technical problems. In the second year, the unexpected outages were reduced to be 34 and 42 hours per annum. In general, as the first two years does not require huge maintenance such as turbine generator, E&I system and boiler superheater exchange etc., the maintenance period is expected to be minimum (three weeks). From this point of view, the availabilities of this plant A were calculated to be more than 8,000 hours. In the second year, even if the maintenance takes four weeks, the availabilities were calculated to be more than 8,000 hours, which is similar to those of European incineration plants. These results indicates that this waste gasification technology have possibility to achieve European standard plant availability.
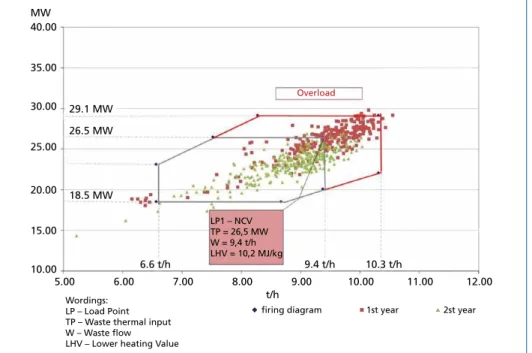
Figure 1 shows the firing diagram of plant A during first two years operation after completion. Plant A processed MSW with the range from 70 to 110 %. Due to the waste amount received in the plant A and other conditions such as annual waste management plan, the operating results was varied but was in the range of the firing diagram designed.
Unit 1st Year 2nd Year No. 1 No. 2 No. 1 No. 2 Operating hours hours 7,272 7,272 7,206 7,425 Unexpected outage hours 184 168 34 42 Maintenance (min. required) hours 504 504 504 504 Availability (calculated) hours 8,072 8,088 8,222 8,214
Table 5:
Operation results in two years after completion in plant A
5.00 40.00 MW
35.00
30.00
25.00
20.00
15.00
10.00
6.00 7.00 8.00
t/h
9.00 10.00 11.00 12.00
29.1 MW 26.5 MW
18.5 MW
6.6 t/h
LP1 – NCV TP = 26,5 MW W = 9,4 t/h LHV = 10,2 MJ/kg
Overload
Wordings:
LP – Load Point TP – Waste thermal input W – Waste flow LHV – Lower heating Value
firing diagram 1st year 2st year 9.4 t/h 10.3 t/h
Figure 1: Firing diagram of plant A during first two years operation
Pyrolysis/Gasification
In the first year, some date was not in the range of the firing diagram, which was caused by the intentional turn-down operation. This indicates that this waste gasification technology can be operated with approximately 65 % of NCR mechanical load.
3.3. Co-gasification for minimizing final landfill amount
Different from plant A, the objective of plant B is co-gasification of various kinds of waste and reduction of final landfill amount. IBA, reject from recycling center, and incombustibles, which generally landfilled, were also processed with MSW in this plant.
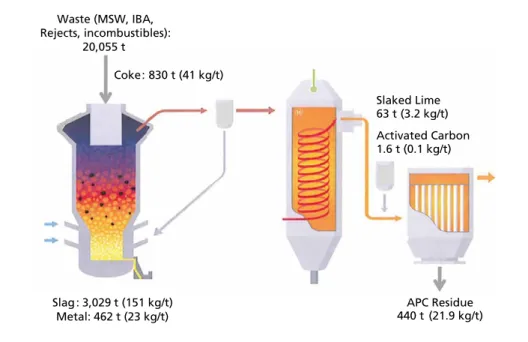
Figure 2 shows the material balance of plant B during three months of commercial operation. Waste processed in plant B was 20,055 t and 3,029 t of slag and 462 t of metal were produced and recycled completely. APC residue and fly ash amount were 21.9 and 18.8 kg/t-waste, respectively. Slaked lime consumption in flue gas cleaning system was only 3.2 kg/t-waste. This was caused by primary desulfurization reaction with limestone injection in the gasifier. As the limestone, which is used for adjusting fluidity of molten materials in the gasifier, reacts with HCl, the raw HCl concentration in the flue gas can be reduced much lower than that of conventional technologies.
Slaked Lime 63 t (3.2 kg/t) Activated Carbon 1.6 t (0.1 kg/t) Waste (MSW, IBA,
Rejects, incombustibles):
20,055 t
Coke: 830 t (41 kg/t)
Slag: 3,029 t (151 kg/t) Metal: 462 t (23 kg/t)
APC Residue 440 t (21.9 kg/t)
Figure 2: Material balance in plant B
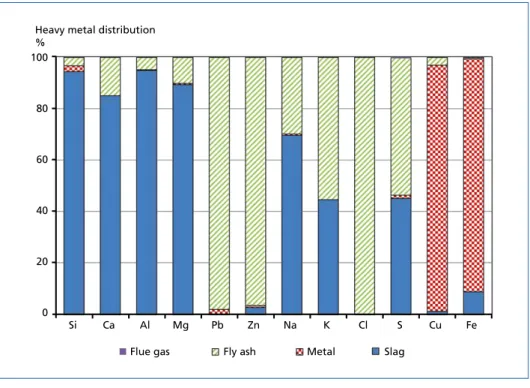
Our previous studies [6] reported the heavy metal distribution. In general, this waste gasification technology distributes more than 97 % of toxic heavy metals such as lead and zinc to APC residue. According to the European Commission [2], lead and zinc are distributed to APC residues with values of 28 % (± 5 %) and 54% (± 5 %), respectively.
On the other words, 72 % of lead and 46 % of zinc is distributed to bottom ash. Similar
Pyrolysis/Gasification
results were reported previously [1]. These results indicate that this waste gasification technology have possibility to recycle not only slag and metal which don’t contain any toxic heavy metals but also APC residues which highly contain lead and zinc for refinery.
Heavy metal distribution
% 100
80
60
40
20
0
Si Ca Al Mg Pb Zn Na K Cl S Cu Fe
Flue gas Fly ash Metal Slag
Figure 3: Heavy metal distribution
Source: Tanigaki, N.; Makishi, R.; Nagata, T.: Resource recovery from waste using its waste flexibility of waste gasification technology. In: Thomé-Kozmiensky, K. J.; Thiel, S. (Eds.): Waste Management, Volume 6. Neuruppin: TK Verlag Karl Thomé- Kozmiensky, 2016, pp. 457-468
The operating results mentioned above indicate that this waste gasification technology have wider waste flexibility than other gasification technologies, and can reduce the final landfill amount with recycling slag and metal produced. Not only MSW and RDF but also IBA, sewage sludge, rejects from recycling center and incombustibles which are generally landfilled can be processed together in this system. When APC residue which contains high concentration of lead and zinc can be recycled, this gasification technology has a possibility to achieve zero waste concept.
4. Conclusions
This paper reported a waste gasification technology with direct melting, which has the world largest gasification references and achieve the energy and material recovery simultaneously. Since 1979, this waste gasification technology has several R&D and has improved its operating conditions. Especially, in this study, operating results of two latest commercial waste gasification plants were reported.
Pyrolysis/Gasification
Both the plants have been operated stably. Plant A, which focused on higher operating hours, was operated more than 7,200 hours per annum in the first two years. As the unexpected outages were 184 and 168 hours in the first year, and 34 and 48 hours in the second year, the plant availability is calculated to be similar level of European standard (more than 8,000 hours). Plant B employed co-gasification system, processing not only municipal solid waste but also Incineration bottom ash, rejects from recycling center, sewage sludge and incombustibles, in order to minimize the final landfill amount and maximize the resource recovery from waste. Because of this co-gasification concept, rejects and incombustibles which were generally landfilled can be recycled as slag and metal produced from gasifier, minimizing final landfill amount. According to our previous study and co-gasification concept, this gasification system has possibilities to achieve the Zero Waste and Circular Economy recycling not only slag and metal containing no heavy metals but also air pollution control resides which heavy metals are highly concentrated, separately.
5. References
[1] Arena, U.; Di Gregorio, F.: Proceedings Venice 2012. At: Fourth international symposium on energy from biomass and waste, November 12-15, 2012, Padova, Eurowaste Srl.
[2] European Commission: Integrated Pollution Prevention and Control, Reference Document on the Best Available Techniques for Waste Incineration. August 2006
[3] http://www.mercuryconvention.org
[4] Manako, K.; Kashiwabara, T.; Kobata, H.; Osada, M.; Takeuti, S.; Mishima, T.: Proceedings of DIOXIN 2007 International Symposium. 2007, pp. 940-943
[5] Tanigaki, N.; Fujinaga, Y.; Kajiyama, H.; Ishida, Y.: Waste Management & Research 31, 11. 2013, pp. 1118-1124
[6] Tanigaki, N.; Makishi, R.; Nagata, T.: Resource recovery from waste using its waste flexibility of waste gasification technology. In: Thomé-Kozmiensky, K. J.; Thiel, S. (Eds.): Waste Management, Volume 6. Neuruppin: TK Verlag Karl Thomé-Kozmiensky, 2016, pp. 457-468
[7] Tanigaki, N.; Manako, K.; Osada, M.: Waste Management, 32. 2012, pp. 667-675
[8] Tanigaki, N.; Yoshimoto, Y.; Ishida, Y.; Osada, M.: Effects of Air Pre-heating for Combustible Dust Injection on Municipal Solid Waste Gasification and Melting System. At: 14th International Waste Management and Landfill Symposium, Sardinia 2013
[9] Osada, M.; Tanigaki, N.; Takahashi, S.; Sakai, S.: Journal of Material Cycles and Waste Manage- ment. 2008, pp. 93-101
Bibliografische Information der Deutschen Nationalbibliothek Die Deutsche Nationalbibliothek verzeichnet diese Publikation in der Deutschen Nationalbibliografie; detaillierte bibliografische Daten sind im Internet über http://dnb.dnb.de abrufbar
Thomé-Kozmiensky, K. J.; Thiel, S.; Thomé-Kozmiensky, E.;
Winter, F.; Juchelková, D. (Eds.): Waste Management, Volume 7 – Waste-to-Energy – ISBN 978-3-944310-37-4 TK Verlag Karl Thomé-Kozmiensky
Copyright: Elisabeth Thomé-Kozmiensky, M.Sc., Dr.-Ing. Stephanie Thiel All rights reserved
Publisher: TK Verlag Karl Thomé-Kozmiensky • Neuruppin 2017
Editorial office: Dr.-Ing. Stephanie Thiel, Elisabeth Thomé-Kozmiensky, M. Sc.
Janin Burbott-Seidel and Claudia Naumann-Deppe
Layout: Sandra Peters, Anne Kuhlo, Ginette Teske, Claudia Naumann-Deppe, Janin Burbott-Seidel, Gabi Spiegel and Cordula Müller
Printing: Universal Medien GmbH, Munich
This work is protected by copyright. The rights founded by this, particularly those of translation, reprinting, lecturing, extraction of illustrations and tables, broadcasting, micro- filming or reproduction by other means and storing in a retrieval system, remain reserved, even for exploitation only of excerpts. Reproduction of this work or of part of this work, also in individual cases, is only permissible within the limits of the legal provisions of the copyright law of the Federal Republic of Germany from 9 September 1965 in the currently valid revision. There is a fundamental duty to pay for this. Infringements are subject to the penal provisions of the copyright law.
The repeating of commonly used names, trade names, goods descriptions etc. in this work does not permit, even without specific mention, the assumption that such names are to be considered free under the terms of the law concerning goods descriptions and trade mark protection and can thus be used by anyone.
Should reference be made in this work, directly or indirectly, to laws, regulations or guide- lines, e.g. DIN, VDI, VDE, VGB, or these are quoted from, then the publisher cannot ac- cept any guarantee for correctness, completeness or currency. It is recommended to refer to the complete regulations or guidelines in their currently valid versions if required for ones own work.