ATLAS-CONF-2012-055 04/06/2012
ATLAS NOTE
ATLAS-CONF-2012-055
June 4, 2012
Measurement of the Λ
0b
lifetime and mass in the ATLAS experiment
The ATLAS Collaboration
Abstract
A measurement of the
Λ0blifetime and mass in the decay channel
Λ0b→ J/ψ(µ+µ−)
Λ0(p
+π−) is presented here. The analysis uses a signal sample of about 2200
Λ0band ¯
Λ0bdecays that are reconstructed in 4.9 fb
−1of ATLAS data collected in 2011 at the LHC centre-of-mass energy of 7 TeV. A simultaneous mass and decay time maximum likelihood fit is used to extract the
Λ0blifetime and mass. They are measured to be
τΛb =1.449
±0.036(stat)
±0.017(syst) ps and
mΛb =5619.7
±0.7(stat)
±1.1(syst) MeV.
c Copyright 2012 CERN for the benefit of the ATLAS Collaboration.
Reproduction of this article or parts of it is allowed as specified in the CC-BY-3.0 license.
1 Introduction
The
Λ0bbaryon (and its charge conjugate ¯
Λ0b) is the lightest baryon containing a b (¯ b) quark. With a mass of about 5620 MeV [1, 2] it is not produced at B-factories, where the centre-of-mass collision energy is tuned to produce pairs of B mesons. Currently, hadron colliders are the only facilities where the properties of b-baryons can be studied. This paper presents a measurement of the
Λ0bmass and lifetime in the ATLAS experiment [3] using the decay channel
Λ0b→J/ψ(µ
+µ
−)Λ
0( p
+π
−) (the charge conjugate mode is implied throughout the paper unless explicitly stated otherwise). The
Λ0blifetime, although measured by many experiments [4, 5, 6], still suffers from a large experimental uncertainty. The decay B
0d →J/ψ(µ
+µ
−)K
S0(π
+π
−) has a similar topology to the studied
Λ0bdecay. The B
0dmass and lifetime are measured with good precision [1], and therefore this decay provides a useful tool to validate the
Λ0bresults, as both measurements are subject to similar systematic uncertainties. The lifetime ratio, τ
Λb/τ
Bd, can be predicted by Heavy Quark E
ffective Theory (HQET) and perturbative QCD [7, 8] and is of great theoretical interest. The lifetime and mass are determined using a single unbinned maximum likelihood fit to the reconstructed mass and decay time of each selected candidate.
2 Data samples and trigger selection
The ATLAS experiment [3] is a general-purpose detector at the Large Hadron Collider (LHC) at CERN.
It covers nearly the entire solid angle around the interaction point with layers of tracking detectors, calorimeters, and muon chambers. This analysis uses two ATLAS sub-systems: the Inner Detector (ID) and the Muon Spectrometer (MS). Both are situated in a magnetic field and serve as tracking detectors.
The ID consists of three types of detector: the silicon pixel detector (Pixel), the silicon micro-strip detec- tor (SCT) and the transition radiation tracker (TRT). The MS consists of monitored drift tube chambers (MDT) and cathode strip chambers (CSC) for precision muon measurement, resistive plate chambers (RPC) and thin gap chambers (TGC) employed by the muon trigger system. Both the MS and ID have a pseudorapidity coverage of
|η
|< 2.5. Only ID tracks with p
Tabove 400 MeV are used in this analysis.
This analysis uses data collected in the year 2011 using single-muon, di-muon, and J/ψ triggers. The ATLAS trigger system [9] has 3 levels: the hardware-based Level-1 trigger and the two-stage High Level Trigger (HLT). At Level-1 the muon trigger uses dedicated fast muon trigger chambers searching for patterns of hits corresponding to muons passing different p
Tthresholds. Regions of interest (RoI) around these Level-1 hit patterns then serve as seeds for the HLT muon reconstruction. Since the rate from the low-p
Tmuon triggers was too high for all accepted events to be saved, prescale factors were applied to reduce the output rate. The transverse momentum thresholds for single and di-muon triggers vary from 4 GeV to 22 GeV. The J/ψ triggers are di-muon triggers which in addition require that the muons have an opposite charge and the di-muon mass is 2.5 GeV < m
µµ< 4.3 GeV. The majority of the sample was collected by the J/ψ trigger with a p
Tthreshold of 4 GeV applied to both muons, which was the lowest p
T-threshold trigger unprescaled in the 2011 data taking. The combined triggers selected muons with p
Tabove 2.5 GeV and the muon p
Tspectrum peaks at 5 GeV.
A Monte Carlo (MC) sample of 5 million anti-baryon ¯
Λ0bevents is used to study systematic effects and to correct for the efficiency and acceptance of the detector. The sample is generated using the Pythia MC generator [10] and the events are filtered so that there is a decay ¯
Λ0b →J/ψ(µ
+µ
−) ¯
Λ0( p
−π
+) in each event with the muons having transverse momenta of at least 2.5 GeV. The MC sample is generated with a
Λ0blifetime of τ
MCΛb =
1.391 ps.
3 Reconstruction and signal selection
3.1 J/ψ and V
0Pre-selection
The decay
Λ0b →J/ψ(µ
+µ
−)Λ
0( p
+π
−) has a cascade topology, as the J/ψ decays instantly at the same point as the
Λ0b(secondary vertex) while
Λ0lives long enough to form a displaced tertiary vertex. There are four final state particles: two J/ψ muons, a proton, and a pion from the
Λ0decay.
The di-muon and di-hadron pairs are pre-selected by requiring that their tracks can be successfully fitted to a common vertex [11] satisfying some basic quality requirements. The J/ψ and V
0pre-selection is very loose, so that potential candidates are not excluded at this stage. The di-muon candidates are accepted if the J/ψ vertex-refitted invariant mass lies in the range 2.8 GeV < m
µµ< 3.4 GeV. The di-hadron candidates are accepted if the invariant mass is in the range 1.08 GeV < m
pπ< 1.15 GeV. The masses of a proton and a pion are assigned to the tracks when the invariant mass is calculated; pπ
−and
¯
pπ
+combinations are tested so that both
Λ0and ¯
Λ0candidates are accepted.
3.2 Reconstruction of Λ
0b
→ J/ψ(µ
+µ
−) Λ
0(p
+π
−)
The muon and hadronic track pairs pre-selected with the criteria described in the previous section are then refitted with a constraint of a
Λ0b →J/ψ(µ
+µ
−)Λ
0( p
+π
−) topology. The muons are constrained to intersect in a single vertex while their invariant mass must be equal to the known mass of the J/ψ, m
J/ψ =3096.92 MeV [1]. The two hadronic tracks are constrained to a second vertex and their invari- ant mass is fixed to the mass of the
Λ0, m
Λ0 =1115.68 MeV [1]. The combined momentum of the refitted V
0track pair is constrained to point to the di-muon vertex in 3-d. Two mass hypotheses are considered: the first assigning a proton mass to the positive track and a pion mass to the negative track and the second hypothesis with the opposite mass assignment. These hypotheses correspond to
Λ0band
Λ¯
0bdecays, respectively. The fit is performed on all four tracks simultaneously taking into account the constraints described above (cascade topology fit) and the full track error matrices. The quality of the fit is characterized by the value of χ
2/N
dof, where a global χ
2involving all four tracks is used. The corresponding number of degrees of freedom, N
dof, is 6. Furthermore, for each track quadruplet, that can be successfully fitted to the
Λ0bdecay topology, a B
0d →J/ψ(µ
+µ
−)K
S0(π
+π
−) topology fit is attempted (i.e. a pion mass is assigned to the hadronic tracks and the V
0mass is constrained to the mass of K
S0, m
KS =497.65 MeV [1]). This is to label possible B
0ddecays misidentified as
Λ0b.
The
Λ0bcandidates are then subjected to the following selection:
•
The global χ
2/N
dof< 3.
•
The transverse momentum of the cascade-refitted V
0, p
T,V0> 3.5 GeV.
•
The transverse decay length of the cascade-refitted V
0vertex measured from the
Λ0bvertex, L
xy,V0>
10 mm.
•
The invariant mass must be in the range 5.38 GeV < m
J/ψΛ0< 5.90 GeV.
•
If the four tracks forming a
Λ0bcandidate also result in an acceptable B
0dfit, the candidate must have a difference of cumulative χ
2probabilities of the two fits,
PΛ0b− PBd
> 0.05.
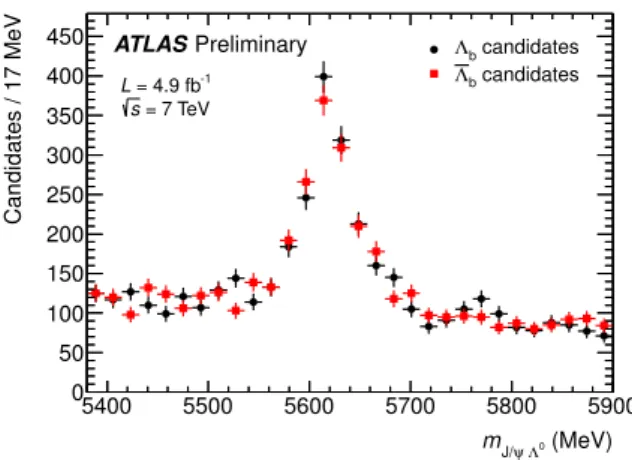
With these criteria, 4074
Λ0band 4081 ¯
Λ0bcandidates (including background) are selected. No track
quadruplet is successfully fitted as both a
Λ0band a ¯
Λ0bdecay. The mass distributions of the selected
candidates are shown in Figure 1. In the rest of the paper the
Λ0band ¯
Λ0bsamples are combined.
(MeV)
Λ0 ψ
mJ/
5400 5500 5600 5700 5800 5900
Candidates / 17 MeV
0 50 100 150 200 250 300 350 400
450 Λb candidates
candidates Λb
ATLASPreliminary = 4.9 fb-1
L = 7 TeV s
Figure 1: Invariant mass distribution of the selected
Λ0band ¯
Λ0bcandidates.
4 Mass and proper decay time fit
The proper decay time of the
Λ0bcandidate is calculated from the measured decay distance and the candidate’s momentum as follows:
τ
=L
xym
PDGp
T,
where m
PDG =5620.2 MeV [1], p
Tis the reconstructed
Λ0btransverse momentum, and L
xyis the
Λ0btransverse decay distance measured from the primary vertex (PV). On average there are 6.8 collision vertices per event in the selected data resulting from multiple collisions at each LHC bunch crossing (pileup events). The collision vertex that in 3-d space lies closest to the trajectory of the reconstructed
Λ0bcandidate is used as the PV.
An unbinned maximum likelihood fit is used to determine the
Λ0bmass and lifetime. The back- ground can be divided into two main categories: prompt and non-prompt background. The prompt background consists of J/ψ candidates produced directly in the pp collision that are randomly combined with V
0candidates, this also includes fake combinatorial
Λ0or K
S0candidates. This background does not have a lifetime and the measured decay length is caused only by the resolution of the vertex recon- struction. The non-prompt background includes events where the J/ψ candidate originates in a decay of a b-hadron. This type of background has a lifetime due to its origin in long-lived b-hadrons (e.g.
B
0d→J/ψ ( µ
+µ
−)K
S0( π
+π
−), with the K
S0meson misidentified as
Λ0, forms a non-prompt background for
Λ0b).
The mass and proper decay time are fitted using a likelihood function defined as follows:
L
=N
Y
i=1
h
f
sigMs(m
i|δ
mi)
Ts( τ
i|δ
τi) w
s( δ
mi, δ
τi)
+(1
−f
sig)
Mb(m
i|δ
mi)
Tb( τ
i|δ
τi) w
b( δ
mi, δ
τi)
i, where f
sigdenotes the fraction of signal candidates; m
iis the invariant mass of the i-th candidate and τ
iis its proper decay time. The corresponding errors, δ
miand δ
τi, are estimated on a candidate-by-candidate basis by the cascade topology fit.
Msand
Mbare probability density functions (PDFs) describing the signal and background mass dependence;
Tsand
Tbdescribe the dependence on the proper decay time.
The invariant mass and proper decay time error distributions, w
s(b)(δ
m, δ
τ)
=w
′s(b)(δ
m)w
′′s(b)(δ
τ), are ex-
tracted from data. It has been verified that using separate PDFs for the signal and background component
produces the same results as when a single PDF is used, w
≡w
s =w
b. For this reason the latter case is
used.
’ (ps) τ
0 1 2 3 4 5 6
Efficiency
0.018 0.02 0.022 0.024 0.026 0.028
56 ps = 113 ±
Λb
c ATLASPreliminary Simulation
= 7 TeV s
Λb
c τ’ -
’) ~ e (τ ε
Figure 2: Extraction of the efficiency correction for
Λ0b. The MC data are fitted with an exponential function. The y -axis has a suppressed zero.
The signal component of the mass PDF,
Ms, is a Gaussian function with a mean equal to m
Λband width S
mδ
m. The mass error scale factor, S
m, determines how much the errors δ
miare over or under- estimated. The background component is a first order polynomial with a slope b.
Since the proper decay time of each candidate is reconstructed with a certain error, the proper decay time resolution is modeled with a Gaussian function:
R( τ
−τ
′|δ
τ)
=1
√
2πS
τδ
τe
−(τ−τ′)2
2(Sτδτ)2
, (1)
where S
τdenotes the proper decay time error scale factor, τ and τ
′stand for the reconstructed and true proper decay time, respectively.
The signal and non-prompt background proper decay time distributions are modeled as exponential functions, E(τ
′; τ
B), for τ
′> 0; with τ
Bbeing the fitted parameter denoting either the
Λ0blifetime, or the pseudo-lifetime of the long-lived background. The prompt background component is modeled by a sum of two functions: a Dirac δ-function, δ
Dirac(τ
′), and a symmetric exponential (Laplace distribution), E
sym(τ
′), to account for the non-Gaussian tails of the prompt background observed in data.
The functions are convolved with the resolution model (1) to obtain the PDFs of the measured proper decay time:
Ts
(τ
|δ
τ)
=ε(τ
′)
−1E(τ
′; τ
Λb)
⊗R(τ
−τ
′|δ
τ), (2)
Tb(τ
|δ
τ)
= hf
1Tp(τ
′)
+(1
−f
1)
Tnp(τ
′)
i⊗
R(τ
−τ
′|δ
τ), with the non-prompt and prompt components defined as
Tnp
(τ
′)
=f
2E(τ
′; τ
bkg,1)
+(1
−f
2)E(τ
′; τ
bkg,2),
Tp( τ
′)
=f
3δ
Dirac( τ
′)
+(1
−f
3)E
sym( τ
′; τ
bkg,3) .
The efficiency correction function, ε(τ
′), in equation (2) accounts for the decay-time-dependent selection bias.
Two sources are responsible for the selection bias of the
Λ0bdecay time: the V
0reconstruction effi- ciency and the trigger selection. The V
0reconstruction efficiency depends on the decay distance from the centre of the detector as tracks from decays further away from the centre leave fewer hits in the ID.
Since the
Λ0bdecay length and the distance of the
Λ0vertex from the centre of the detector are correlated
(the latter includes the former), this biases the measured proper decay time toward smaller values. The other source of the bias is the muon trigger, which affects the distribution of the muon transverse impact parameter, d
0. Using the tag-and-probe method for J/ψ, the trigger efficiency as a function of d
0is mea- sured for a single-muon trigger in data. The simulation shows that the di-muon trigger efficiency can be expressed as a product of single muon efficiencies. The MC data are re-weighted to make sure that the observed trigger bias is well modelled in the MC. The efficiency correction, ε(τ
′), is determined using this weighted MC sample. It is modelled as a simple exponential, ε(τ
′)
∝e
−τ′/cΛb, where c denotes the slope of the efficiency correction. The exponential form is chosen for ε(τ
′) because it describes the MC data well and is particularly easy to convolve with the resolution model. The slope of the exponential, c
Λb, is extracted by a fit to the MC decay time efficiency plot shown in Figure 2. The extracted value is c
Λb =113
±56 ps, i.e. for the decay time of 6 ps the efficiency decreases by 5%.
4.1 Parameters determined from the fit The full PDF has 12 free parameters:
•
the
Λ0bmass and lifetime, m
Λband τ
Λb;
•
the fraction of signal events, f
sig;
•
the error scale factors, S
mand S
τ;
•
the slope of the mass dependence of the background, b;
•
the pseudo lifetimes of the long-lived background, τ
bkg,1and τ
bkg,2; the slope of the non-Gaussian prompt background, τ
bkg,3; and
•
the relative fractions of the various background contributions, f
1, f
2, and f
3.
Some other quantities are calculated from the fit parameters. The number of signal and background candidates, N
sigand N
bkg, are calculated as N
sig =f
sigN and N
bkg =(1
−f
sig)N. The mass and proper decay time resolutions are calculated from the fit parameters, too. In an analogy with a Gaussian distri- bution, the mass resolution, σ
m, is defined as half of that mass range for which the integral of
Msretains 68.3% of the number of signal events symetrically around the fitted
Λ0bmass. The proper decay time resolution is determined in the same fashion by integrating the prompt background PDF.
5 Extraction of the Λ
0b
mass and lifetime
5.1 Results of the maximum likelihood fit
The results of the maximum likelihood fit are listed in Table 1. The table shows only the most important fitted parameters, calculated parameters, and a χ
2/N
dofvalue which quantifies the fit quality. The χ
2/N
dofvalue is calculated from the dataset binned in mass and decay time with 61 degrees of freedom. The size of the bins corresponds to the measured mass and decay time resolutions and only bins with more than 11 entries are used for the χ
2calculation. This is to ensure that the error on the number of entries in each bin can be taken as Gaussian. The lifetime result is corrected for the selection bias (see Section 4); the size of the correction is
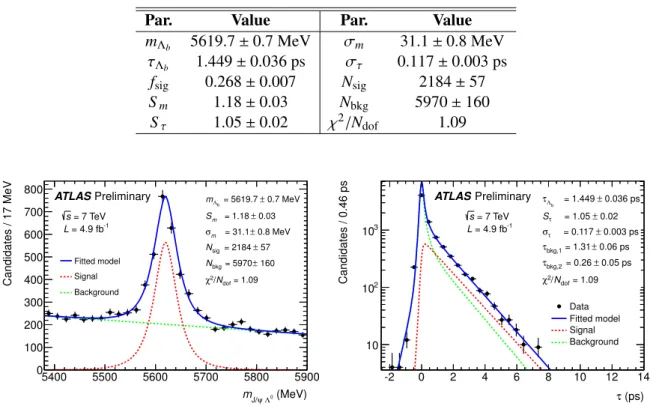
+19 fs. The estimated correlation between the mass and lifetime is small, 0.002.Projections of the PDF onto the mass and decay time axes are shown in Figure 3.
Table 1: Results of the simultaneous mass and decay time maximum likelihood fit for
Λ0b. The uncertain- ties shown are statistical only. The number of degrees of freedom used for χ
2calculation is N
dof=61.
Par. Value Par. Value
m
Λb5619.7
±0.7 MeV σ
m31.1
±0.8 MeV τ
Λb1.449
±0.036 ps σ
τ0.117
±0.003 ps
f
sig0.268
±0.007 N
sig2184
±57 S
m1.18
±0.03 N
bkg5970
±160 S
τ1.05
±0.02 χ
2/N
dof1.09
(MeV)
Λ0 ψ
mJ/
5400 5500 5600 5700 5800 5900
Candidates / 17 MeV
0 100 200 300 400 500 600 700
800 = 5619.7 ± 0.7 MeV
Λb
m
0.03 = 1.18 ± Sm
0.8 MeV
± = 31.1 σm
± 57 = 2184 Nsig
± 160 = 5970 Nbkg
= 1.09 Ndof 2/ χ = 7 TeV
s = 4.9 fb-1
L
Fitted model Signal Background
ATLASPreliminary
(ps) τ
-2 0 2 4 6 8 10 12 14
Candidates / 0.46 ps
10 102
103
0.036 ps = 1.449 ±
Λb
τ
0.02 = 1.05 ± Sτ
0.003 ps = 0.117 ± στ
0.06 ps = 1.31 ±
bkg,1
τ
0.05 ps = 0.26 ±
bkg,2
τ
= 1.09 Ndof 2/ χ = 7 TeV s
= 4.9 fb-1
L
Data Fitted model Signal Background ATLASPreliminary
Figure 3: Projections of the fitted PDF onto the mass (left) and the proper decay time (right) axes for
Λ0bcandidates. The displayed errors are statistical only. The χ
2/N
dofvalue is calculated from the dataset binned in mass and decay time with the number of degrees of freedom N
dof =61.
5.2 Systematic errors
Systematic errors are estimated by changing various parameters of the analysis and observing the shift in the extracted mass and lifetime. The shift with respect to the baseline result is then quoted as a systematic error. The non-negligible systematic errors are summarized in Table 2. The individual errors are added in quadrature, obtaining a total systematic error of the lifetime and mass measurements, σ
systτ =17 fs and σ
systm =1 . 1 MeV, respectively. Details on the systematic error determination follow:
Event selection and reconstruction bias
Two effects that lead to a selection bias of the
Λ0bas a function of decay time have been identified: the dominant contribution comes from the muon trigger, which slightly biases the transverse impact parameter of muons, d
0, toward smaller values. The second bias comes from the V
0reconstruction. The event selection bias is corrected using the MC by determining the efficiency as a function of the decay time as described in Section 4. The slope of the efficiency correction function, c
Λb, is determined with a statistical error of 56 ps. Using standard error propagation, the contribution of this uncertainty to the overall error is evaluated to be 9 fs.
Since the bias correction relies on MC simulation, an additional systematic uncertainty due to the
correction is estimated. This error is determined separately for the V
0reconstruction bias and for
the trigger bias. In the MC the bias correction accounts for a
Λ0blifetime shift of 26 fs, of which
10 fs is due to the V
0reconstruction and 16 fs is due to the trigger requirement. The systematic
error due to the V
0bias correction is estimated by varying the
Λ0btransverse momentum in the MC to probe the p
Tdependence of the correction. The magnitude of the variation is about three times the difference between the mean p
Tin data and MC. The corresponding error is estimated to be 4 fs. To ensure a good description of the trigger bias, the MC sample is re-weighted using the single-muon trigger efficiencies expressed as a function of muon d
0, that are extracted from data.
The weighting functions are parametrized as linear functions, w(d
0)
∝1
+ad
0, and their slope, a, is determined in bins of muon p
Tand η with a certain precision. To assess the systematic error on the trigger bias correction, the weighting parameters a are varied by their errors. This produces a lifetime shift of 7 fs, which is used as a systematic error. The total systematic error calculated as a quadratic sum of the individual contributions is 12 fs.
To assess the systematic error of the event selection on the mass measurement, the MC distribution of
∆m =m
MC−m, where m
MCstands for the generated mass, is fitted with a double Gaussian.
The systematic error, given by the shift of the mean of the double Gaussian, is estimated to be 0.9 MeV. The mass shift is caused by the muon trigger p
Tthresholds: muons with larger p
Thave better probability of being selected than low-p
Tmuons, which creates a small asymmetry of the mass peak.
Background fit models
Alternative background models are tried to assess the sensitivity of the result to the choice of background parametrization. A second-order polynomial and an exponential de- pendence of the
MbPDF are tested. The decay time dependence is modified by adding a third exponential into the non-prompt background component,
Tnp. The alternative background PDFs fit the data well. These changes result in a lifetime shift of 2 fs and a mass shift of 0.2 MeV. In the fit model the decay time and mass are assumed to be uncorrelated. To test this assumption the fit mass range limits, m
minand m
max, are varied independently by 60 MeV, which changes the relative contribution of the background from the left and right sidebands, and the mass and lifetime are extracted again for these new mass ranges. While the change of m
maxhas a minimal impact on the extracted mass and lifetime, the change of m
minproduces a lifetime shift of 9 fs. This value is added to the total systematic error due to background modelling.
B0
dcontamination
The number of B
0dcandidates misidentified as
Λ0bis estimated by a fit to the mass distribution of the candidates which fall in the
Λ0bsignal region, 5.52 GeV < m
J/ψΛ0< 5.72 GeV, under the hypothesis that they are B
0d →J/ψ(µ
+µ
−)K
S0(π
+π
−) decays. A fit to a Gaussian on a linear background yields 82
±46 B
0dcandidates. Since these candidates are treated as
Λ0b, their pseudo-lifetime is scaled-up by the ratio between the
Λ0band B
0dmasses, τ
∗Bd =
τ
Bdm
Λb/m
Bd =1617 fs (the decay time change due to the di
fference in p
Treconstructed under the two hypotheses is negligible). If all such background candidates contributed to the fitted
Λ0blifetime, it would cause a shift of 7 fs. This is quoted as a conservative estimate of the systematic error. The error on the mass measurement is estimated by relaxing the
PΛ0b − PBd
cut to double the estimated B
0dbackground. This results in a
Λ0bmass shift of 0.2 MeV.
Residual misalignment of the ID
The distribution of the transverse impact parameter, d
0, of tracks originating from the PV is used to estimate the geometrical distortions due to residual misalign- ment. The geometry in the MC simulation is distorted by adjusting the positions of the ID modules so that the d
0of tracks coming from the PV is biased by the same amount as observed in data. The mass-lifetime fit is performed on MC data using the default (ideal) geometry and the sample with geometry distortions. A shift of 1 fs is observed between the two measurements and is assigned as a systematic error due to residual misalignment. No significant mass shift is observed.
Uncertainty in the amount of ID material
Inaccurate modeling of the amount of material in the ID
could affect the measurement since the tracking algorithm estimates the particle energy loss using
Table 2: Summary of the systematic errors of the lifetime measurement, σ
systτ, and the mass measurement, σ
systm, for
Λ0b.
Systematic error σsystτ (fs)
σ
systm (MeV)Selection/reco. bias 12 0.9
Background fit models 9 0.2
B
0dcontamination 7 0.2
Residual misalignment 1 -
Extra material 3 0.2
Tracking p
Tscale - 0.5
Total systematic error 17 1.1
a material map. To explore this uncertainty, the MC simulation is made assuming 20% of extra material in the ID silicon detectors (Pixel and SCT) and their supporting services, which is large compared to the estimated uncertainty of 6% in Pixel and 9% in the SCT detectors (see Ref. [12]).
The resulting shifts of 3 fs in lifetime and 0.2 MeV in mass are conservative estimates of the systematic uncertainties from this source.
Uncertainty of the tracking momentum scale
The K
S0mass value is used to estimate the uncertainty of the track momentum determination. The K
0Smass extracted from a fit to the invariant mass agrees with the PDG world average within 0.03%. Such a shift corresponds to a track momentum scale shift of 0.05%. The momentum scale can be further tested using the reconstructed J/ψ mass.
The observed mass shift corresponds to a momentum scale error of -0.03%, in agreement with the assumption of
±0.05%. In the MC the momenta of all tracks are shifted by this amount, which yields a
Λ0bmass shift of 0.5 MeV. No significant lifetime shift is observed.
Other systematics
Other sources of systematic errors are investigated, such as an alternative choice of the PV (e.g. using the collision vertex with the largest sum of tracks’ p
2T) and a different modeling of the decay time error distributions. These changes do not result in a significant mass or lifetime shift.
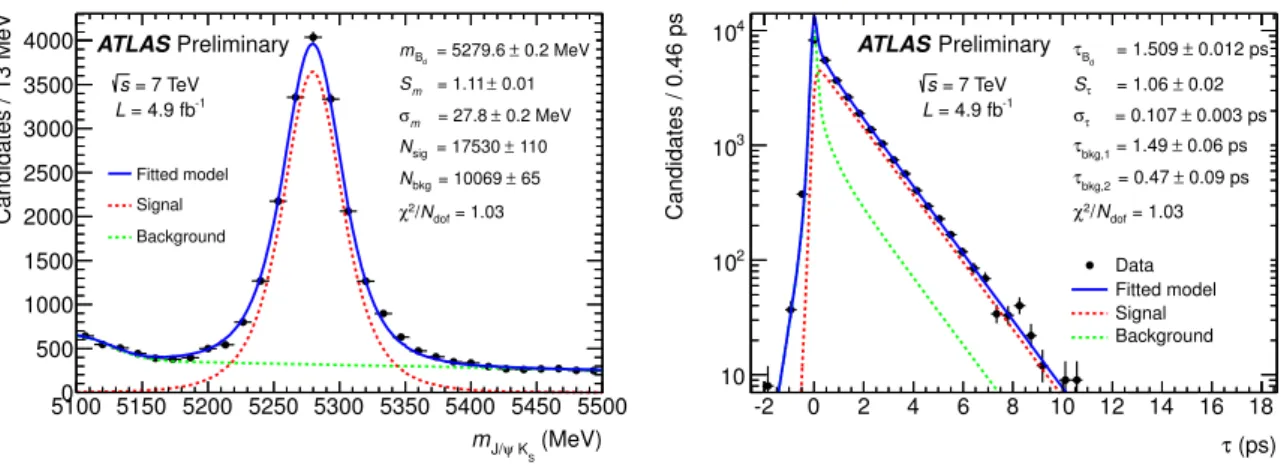
5.3 Cross-check with B
0d
→ J/ψ(µ
+µ
−)K
0S
(π
+π
−)
The B
0d →J/ψ(µ
+µ
−)K
S0(π
+π
−) channel has a similar decay topology as
Λ0b →J/ψ(µ
+µ
−)
Λ0( p
+π
−) and can be used to cross-check the
Λ0bresults and to determine the ratio of the
Λ0band B
0dlifetimes.
The analysis and systematic studies, described in the previous sections, are repeated for B
0d. The B
0dchannel is subjected to exactly the same kinematic cuts as for the
Λ0bchannel, and therefore has similar systematic effects. The mass range used for the K
S0preselection is 440 MeV < m
π+π−< 570 MeV, the B
0dinvariant mass must lie in the range 5.1 GeV < m
J/ψK0S
< 5.5 GeV. Using the
Λ0bkinematic cuts results in a B
0dsignal yield, which is much smaller than can be achieved with a B
0d-optimized selection. Using the maximum likelihood fit, the B
0dlifetime and mass are measured to be τ
Bd =1.509
±0.012(stat)
±0.018(syst) ps and m
Bd =5279.6
±0.2(stat)
±1.0(syst) MeV. These values are consistent with the world averages, τ
PDGBd =
1.519
±0.007 ps and m
PDGBd =
5279.50
±0.30 MeV [1].
6 Results and conclusions
The
Λ0blifetime and mass are measured to be
τ
Λb =1.449
±0.036(stat)
±0.017(syst) ps, m
Λb =5619.7
±0.7(stat)
±1.1(syst) MeV.
The presented results agree with the world average values of the
Λ0blifetime, τ
PDGΛb =
1.425
±0.032 ps and mass, m
PDGΛb =
5620.2
±1.6 MeV [1]. The estimated precision of the mass measurement is better than that of the world average and the result is consistent with a recent determination, m
LHCbΛb =
5619.19
±0.70(stat)
±0.30(syst) MeV [2], which is not included in the quoted world average value. The ratio of the
Λ0band B
0dlifetimes measured by ATLAS is
R
=τ
Λb/τ
Bd =0.960
±0.025(stat)
±0.016(syst).
The statistical and systematic errors are propagated from the errors of the lifetime measurements. The systematic errors are conservatively assumed to be uncorrelated. This value is close to the recent determination by DØ, R
DØ =0.864
±0.052(stat)
±0.033(syst) [6], and the measurement by CDF, R
CDF =1.020
±0.030(stat)
±0.008(syst) [5]. It is compatible with the theoretical predictions in Ref. [7], R
NLO1 =0.88
±0.05, and Ref. [8], R
NLO2 =0.86
±0.05.
References
[1] Particle Data Group Collaboration, K. Nakamura et al. J. Phys. G
37(2010) 075021 and 2011 partial update for the 2012 edition: http:
//pdglive.lbl.gov.
[2] LHCb Collaboration, R. Aaij et al., Measurement of b-hadron masses, Phys. Lett. B
708(2012) 241 – 248.
[3] ATLAS Collaboration, The ATLAS Experiment at the CERN Large Hadron Collider, JINST
3(2008) S08003.
[4] CDF Collaboration, T. Aaltonen et al., Measurement of the
Λ0bLifetime in
Λ0b →Λ+cπ
−Decays in pp Collisions at
√s
=1.96 TeV, Phys. Rev. Lett.
104(2010) 102002.
[5] CDF Collaboration, T. Aaltonen et al., Measurement of b hadron lifetimes in exclusive decays containing a J/psi in p-pbar collisions at sqrt(s)=1.96TeV , Phys.Rev.Lett.
106(2011) 121804.
[6] D0 Collaboration, V. M. Abazov et al., Measurement of the
Λ0blifetime in the exclusive decay
Λ0b→J/ψΛ
0in p p collisions at ¯
√s
=1.96 TeV,
arXiv:1204.2340 [hep-ex].[7] C. Tarantino, Beauty hadron lifetimes and B meson CP violation parameters from lattice QCD, Eur. Phys. J.
C33(2004) S895–S899.
[8] F. Gabbiani, A. I. Onishchenko, and A. A. Petrov, Spectator effects and lifetimes of heavy hadrons, Phys.Rev.
D70(2004) 094031.
[9] ATLAS Collaboration, Performance of the ATLAS Trigger System in 2010, Eur. Phys. J.
C72(2012) 1849.
[10] T. Sjostrand, S. Mrenna, and P. Z. Skands, PYTHIA 6.4 Physics and Manual, JHEP
05(2006) 026.
[11] ATLAS Collaboration, V. Kostyukhin, VKalVrt - package for vertex reconstruction in ATLAS, ATL-PHYS-2003-031, http://cdsweb.cern.ch/record/685551, 2003.
[12] ATLAS Collaboration, A study of the material in the ATLAS inner detector using secondary hadronic interactions, JINST
7(2012) P01013.
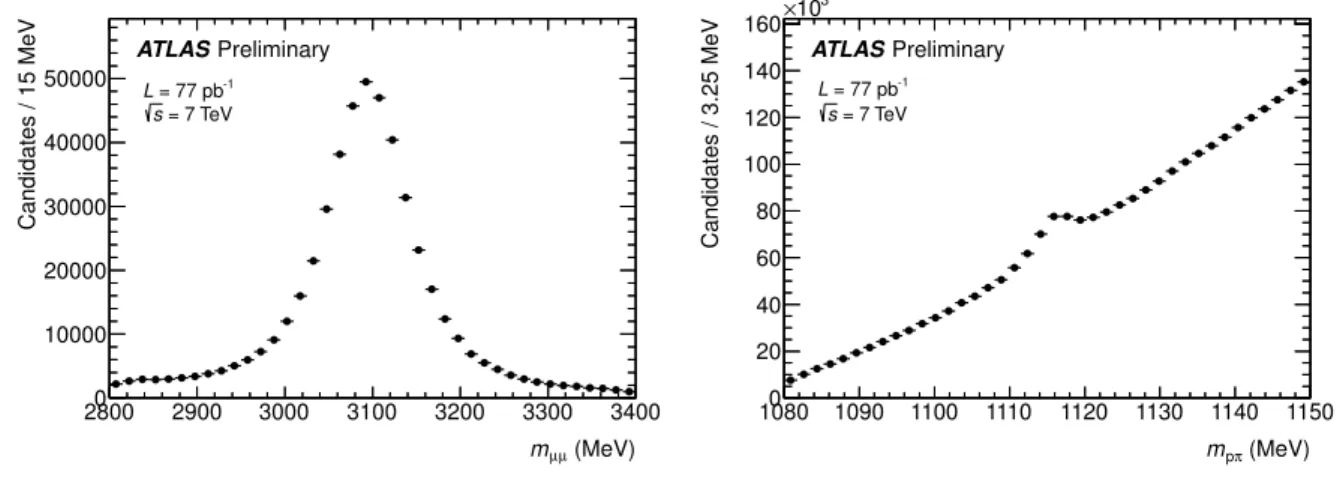
A Additional plots
The invariant masses of the pre-selected J/ψ and
Λ0candidates are shown in Figure 4. Figure 5 (right) shows the efficiency correction extraction for B
0d. The B
0dinvariant mass spectrum is shown in Figure 5 (left) and projections of the PDF fitted to the B
0ddata are shown in Figure 6.
(MeV)
µ
mµ
2800 2900 3000 3100 3200 3300 3400
Candidates / 15 MeV
0 10000 20000 30000 40000 50000
ATLASPreliminary = 77 pb-1
L = 7 TeV s
(MeV)
pπ
m
1080 1090 1100 1110 1120 1130 1140 1150
Candidates / 3.25 MeV
0 20 40 60 80 100 120 140 160
103
×
ATLASPreliminary = 77 pb-1
L = 7 TeV s
Figure 4: Invariant mass distribution of pre-selected J/ψ (left),
Λ0and ¯
Λ0(right) candidates. A single run of 77 pb
−1is used to make the plots.
(MeV)
KS ψ
mJ/
5100 5150 5200 5250 5300 5350 5400 5450 5500
Candidates / 13 MeV
0 500 1000 1500 2000 2500 3000 3500 4000 4500
= 4.9 fb-1
L = 7 TeV s
ATLASPreliminary
(ps) τtrue
0 1 2 3 4 5 6
Efficiency
0.03 0.035 0.04 0.045 0.05
43 ps = 94 ±
Bd
c ATLASPreliminary Simulation
= 7 TeV s
Bd
c τ’ -
’) ~ e (τ ε
Figure 5: Invariant mass distribution of the selected B
0dcandidates (left). Extraction of the efficiency
correction for B
0d(right). The y-axis has a suppressed zero.
(MeV)
KS ψ
mJ/
5100 5150 5200 5250 5300 5350 5400 5450 5500
Candidates / 13 MeV
0 500 1000 1500 2000 2500 3000 3500
4000 = 5279.6 ± 0.2 MeV
d
mB
0.01
± = 1.11 Sm
0.2 MeV
± = 27.8 σm
± 110 = 17530 Nsig
± 65 = 10069 Nbkg
= 1.03 Ndof 2/ χ = 7 TeV
s = 4.9 fb-1
L
Fitted model Signal Background
ATLASPreliminary
(ps) τ
-2 0 2 4 6 8 10 12 14 16 18
Candidates / 0.46 ps
10 102
103
104
0.012 ps = 1.509 ±
Bd
τ
0.02 = 1.06 ± Sτ
0.003 ps = 0.107 ± στ
0.06 ps = 1.49 ±
bkg,1
τ
0.09 ps = 0.47 ±
bkg,2
τ
= 1.03 Ndof 2/ χ = 7 TeV s
= 4.9 fb-1
L
Data Fitted model Signal Background ATLASPreliminary