This content has been downloaded from IOPscience. Please scroll down to see the full text.
Download details:
IP Address: 134.245.215.103
This content was downloaded on 17/07/2015 at 09:40
Please note that terms and conditions apply.
Potential increasing dominance of heterotrophy in the global ocean
View the table of contents for this issue, or go to the journal homepage for more 2015 Environ. Res. Lett. 10 074009
(http://iopscience.iop.org/1748-9326/10/7/074009)
Home Search Collections Journals About Contact us My IOPscience
LETTER
Potential increasing dominance of heterotrophy in the global ocean
K F Kvale1,2,4, K J Meissner1,2and D P Keller3
1 Climate Change Research Centre, University of New South Wales, Sydney, NSW, Australia
2 ARC Centre of Excellence for Climate System Science, Sydney, NSW, Australia
3 GEOMAR Helmholtz Centre for Ocean Research, West shore campus, Duesternbrooker Way 20, D-24105 Kiel, Germany
4 Current address: GEOMAR Helmholtz Centre for Ocean Research, West shore campus, Duesternbrooker Way 20, D-24105 Kiel, Germany.
E-mail:kkvale@geomar.de
Keywords:climate change, heterotrophy, biogeochemistry, climate thresholds
Abstract
Autotrophy is largely resource-limited in the modern ocean. Paleo evidence indicates this was not necessarily the case in warmer climates, and modern observations as well as standard metabolic theory suggest continued ocean warming could shift global ecology towards heterotrophy, thereby reducing autotrophic nutrient limitation. Such a shift would entail strong nutrient recycling in the upper ocean and high rates of net primary production (NPP), yet low carbon export to the deep ocean and sediments.
We demonstrate transition towards such a state in the early 22nd century as a response to business-as- usual representative concentration pathway forcing (RCP8.5) in an intermediate complexity Earth system model in three configurations; with and without an explicit calcifier phytoplankton class and calcite ballast model. In all models nutrient regeneration in the near-surface becomes an increasingly important driver of primary production. The near-linear relationship between changes in NPP and global sea surface temperature (SST) found over the 21st century becomes exponential above a 2–4
◦Cglobal mean SST change. This transition to a more heterotrophic ocean agrees roughly with metabolic theory.
1. Introduction
The metabolic theory of ecology (Brownet al2004) predicts that the exponential relationship existing between temperature and metabolism (Gillooly et al2001) of the individual is scalable to ecosystems.
Marine planktonic communities are no exception. It has been demonstrated that the differential tempera- ture dependencies of phytoplankton community respiration (a heterotrophic process) and primary production (an autotrophic process), of which the dependency in respiration is stronger (Duarte and Agusti1998, López-Urrutia et al 2006, Regaudie-de Gioux and Duarte2012), determines the spatial and temporal metabolic balance of the global surface ocean (Duarte and Agusti1998, Hoppe et al2002, López- Urrutiaet al2006). Growth of phytoplankton, how- ever, is also determined by nutrient limitation, and most phytoplankton communities in the modern ocean are resource and not temperature limited (Marañónet al2014). In the modern surface ocean, regions of net heterotrophy (where community
respiration exceeds gross primary production) are compensated for by regions of high primary produc- tion (Duarte and Agusti 1998, Hoppe et al 2002).
However, whether zones such as the oligotrophic subtropical gyres are truly net heterotrophic remains an ongoing debate (e.g., Ducklowet al2013, Duarte et al2013, Williamset al2013). The attenuation of the verticalflux of particulate organic carbon is likewise strongly influenced by temperature, which regulates remineralization (bacterial respiration) rates below the euphotic zone (Marsayet al2015).
Regions with high rates of community respiration tend to be classified as heterotrophic, and also act as net sources of carbon to the atmosphere (Duarte and Agusti1998). There are obvious implications for the global ocean carbon sink in a warmer world, if higher near-surface remineralization rates lead to a reduction in oceanic carbon uptake, producing a positive feed- back on greenhouse warming and‘short-circuiting’of the carbon cycle (López-Urrutiaet al2006, Regaudie- de Gioux and Duarte2012, Marsayet al2015). Indeed, isotopic reconstructions of remineralization profiles
OPEN ACCESS
RECEIVED
16 March 2015
REVISED
9 June 2015
ACCEPTED FOR PUBLICATION
22 June 2015
PUBLISHED
10 July 2015
Content from this work may be used under the terms of theCreative Commons Attribution 3.0 licence.
Any further distribution of this work must maintain attribution to the author(s) and the title of the work, journal citation and DOI.
© 2015 IOP Publishing Ltd
during the warmer Eocene epoch (55.5–33.7 Ma) reveal both shallower remineralization and higher metabolic rates than found in the modern ocean (Oli- varez Lyle and Lyle2006, Johnet al2013), and are sus- pected of contributing to the maintenance of higher global temperatures over the period (Olivarez Lyle and Lyle 2006). Earth system modelling of the Eocene using temperature-dependent remineralization rates by Johnet al(2014) recently achieved good agreement with the isotopic reconstructions, supporting the hypothesis that enhanced metabolic rates played a cri- tical role in reducing observed carbonfluxes.
Major changes are currently underway in open ocean biogeochemistry owing to anthropogenic addi- tions of greenhouse gases to the atmosphere. These changes are affected through three independent but synergistic phenomena; ocean warming, acidification and deoxygenation (summarized by Gruber 2011).
Recent interest in the potential net biogeochemical impacts of these phenomena has resulted in several studies (e.g., Schmittner et al 2008, Steinacher et al2010, Boppet al2013, Mooreet al2013) examin- ing the combined biogeochemical response in coupled Earth system models. The common biogeochemical metrics in these studies are change in net primary pro- duction (NPP), carbon export to the deep ocean, and seawater oxygen content. There is general agreement across models and modelling studies that increasing atmospheric CO2concentrations over the 21st century will increase sea surface temperatures (SSTs) and stra- tification, and decrease carbon export production (Schmittneret al 2008, Steinacher et al 2010, Bopp et al2013, Mooreet al2013, Yoolet al2013). Simu- lated 21st century NPP also generally decreases, although Schmittneret al (2008) found an increase using the University of Victoria Earth System Climate Model (UVic ESCM). Although model structures vary and regional differences exist, the main reasons for the decline in NPP and export production are similar and related to increasing restrictions on autotrophic pri- mary production. Increased water column stratification in the low and middle latitudes diminishes resupply of nutrients to the euphotic zone from the deep ocean (Boppet al2001). Global NPP declines as nutrient lim- itation increases in these regions (with declining carbon export as a consequence), even though high latitudes might show increases in NPP as light and temperature limitation recedes (e.g., Schmittner et al 2008, Stei- nacheret al2010, Yoolet al2013).
Longer-term ocean biogeochemical trends under a high carbon emissions scenario have been speculated to follow those of the 21st century (e.g., Moore et al2013). However, Schmittneret al(2008) demon- strated the combination of reduced stratification and warming-enhanced biological processes after the 21st century result in large increases in global NPP beyond 2100, though carbon export still declines in their study. Taucher and Oschlies (2011) also demonstrated in the UVic ESCM an increase in temperature-
dependent microbial fast recycling by 2100 that increases temperature-dependent NPP, which does not occur when these processes are considered tem- perature-independent. A recent update of the UVic ESCM biogeochemistry model by Kelleret al(2012) refined the phytoplankton growth rate and added new formulations for grazing and iron limitation. These modifications have resolved the discrepancy between the sign of 21st century NPP trends in the Schmittner et al(2008) study and other model studies, though the longer-term increases in NPP remain (described in section3). Kvaleet al(2015) recently implemented a calcifying phytoplankton functional type and prog- nostic particulate calcium carbonate (CaCO3) in the model, which increased the ecological dynamism and improved the mechanistic realism of the carbon export processes. These modifications impact the model’s behavior under anthropogenic forcing but do not eliminate the long-term trend in NPP (also descri- bed in section3). Here we argue that the apparently robust simulated trend reversal in NPP in the UVic ESCM must be given serious consideration in light of evidence presented by paleoproxy and modern obser- vations that phytoplankton metabolic processes have the capacity to short-circuit the marine carbon cycle.
2. Methods
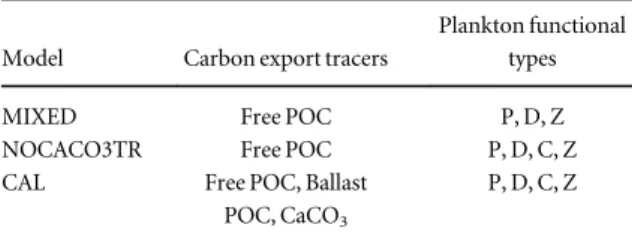
We compare the transient ocean biogeochemical response of three University of Victoria Earth System Climate Model (UVic ESCM; Weaver et al 2001, Meissneret al 2003, Eby et al 2009) configurations (MIXED, CAL, and NOCACO3TR). The UVic ESCM is a coarse-resolution (1.8° × 3.6° × 19 ocean depth layers) ocean-atmosphere-biosphere-cryosphere-geo- sphere model. The standard UVic ESCM version 2.9 includes a NPZD submodel with‘mixed phytoplank- ton’and‘diazotroph’phytoplankton functional types and one‘zooplankton’functional type (described in Schmittner et al 2008). The MIXED model is the standard UVic ESCM NPZD submodel, updated with the changes made by Kelleret al(2012) and referred to as‘NOCAL’in Kvale et al (2015). The CAL model builds upon MIXED and additionally includes a‘small and calcifying phytoplankton’ functional type (referred to throughout this paper simply as ‘calci- fiers’) and a prognostic CaCO3 tracer (Kvale et al2015). The NOCACO3TR model only includes the additional ‘small and calcifying phytoplankton’ functional type but does not include the prognostic CaCO3 tracer. Table 1lists relevant biogeochemical model tracers and functional types for the three model configurations used here. These configurations were chosen for this study because of hypothesized nutri- ent-driven shifts in future community composition between‘small’(commonly assumed as a proxy for calcifiers) and‘large’(commonly assumed as a proxy for diatoms and other non-calcifiers) phytoplankton 2
Environ. Res. Lett.10(2015) 074009 K F Kvaleet al
under anthropogenic climate change forcing (e.g., Cermenoet al2008, Marinovet al2010,2013). Shifts in relative abundance of phytoplankton functional types have the potential to alter carbon export to the deep ocean (Bopp et al 2005), for which carbonate from calcifiers is a significant vector (Jinet al2006).
Please refer to Kvale et al (2015) for a complete description of the CAL and MIXED ecosystem and biogeochemical models.
The UVic ESCM phytoplankton biomass equations utilize a modified Eppley curve (Epp- ley1972) to calculate maximum possible growth rate as a function of seawater temperature and iron avail- ability. Growth limitation by nitrate and phosphate are calculated using half saturation constants and nutrient concentration, where calcifiers in the CAL and NOCACO3TR models are assigned nutrient affi- nities higher than mixed phytoplankton (Le Quéréet al2005). Actual growth rates are determined by the most limiting factor, given the maximum possi- ble growth rate and availability of nutrients and light.
Biomass loss terms include a temperature-indepen- dent linear mortality term, grazing by zooplankton, and a loss term referred to as‘microbial fast recycling’.
There are three temperature-dependent heterotrophic loss terms in the UVic ESCM: microbial fast recycling, zooplankton excretion, and detrital remineralization.
The microbial fast recycling term accounts for near- surface losses to the microbial loop and dissolved organic matter cycling. Similar processes govern detri- tal remineralization and both are parameterized using the Eppley curve. Zooplankton excretion is a propor- tion of zooplankton grazing, which is subject to prey availability and thus phytoplankton growth rate, as well as the zooplankton growth rate which is tempera- ture dependent until capped at 20 C° (Keller et al2012). Respiration due to metabolic maintenance is not explicitly accounted for, but is implicitly inclu- ded in primary production. Redfield stoichiometry is used throughout.
Organic carbon export in all model configurations occurs through a prognostic detrital tracer made up of dead plankton that sinks at a rate that increases line- arly with depth and remineralizes at a rate dependent on temperature. Any organic detritus that reaches the sediments is assumed to dissolve instantly back into the water column. In the CAL model, a portion of this
organic detritus is‘protected’from remineralization by afixed fraction of the associated particulate inor- ganic CaCO3as a rough parameterization of ballasting (Klaas and Archer2002). This protected detritus loses its protection at the rate of CaCO3dissolution, which is a function of the degree of carbonate saturation.
CaCO3 is produced at a fixed ratio based on dead plankton (mixed phytoplankton and zooplankton in MIXED, calcifiers and zooplankton in CAL and NOCACO3TR). It is exported and dissolved instanta- neously in MIXED and NOCACO3TR (Schmittner et al 2008, Keller et al 2012), but it is traced and assigned prognostic sinking and dissolution rates in CAL (Kvaleet al2015). In all model configurations, any CaCO3reaching the sediments is buried.
The three model versions werefirst integrated for ten thousand years in fully coupled mode using a con- stant pre-industrial CO2 atmospheric concentration of 283.8 ppm to establish equilibrium. Historical CO2
forcing, as well as historical agricultural, volcanic, sul- phate aerosol and CFC emissions, and changes to land ice and solar forcing were then applied from year 1800 to 2005 using the PMIP3 (Paleoclimate Modelling Intercomparison Project Phase 3) data compilation (Machida et al 1995, Battle et al 1996, Etheridge et al1996,1998, Flückigeret al1999,2004, Ferretti et al2005, Meureet al2006). From year 2005 to 2400 the models were forced using increasing CO2 con- centrations and radiative forcing from all non-CO2
greenhouse gases, fractions of the land surface devoted to agricultural uses, and the direct effect of sulphate aerosols as an alteration of the surface albedo follow- ing ‘business-as-usual’ RCP scenario 8.5 (RCP8.5, Riahiet al 2007, Meinshausenet al 2011,figure 1).
Weathering fluxes were held constant at the pre- industrial rate (Meissneret al2012). The model was driven by seasonal variations in solar insolation at the top of the atmosphere and seasonally varying wind stress and windfields (Kalnay1996). The windfields are geostrophically adjusted to air temperature anomalies (Weaveret al2001).
3. Results and discussion
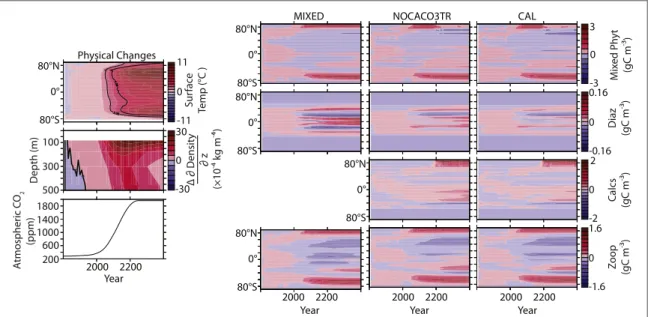
The physical response (i.e., changes in temperature, salinity, ocean circulation, sea ice) to radiative forcing is the same across all three model configurations.
Atlantic meridional overturning rapidly weakens from about 22 Sv (106m3s−1) before year 2000 to less than 8 Sv by year 2300 (not shown). Antarctic Bottom Water formation increases slightly after year 2000 by 1 Sv (not shown). Zonally averaged SSTs warm up to 11 C◦ relative to the year 1800 value by year 2400, and strong near-surface stratification occurs on a global scale (figure 1). Differences in model response to climate forcing demonstrate the effect of biogeochem- ical model structure only, such as presence or absence of calcifiers (compare MIXED to NOCACO3TR) and
Table 1.List of the main ecosystem components for each configura- tion. Abbreviations stand for: particulate organic carbon (POC), calcium carbonate (CaCO3), mixed phytoplankton (P), diazotrophs (D), zooplankton (Z), small phytoplankton and calcifiers (C).
Model Carbon export tracers
Plankton functional types
MIXED Free POC P, D, Z
NOCACO3TR Free POC P, D, C, Z
CAL Free POC, Ballast
POC, CaCO3
P, D, C, Z
instant CaCO3 dissolution and sinking versus full carbonate tracer (compare NOCACO3TR to CAL).
3.1. Changes in plankton biomass
Figure1shows changes in zonally integrated plankton concentration with respect to the year 1800 values.
Changes in concentration are relatively small over the 21st century in all models, but show large changes after year 2100. Mixed phytoplankton decrease in the low latitudes due to increasing nutrient limitation in all models, and increase in the high latitudes due to increasing temperature and light availability.
Diazotroph concentrations increase in the low lati- tudes, though the scale of their response is small in comparison to the other phytoplankton types. Calci- fiers in the NOCACO3TR and CAL models have a lower nutrient half saturation constant (a higher nutrient affinity) than mixed phytoplankton, so decreasing surface nutrient concentrations in the low and middle latitudes increase their relative advantage, and the population increases in the southern Pacific and Atlantic basins (shown in zonal integration).
Changes in zooplankton concentrations broadly fol- low the spatial pattern of total phytoplankton biomass.
3.2. Changes in biogeochemical pathways
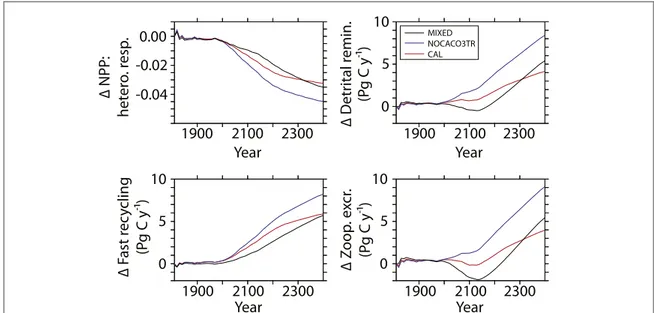
Carbon and nutrient recycling fundamentally shifts after the 20th century in all model configurations. The ratio of NPP to near-surface (to 130 m depth) hetero- trophic respiration declines rapidly (figure2). While all three respiration terms increase over time (figure2), only fast recycling increases for all three models during the 21st century. While the overall contribution of fast recycling to respiration is small (not shown), it is the most sensitive to 21st century increases in SSTs and dominates the shift towards increasing respiration rates until zooplankton excretion and total water
column remineralization rapidly increase in the 22nd century. Fast recycling rates of mixed phytoplankton never decline in spite of an overall decline in NPP (figure3) and detritus production (figure4) in thefirst half of the MIXED simulation. The accelerating effect of microbial fast recycling on increasing global NPP and (decreasing the NPP): (heterotrophic respiration) ratio is most apparent in the NOCACO3TR simula- tion. Calcifiers replace mixed phytoplankton in the lower latitudes, which leads to more fast recycling and higher nutrient availability. More nutrients allow for higher NPP (including more calcifiers), which main- tains the zooplankton population in these regions throughout the simulation. This allows zooplankton excretion rates to increase faster in NOCACO3TR than in the other models. A mitigating effect by CaCO3
ballast is apparent in the CAL simulation when compared to NOCACO3TR, where eventual increases in all heterotrophic rates are not as large because of the protection from remineralization provided to a por- tion of sinking detritus.
3.3. Changes in NPP
Figure3 shows changes in globally integrated NPP from pre-industrial values, as well as the % change as a function of global mean SST for all model configura- tions. Our simulations show that the relationship between global mean NPP and SST is complex and not simply linear as previously discussed by Bopp et al (2013) and Moore et al (2013). In MIXED, the relationship between NPP and SST anomalies is negative and quasi-linear until 3 to4 C◦ of warming, whereupon the relationship becomes positive and exponential. At global mean SST changes below3 C◦ , reduced nutrient supply dominates the global NPP trend (a physically-driven feedback on autotrophy), but a transition occurs at about 4 C◦ whereupon
Figure 1.Hovmöller diagrams of variable anomalies relative to year 1800 for the three UVic ESCM model configurations used in this study, and atmospheric CO2concentration timeseries.
4
Environ. Res. Lett.10(2015) 074009 K F Kvaleet al
Figure 2.Timeseries of the (integrated NPP): (heterotrophic respiration) ratio in upper 130 meters as anomalies relative to year 1800 (top left). Other panels show timeseries of total depth-integrated heterotrophic respiration terms as anomalies: detrital
remineralization (top right), fast recycling (bottom left), zooplankton excretion (bottom right).
Figure 3.Global integrated NPP as anomalies relative to year 1800 (left panel). Global integrated percent change in NPP from pre- industrial (year 1800) values versus global average SST change from pre-industrial values by decade (right panel).
Figure 4.Timeseries of export production change from pre-industrial (year 1800) values at 130 meters depth (top row) and 2 km depth (bottom row). Left panels are particulate organic carbon, right panels are CaCO3.
warming-enhanced heterotrophic respiration and a small global reduction of stratification (figure 1) increases the supply of near-surface nutrients and increases NPP (Schmittneret al2008).
The inclusion of calcifiers in the NOCACO3TR model alters the initial negative linear NPP:SST rela- tionship in MIXED to an initial positive linear rela- tionship. Global NPP never declines in NOCACO3TR and CAL in spite of globally declining surface nutrients because of the replacement of mixed phytoplankton populations by calcifiers.
The addition of a prognostic calcite tracer reduces model NPP sensitivity to SST warming relative to the NOCACO3TR configuration. In the CAL configura- tion trends in all plotted variables share the same tem- poral and spatial patterns, but not the magnitude, with the NOCACO3TR configuration. This is due to the added effect of calcite-ballasted detritus, which increa- ses over the simulation alongside the calcifier popula- tion and effectively removes nutrients from the surface (thereby mitigating the heterotrophy feedback). Even- tually, however, even the mitigating effect of ballasting cannot override the effect of warming-enhanced remi- neralization, and the NPP:SST relationship becomes exponential.
Choice of parameterization of particle export and remineralization can control surface nutrient resupply and resultant NPP trends (e.g., Taucher and Osch- lies 2011, Segschneider and Bendtsen 2013). For instance, low latitude increases in implicit calcifiers in Mooreet al(2013) were not able to offset declines in global NPP driven by the other phytoplankton because of differences in the export efficiency across the phyto- plankton types. In the NOCACO3TR model there are no differences between calcifier and mixed phyto- plankton carbon export efficiency, and thus calcifier replacement of mixed phytoplankton serves as an equivalent substitution. In CAL, however, calcifiers (including zooplankton) are more efficient exporters because of their ability to ballast detritus (particulate organic carbon) in protective CaCO3. Increased global carbon and nutrient export efficiency as phyto- plankton calcifier populations expand could poten- tially reduce global NPP. However, our simulations show the relevance of calcifier biogeography, as regions where calcifiers expand are also the regions where warming-enhanced biological processes increase the earliest (figure1). The effect of increasing carbon and nutrient export efficiency in CAL does therefore not offset warming-enhanced remineralization.
3.4. Changes in carbon export
Eventual increases in global NPP relative to pre- industrial values in MIXED do not result in an increase in carbon export away from the surface (figure 4).
Global CaCO3and particulate organic carbon export from the near-surface reproduce the NPP trend over
the historical period and 21st century in the MIXED configuration, but while NPP and CaCO3flux even- tually increase beyond the pre-industrial level (figures3 and 4), particulate organic carbon export production does not, and deep water particulate organic carbon flux declines continuously over the simulation. The decline in particulate organic carbon flux in MIXED is mostly caused by the warming- enhanced detrital remineralization rate in the near- surface, which removes particulate organic carbon (none of which is protected by CaCO3) from export even as NPP and CaCO3export increase.
In the NOCACO3TR simulation, replacement of mixed phytoplankton by low and middle latitude cal- cifiers results in a more modest decline in globally integrated particulate organic carbon export produc- tion at 130 m depth, but a larger sensitivity to increas- ing temperature-dependent remineralization rates results in a similar decline in deep ocean particulate organic carbonflux by 2400 (figure4). CaCO3flux, on the other hand, increases more than in other model configurations because of the large NPP:SST sensitiv- ity (figure3).
The moderating effect of the ballast model is apparent in the CAL results, which show the smallest total decline in global deep ocean particulate organic carbonflux and the smallest overall increase in CaCO3
export production (figure4). Increasing globally inte- grated CaCO3 export production as a response to increasing NPP agrees with Schmittneret al(2008), and is not reproduced in models that project declining NPP (e.g., Mooreet al2013, Yoolet al2013).
The addition of small phytoplankton and calci- fiers to the model in the NOCACO3TR and CAL configurations decreases the early particulate organic carbon export production response (near- surface particulate organic carbonfluxes are reduced less in these models over thefirst part of the simula- tions) by maintaining NPP in the warmest (and lower nutrient) regions. The application of a CaCO3
tracer mitigates the longer-term response at 2 km depth because explicit CaCO3 ballasting protects some particulate organic carbon from remineraliza- tion, so deep ocean particulate organic carbonfluxes do not decline as dramatically in the CAL model as in the other two models. Kriestet al(2010) have pre- viously demonstrated strong equilibrium nutrient distribution sensitivity to parameterization of parti- cle export flux and remineralization length scale, both of which are modified between the NOCA- CO3TR and CAL simulations. Addition of calcifiers (but no ballasting) to the PISCES-T model further reduced global export production and ocean carbon uptake relative to the control experiment in Manizza et al(2010) because expansion of calcifiers reduced the zooplankton population (who prefer silicifiers in their model), which reduced carbon export produc- tion and export efficiency more than if no calcifiers were included in the model. This zooplankton 6
Environ. Res. Lett.10(2015) 074009 K F Kvaleet al
response is not seen in CAL because zooplankton grazing is not preferential between calcifiers and mixed phytoplankton, and reinforces the conclusion that ecosystem model parameterization choice criti- cally determines model export production and export efficiency behavior in climate transitions (Taucher and Oschlies 2011, Segschneider and Bendtsen2013).
Despite the large differences in carbon export responses between models described above, only small differences exist in the accumulated anthropogenic emissions diagnosed in the simulations. From years 1800–2400, total diagnosed CO2 emissions are 5125 (MIXED), 5085 (NOCACO3TR), and 5082 Pg C (CAL). This result underscores that while large shifts in marine ecology may occur in the short term, these shifts must be maintained over long timescales if glo- bal carbon air-to-sea fluxes are to be substantially impacted.
3.5. Potential caveats
There are several potential shortcomings in the simulations presented here that might affect our results. Circulation change due to melting of con- tinental ice is not simulated by the model and would likely affect the biogeochemistry. Replacement of mixed phytoplankton by small phytoplankton and calcifiers is dependent on shifts in relative competitive advantage, at least some of which is artificial to the model and would change by including more phyto- plankton types. Specifically, the additions of diatoms and silicate ballasting could mitigate biogeochemical changes associated with temperature-dependent pro- cesses. The experimental set-up does not take transient adjustment in iron limitation into account, which might affect phytoplankton community composition.
Effects of ocean acidification (e.g., Gaoet al2012) on photosynthesis are not included. None of the models simulate globally decreasing net calcification with increasing CO2 concentration (Riebesellet al2000), which would increase the long-term model sensitivity to warming-enhanced remineralization, but is also debatable (Lohbeck et al 2012, Engel et al 2014).
Furthermore, using a single dissolution parameteriza- tion for zooplankton and phytoplankton CaCO3
ignores the contribution of aragonite dissolution (Gangstøet al2008).
It is also important to note that the UVic ESCM does not explicitly account for autotrophic respira- tion and so a common metric for calculating net het- erotrophy, gross primary productivity (e.g., Regaudie-de Gioux and Duarte2012), cannot be cal- culated. New production in the model implicitly includes the effect of autotrophic respiration, which can be expected to increase with increasing temperature.
4. Conclusions
The experiments described here highlight the impor- tance of biogeochemical model parameterizations for the determination of the behavior of the ocean carbon cycle during climate transitions. Though each model analysed in this study (MIXED, NOCACO3TR, and CAL) has very similar equilibrium states, their respec- tive biogeochemical behaviors under transient forcing are unique both in global and regional trends. Overall, the models share a common response of a transition between two dominant regimes. Thefirst regime is physically-dominated and regulates autotrophy for lower changes in SSTs. Reductions in nutrient resup- ply from the deep ocean cause mixed phytoplankton populations to decline in the low and middle latitudes, while increased warming and reduced sea ice cover increase the mixed phytoplankton population in high latitudes. In the MIXED model, global NPP, particu- late organic carbon and CaCO3 export production decline over thefirst half of the simulation as a result of the low latitude trend. Models including an additional plankton functional type representing small phyto- plankton and calcifiers (NOCACO3TR and CAL) show a partial replacement of mixed phytoplankton by calcifiers in the stratifying low latitudes due to their higher nutrient affinities. Consequently, global NPP, particulate organic carbon and CaCO3export produc- tion change less. All models start to transition into the second regime around the start of the 21st century, when temperature-dependent heterotrophic respira- tion rates increase relative to NPP.
During the second regime a biologically-driven feedback on NPP dominates the physically-driven one that defined the 21st century. It is driven by warming- enhanced heterotrophic respiration rates, which com- pensate for reductions in nutrient resupply by rapidly recycling carbon and nutrients in the near-surface.
This feedback increases global NPP and CaCO3export production in all model configurations and represents a fundamental ecological shift towards increasing het- erotrophy. Microbial fast recycling in the near-surface is the most sensitive to warming and accelerates the transition to this second regime. The simulated transi- tion to this second regime in all model configurations raises the possibility trends observed in NPP over recent decades cannot be extrapolated far into the future. The net carbon export into the deep ocean dur- ing this second regime is dependent on whether the model accounts for detrital ballasting by calcite. The model that contains a ballasting parameterization (CAL) shows a mitigated increase in near-surface par- ticulate organic carbon production, and a mitigated decline in deep ocean particulate organic carbon export because the calcite protects particulate organic carbon from near-surface remineralization and con- tinues to effectively remove it to the deep ocean throughout the simulations. No CMIP5 model cur- rently accounts for the ballasting effect, which suggests
they are missing feedbacks that are important to long- term trends in particulate organic carbon export.
Including small phytoplankton and calcifiers as a distinct phytoplankton functional type causes the model to become more sensitive to warming- enhanced remineralization because small phyto- plankton maintain NPP in the warmest (low and mid- dle latitude) regions. A 2 C◦ change is a well- established threshold for dangerous climate change (e.g., Graßlet al2003), and this analysis adds another reason to support this guardrail. This analysis also sug- gests that the low to middle latitude NPP response is going to be one of the more important indicators of system sensitivity to observe as ocean change con- tinues, and that accurately reproducing phyto- plankton competition in models is of utmost importance for understanding tipping points and dan- gerous thresholds in the global carbon cycle. Given the impact this feedback has on global NPP, further inves- tigation of temperature-dependent heterotrophy in models is warranted. In particular, to what degree a transition between‘physical’and‘biological’regimes represents an ecological or climatological tipping point with a demonstrable hysteresis (Duarte et al2012) is an open question, better answered with a model that resolves autotrophic respiration and dis- solved organic matter explicitly, or multiple size clas- ses of zooplankton.
Modellers tend to shy away from discussion of longer-term and larger changes in their models but we argue that increasing heterotrophy might be possible because (1) the parameterizations used here are based on measurements of phytoplankton for a range of temperatures from 0–40 ◦C(Gilloolyet al2001), the upper limit of which is never exceeded in our simula- tions, (2) two recent publications suggest a tempera- ture threshold into net heterotrophy for Arctic ecosystems within 5–6◦C(Duarteet al2012, Holding et al2013), which roughly agrees with our simulated global response, and (3) Eocene proxy reconstructions off Tanzania and eastern Mexico reveal a transition to high rates of production and low rates of export at SSTs within 4 C° warmer than present day (John et al2013), though abyssal temperatures were likely 10 C° warmer (Olivarez Lyle and Lyle 2006, John
et al2013).
The potential for a rapid global transition from a physically dominated to a biologically dominated bio- geochemical regime in the not-too-distant future urges an improved quantification of the associated uncertainties. The sensitivity of the transition to physi- cal model response and biogeochemical model for- mulation is better addressed with a suite of models including all of the major carbon cycle components and phytoplankton functional types included here.
Optimality-based models, e.g., Pahlowet al(2013), are not limited byfixed stoichiometries and could offer particular insight into systemic sensitivities. Broadly similar marine ecosystem models have been shown to
produce a range of physical and biological drivers of NPP trends over the 21st century (Laufkötter2015), and it is therefore logical to assume the timing and severity of a global shift in ecosystem regimes would likewise be influenced by a range of drivers. The authors would welcome simulations of other models extending beyond 2100 and a systematic examination of the associated drivers of NPP.
Acknowledgments
This work was supported by an award under the Merit Allocation Scheme on the NCI National Facility at the ANU. KJM is grateful for support under the ARC Future Fellowship programme (FT100100443). KFK is grateful for support from UNSW through a Uni- versity International Postgraduate Award, and the ARC Centre of Excellence for Climate System Science.
The authors would also like to thank Andreas Schmitt- ner for his thoughtful commentary on an early version of the manuscript.
References
Battle Met al1996Nature383231–5
Bopp L, Aumont O, Cadule P, Alvain S and Gehlen M 2005Geophys.
Res. Lett.32L19606
Bopp L, Monfray P, Aumont O, Dufresne J, le Treut H, Madec G, Terray L and Orr J 2001Glob. Biogeochem. Cycles1581–99 Bopp Let al2013Biogeosciences106225–45
Brown J, Gillooly J, Allen A, Savage V and West G 2004Ecology85 1771–89
Cermeno P, Dutkiewicz S, Harris R P, Follows M, Schofield O and Falkowski P G 2008Proc. Natl Acad. Sci. USA10520344–9 Duarte C and Agusti S 1998Science281234–6
Duarte C Met al2012AMBIO4144–55 Duarte C M, Regaudie-de Gioux A, Arrieta J M,
Delgado-Huertas A and Agusti S 2013Annual Review of Marine Scienceed C A Carlson and S J Giovannoni, vol 5, pp 551–69
Ducklow H W and Doney S C 2013Annual Review of Marine Science ed C A Carlson and S J Giovannoni, vol 5, pp 525–33 Eby M, Zickfeld K, Montenegro A, Archer D, Meissner K J and
Weaver A J 2009J. Clim.222501–11
Engel A, Cisternas Novoa C, Wurst M, Endres S, Tang T, Schartau M and Lee C 2014Marine Ecol. Prog. Ser.50715–30 Eppley R 1972Fishery Bull.701063–85
Etheridge D, Steele L, Francey R and Langenfelds R 1998J. Geophys.
Res.-Atmos.10315979–93
Etheridge D, Steele L, Langenfelds R, Francey R, Barnola J and Morgan V 1996J. Geophys. Res.-Atmos.1014115–28 Ferretti Det al2005Science3091714–7
Flückiger J, Blunier T, Stauffer B, Chappellaz J, Spahni R, Kawamura K, Schwander J, Stocker T F and Dahl-Jensen D 2004Glob. Biogeochem. Cycles18GB1020
Flückiger J, Dällenbach A, Blunier T, Stauffer B, Stocker T F, Raynaud D and Barnola J M 1999Science285227–30 Gangstø R, Gehlen M, Schneider B, Bopp L, Aumont O and Joos F
2008Biogeosciences51057–72
Gao K, Walter Helbling E, Haeder D P and Hutchins D A 2012 Marine Ecol. Prog. Ser.470167–89
Gillooly J, Brown J, West G, Savage V and Charnov E 2001Science 2932248–51
Graßl H, Kokott J, Kulessa M, Luther J, Nuscheler F, Sauerborn R, Schellnhuber H J, Schubert R and Schulze E D 2003Climate Protection Strategies for the 21st Century: Kyoto and Beyond (Berlin: German Advisory Council on Global Change)
8
Environ. Res. Lett.10(2015) 074009 K F Kvaleet al
Gruber N 2011Phil. Trans. R. Soc.A3691980–96 Holding J M, Duarte C M, Arrieta J M, Vaquer-Sunyer R,
Coello-Camba A, Wassmann P and Agusti S 2013 Biogeosciences10357–70
Hoppe H, Gocke K, Koppe R and Begler C 2002Nature416168–71 Jin X, Gruber N, Dunne J P, Sarmiento J L and Armstrong R A 2006
Glob. Biogeochem. Cycles202
John E H, Pearson P N, Coxall H K, Birch H, Wade B S and Foster G L 2013Phil. Trans. R. Soc.A37120130099 John E H, Wilson J D, Pearson P N and Ridgwell A 2014Palaeogeogr.
Palaeoclimatol. Palaeoecol.413158–66 Kalnay Eet al1996Bull. Am. Meteorol. Soc.77437–71 Keller D P, Oschlies A and Eby M 2012Geosci. Model Dev.5
1195–220
Klaas C and Archer D 2002Glob. Biogeochem. Cycles1663 Kriest I, Khatiwala S and Oschlies A 2010Prog. Oceanogr.86337–60 Kvale K, Meissner K, Keller D, Schmittner A and Eby M 2015
Atmos.-Ocean(doi:10.1080/07055900.2015.1049112) Laufkötter Cet al2015Biogeosci. Discuss.123731–824 Le Quéré Cet al2005Glob. Change Biol.112016–40
Lohbeck K T, Riebesell U and Reusch T B H 2012Nat. Geosci.5 346–51
López-Urrutia A, San Martin E, Harris R and Irigoien X 2006Proc.
Natl Acad. Sci. USA1038739–44
Machida T, Nakazawa T, Fujii Y, Aoki S and Watanabe O 1995 Geophys. Res. Lett.222921–4
Manizza M, Buitenhuis E T and le Quéré C 2010Geophys. Res. Lett.
37GL043360
Marañón E, Cermeño P, Huete-Ortega M, López-Sandoval D C, Mouriño Carballido B and Rodríguez-Ramos T 2014PLoS ONE9e99312
Marinov I, Doney S C and Lima I D 2010Biogeosciences73941–59 Marinov I, Doney S C, Lima I D, Lindsay K, Moore J K and
Mahowald N 2013Glob. Biogeochem. Cycles271274–90
Marsay C M, Sanders R J, Henson S A, Pabortsava K,
Achterberg E P and Lampitt R S 2015Proc. Natl Acad. Sci.
USA1121089–94
Meinshausen Met al2011Clim. Change109213–41 Meissner K J, McNeil B I, Eby M and Wiebe E C 2012Glob.
Biogeochem. Cycles26GB3017
Meissner K, Weaver A, Matthews H and Cox P 2003Clim. Dyn.21 515–37
Meure M C, Etheridge D, Trudinger C, Steele P, Langenfelds R, van Ommen T, Smith A and Elkins J 2006Geophys. Res. Lett.
33L14810
Moore J K, Lindsay K, Doney S C, Long M C and Misumi K 2013 J. Clim.269291–312
Olivarez Lyle A and Lyle M 2006Paleoceanography21PA2007 Pahlow M, Dietze H and Oschlies A 2013Marine Ecol. Prog. Ser.489
1–16
Regaudie-de Gioux A and Duarte C M 2012Glob. Biogeochem.
Cycles26GB1015
Riahi K, Gruebler A and Nakicenovic N 2007Technol. Forecast. Soc.
Change74887–935
Riebesell U, Zondervan I, Rost B, Tortell P, Zeebe R and Morel F 2000Nature407364–7
Schmittner A, Oschlies A, Matthews H D and Galbraith E D 2008 Glob. Biogeochem. Cycles22GB1013
Segschneider J and Bendtsen J 2013Glob. Biogeochem. Cycles27 1214–25
Steinacher Met al2010Biogeosciences7979–1005 Taucher J and Oschlies A 2011Geophys. Res. Lett.38L02603 Weaver Aet al2001Atmos.-Ocean39361–428
Williams P J l B, Quay P D, Westberry T K and Behrenfeld M J 2013 Annual Review of Marine Scienceed C A Carlson and S J Giovannoni, vol 5, pp 535–49
Yool A, Popova E E, Coward A C, Bernie D and Anderson T R 2013 Biogeosciences105831–54