Supporting Information for
Quantifying the time lag between organic matter production and export in the surface ocean: Implications for estimates of export efficiency
P Stange*
1, LT Bach
1, FAC Le Moigne
1, J Taucher
1, T Boxhammer
1and U Riebesell
11 GEOMAR Helmholtz Centre for Ocean Research Kiel
Contents of this file Table S1 1
2 3 4 5 6 7 8 9
10 11
12 1314
15
16
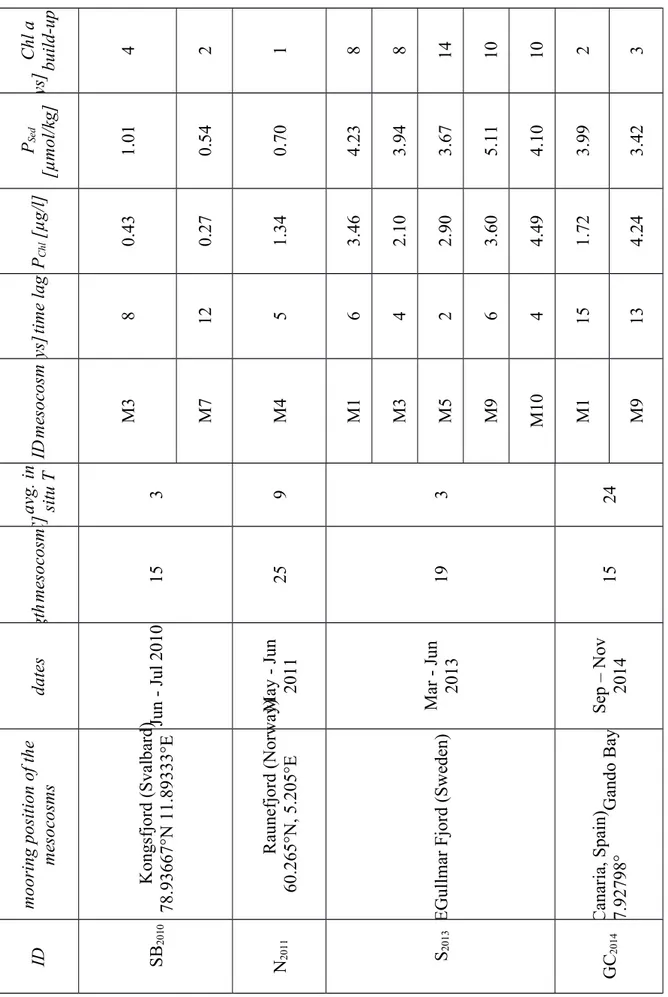
Table S1. Overview of all experiments and the key measured and calculated parameters included in this study. Mesocosm length includes the sediment trap and is given in meters
Chl a build-up[days] 4 2 1 8 8 14 10 10 2 3
PSed [µmol/kg] 1.01 0.54 0.70 4.23 3.94 3.67 5.11 4.10 3.99 3.42
PChl [µg/l] 0.43 0.27 1.34 3.46 2.10 2.90 3.60 4.49 1.72 4.24
time lag[days] 8 12 5 6 4 2 6 4 15 13
mesocosmID M3 M7 M4 M1 M3 M5 M9 M10 M1 M9
avg. in situ T[° C] 3 9 3 24
mesocosmlength 15 25 19 15
dates Jun - Jul 2010 May - Jun 2011 Mar - Jun 2013 Sep – Nov 2014
mooring position of the mesocosms Kongsfjord (Svalbard) 78.93667°N 11.89333°E Raunefjord (Norway) 60.265°N, 5.205°E Gullmar Fjord (Sweden) 58.26635°N 11.47832°E Gando Bay(Gran Canaria, Spain) 27.92798°
ID SB2010 N2011 S2013 GC2014
17 18
below sea surface. In situ temperature is averaged over time and the entire water column of the mesocosms.
19 20