1
Supplementary Material
Relevance of nutrient-limited phytoplankton production and its bacterial remineralization for carbon and oxygen fluxes in the Baltic Sea
Judith Piontek
1, Sonja Endres
1, Frédéric A. C. Le Moigne
1, Markus Schartau
1, Anja Engel
1*1
GEOMAR Helmholtz Centre for Ocean Research Kiel, Biological Oceanography, Kiel, Germany
*
Correspondence:
aengel@geomar.de
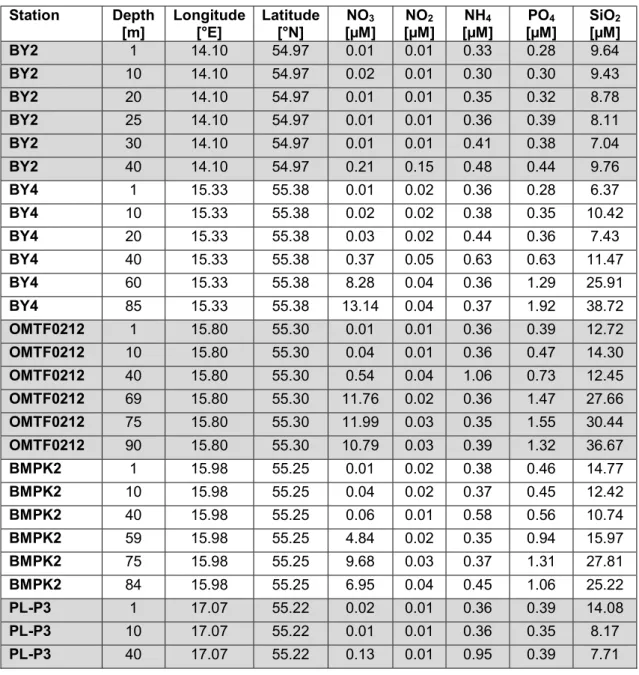
Tab. SI 1. Dissolved inorganic nutrients (NO
3: nitrate, NO
2: nitrite, NH
4: ammonium, PO
4: phosphate, SiO
2: silicate; nd: not detectable, na: not available).
Station Depth
[m] Longitude
[°E] Latitude
[°N] NO3
[µM] NO2
[µM] NH4
[µM] PO4
[µM] SiO2
[µM]
BY2 1 14.10 54.97 0.01 0.01 0.33 0.28 9.64
BY2 10 14.10 54.97 0.02 0.01 0.30 0.30 9.43
BY2 20 14.10 54.97 0.01 0.01 0.35 0.32 8.78
BY2 25 14.10 54.97 0.01 0.01 0.36 0.39 8.11
BY2 30 14.10 54.97 0.01 0.01 0.41 0.38 7.04
BY2 40 14.10 54.97 0.21 0.15 0.48 0.44 9.76
BY4 1 15.33 55.38 0.01 0.02 0.36 0.28 6.37
BY4 10 15.33 55.38 0.02 0.02 0.38 0.35 10.42
BY4 20 15.33 55.38 0.03 0.02 0.44 0.36 7.43
BY4 40 15.33 55.38 0.37 0.05 0.63 0.63 11.47
BY4 60 15.33 55.38 8.28 0.04 0.36 1.29 25.91
BY4 85 15.33 55.38 13.14 0.04 0.37 1.92 38.72
OMTF0212 1 15.80 55.30 0.01 0.01 0.36 0.39 12.72 OMTF0212 10 15.80 55.30 0.04 0.01 0.36 0.47 14.30 OMTF0212 40 15.80 55.30 0.54 0.04 1.06 0.73 12.45 OMTF0212 69 15.80 55.30 11.76 0.02 0.36 1.47 27.66 OMTF0212 75 15.80 55.30 11.99 0.03 0.35 1.55 30.44 OMTF0212 90 15.80 55.30 10.79 0.03 0.39 1.32 36.67 BMPK2 1 15.98 55.25 0.01 0.02 0.38 0.46 14.77 BMPK2 10 15.98 55.25 0.04 0.02 0.37 0.45 12.42 BMPK2 40 15.98 55.25 0.06 0.01 0.58 0.56 10.74 BMPK2 59 15.98 55.25 4.84 0.02 0.35 0.94 15.97 BMPK2 75 15.98 55.25 9.68 0.03 0.37 1.31 27.81 BMPK2 84 15.98 55.25 6.95 0.04 0.45 1.06 25.22 PL-P3 1 17.07 55.22 0.02 0.01 0.36 0.39 14.08 PL-P3 10 17.07 55.22 0.01 0.01 0.36 0.35 8.17 PL-P3 40 17.07 55.22 0.13 0.01 0.95 0.39 7.71
2
Tab. SI 1. Continued.
Station Depth [m]
Longitude [°E]
Latitude [°N]
NO3
[µM]
NO2
[µM]
NH4
[µM]
PO4
[µM]
SiO2
[µM]
PL-P3 65 17.07 55.22 1.22 0.07 0.97 0.63 9.37 PL-P3 75 17.07 55.22 8.17 0.02 0.38 1.43 25.32 PL-P3 85 17.07 55.22 8.66 0.02 0.44 1.54 27.48
K1 1 18.40 55.55 0.02 0.01 0.11 0.42 13.75
K1 10 18.40 55.55 0.02 0.02 0.10 0.44 14.06
K1 40 18.40 55.55 0.23 0.02 0.93 0.65 13.61
K1 65 18.40 55.55 4.60 0.12 0.76 1.51 21.87
K1 75 18.40 55.55 6.79 0.05 0.08 2.35 39.22
K1 83 18.40 55.55 5.96 0.07 0.47 2.34 35.38
BY10 1 19.58 56.63 0.09 0.02 0.08 0.28 8.67 BY10 10 19.58 56.63 0.02 0.02 0.07 0.28 11.17 BY10 40 19.58 56.63 0.22 0.03 0.98 0.51 11.35 BY10 70 19.58 56.63 1.83 0.05 0.86 0.90 15.34 BY10 110 19.58 56.63 0.54 0.15 7.04 2.83 47.20 BY10 130 19.58 56.63 4.60 0.02 0.05 1.53 25.42 BY15 1 20.05 57.33 0.04 0.02 0.14 0.29 10.36 BY15 10 20.05 57.33 0.01 0.01 0.11 0.30 10.81 BY15 40 20.05 57.33 0.17 0.05 1.05 0.65 14.23 BY15 60 20.05 57.33 1.43 0.09 1.15 0.87 16.65 BY15 80 20.05 57.33 6.11 0.03 0.07 2.29 40.50 BY15 110 20.05 57.33 0.12 0.11 3.28 2.67 39.07 BY15 140 20.05 57.33 6.42 0.01 0.11 2.17 41.11 BY15 180 20.05 57.33 7.23 0.01 0.05 1.91 33.78 BY15 220 20.05 57.33 4.77 nd 0.09 1.30 19.47 BY11 1 19.83 57.07 nd 0.01 0.08 0.22 6.21 BY11 10 19.83 57.07 0.01 0.01 0.08 0.28 7.93 BY11 18 19.83 57.07 nd 0.02 0.08 0.25 7.01 BY11 30 19.83 57.07 0.03 0.01 0.26 0.44 11.60 BY11 40 19.83 57.07 0.10 0.02 0.90 0.48 9.54 BY11 60 19.83 57.07 1.12 0.07 0.95 0.66 11.09 BY11 70 19.83 57.07 2.64 0.07 0.48 1.13 16.69 BY11 80 19.83 57.07 5.85 0.09 0.10 2.49 34.81 BY11 110 19.83 57.07 0.26 0.09 3.08 2.25 32.22 BY11 130 19.83 57.07 4.75 0.10 0.98 2.40 42.88 BY11 150 19.83 57.07 4.80 0.02 0.03 1.61 28.08 BY11 190 19.83 57.07 4.55 0.01 0.05 1.10 21.87
142 1 22.98 57.57 0.11 0.07 0.23 0.10 1.68
142 10 22.98 57.57 0.03 0.04 2.46 0.09 1.29
142 20 22.98 57.57 1.84 0.29 0.20 0.21 5.11
142 35 22.98 57.57 5.30 0.61 0.56 0.77 19.03
3
Tab. SI 1. Continued.
Station Depth [m]
Longitude [°E]
Latitude [°N]
NO3
[µM]
NO2
[µM]
NH4
[µM]
PO4
[µM]
SiO2
[µM]
119 1 23.85 57.30 nd 0.02 1.62 0.08 0.69
119 10 23.85 57.30 0.02 0.03 0.11 0.07 0.86
119 20 23.85 57.30 0.17 0.05 2.34 0.10 1.23
119 38 23.85 57.30 7.38 0.68 0.11 0.95 30.68
GOR 1 22.80 58.00 nd 0.05 1.53 0.09 1.24
GOR 5 22.80 58.00 0.01 0.03 1.18 0.10 1.00
GOR 10 22.80 58.00 nd 0.03 1.18 0.09 1.22
GOR 20 22.80 58.00 0.05 0.04 1.16 0.15 1.78
BY21 1 20.33 58.44 0.04 0.01 0.07 0.20 6.79 BY21 10 20.33 58.44 0.02 0.02 0.07 0.23 7.77 BY21 40 20.33 58.44 0.95 0.10 0.69 0.60 12.43 BY21 60 20.33 58.44 3.80 0.10 0.64 1.40 23.26 BY21 70 20.33 58.44 3.50 0.11 0.47 2.61 42.73 BY21 110 20.33 58.44 nd 0.03 2.06 2.58 38.09 BY31 1 18.23 58.58 nd 0.01 0.07 1.72 25.50 BY31 10 18.23 58.58 nd 0.01 0.09 2.34 36.16 BY31 40 18.23 58.58 0.03 0.02 0.59 1.67 25.12 BY31 60 18.23 58.58 0.03 0.02 0.17 2.45 40.05 BY31 70 18.23 58.58 0.01 0.01 0.06 2.24 34.31 BY31 110 18.23 58.58 nd 0.01 8.03 1.62 25.35 BY31 180 18.23 58.58 0.04 0.01 6.40 0.20 7.37 BY31 250 18.23 58.58 0.02 0.02 6.14 0.30 11.36 BY31 300 18.23 58.58 1.06 0.15 6.74 0.82 18.08 BY31 350 18.23 58.58 3.33 0.22 6.49 1.20 21.63 BY31 400 18.23 58.58 5.99 0.10 5.97 2.47 34.53 BY31 430 18.23 58.58 nd 0.04 6.13 2.70 37.99 OMTF0240 1 18.00 58.00 0.04 0.01 0.09 0.23 5.53 OMTF0240 10 18.00 58.00 0.02 0.02 0.08 0.24 8.65 OMTF0240 40 18.00 58.00 0.81 0.11 0.62 0.62 14.57 OMTF0240 70 18.00 58.00 1.61 0.03 0.23 1.53 20.03 OMTF0240 110 18.00 58.00 0.01 0.02 8.45 1.85 23.92 OMTF0240 158 18.00 58.00 0.01 0.03 8.32 2.27 30.83 BY36 1 17.37 57.72 0.02 0.02 na 2.39 32.42 BY36 10 17.37 57.72 0.02 0.01 na 0.47 13.51
BY36 40 17.37 57.72 0.03 nd na 0.29 8.38
BY36 60 17.37 57.72 0.79 0.08 0.52 0.70 13.43 BY36 110 17.37 57.72 0.59 0.04 8.37 1.81 21.86 BY36 130 17.37 57.72 0.01 0.03 8.10 2.62 27.18
4
Tab. SI 1. Continued.
Station Depth [m]
Longitude [°E]
Latitude [°N]
NO3
[µM]
NO2
[µM]
NH4
[µM]
PO4
[µM]
SiO2
[µM]
BY39 1 16.53 56.12 nd 0.03 0.33 0.58 15.61 BY39 10 16.53 56.12 0.01 0.03 0.29 0.58 14.04 BY39 25 16.53 56.12 0.06 0.02 0.38 0.51 8.08 BY39 40 16.53 56.12 0.17 0.04 0.57 0.60 8.78 Hanöbukten 1 14.87 55.62 0.01 0.02 0.33 0.38 13.70 Hanöbukten 10 14.87 55.62 0.04 0.01 0.29 0.34 9.95 Hanöbukten 22 14.87 55.62 0.24 0.02 0.29 0.45 10.44 Hanöbukten 40 14.87 55.62 0.33 0.07 0.38 0.70 11.16 Hanöbukten 75 14.87 55.62 8.54 0.05 0.57 1.52 32.83 OMTF0102 1 13.94 55.16 nd 0.02 0.05 0.24 7.69 OMTF0102 10 13.94 55.16 nd 0.02 0.06 0.29 7.82 OMTF0102 20 13.94 55.16 nd 0.02 0.07 0.30 6.75 OMTF0102 36 13.94 55.16 nd 0.03 0.09 0.30 4.31
5
Tab. SI 2. Taxonomic composition of large phytoplankton. Samples were preserved in brown glass bottles by the addition of Lugol 's solution. 50 mL of sample settled for 48 h before counting of cell numbers with an inverted microscope. Abundances are given in [cells mL
-1].
Cyanophyceae were strongly dominated by Aphanizomenon (>90%). Major diatom genera were Chaetoceros, Skeletonema and Thalassiosira.
total Dinophysis sp.Unidentifiedtotal Mesodinium rubrumUnidentified
BY2112189153015391810120542120212101925004069069514BY41243235961951147102012251371136835201116672171634OMTF0212118323114231391138102722742303227113840003421021210BMPK2145125713211317341045278120311672540001422022110PL-P311290133121111107251096012611012978264000218017100K112090173139141241028101320106631251102740001011011100BY10144321489614816151036011167018529274001919018000BY1512832106751462122910271213788157412384001124024000BY11128529510215871037102062851171899725201383806716519363055394413311055110000404000 StationDepth (m)CyanophyceaeBacillariophyceaeChlorophyta DinophyceaeCiliophora
6
Tab. SI 2. Continued.
total Dinophysis sp.Unidentifiedtotal Mesodiniumrubrum Unidentified14211672436313621101110190231513142022010310301021011191106014782476130131013203385138412012202022240223202GOR135721142114111011587091831183101103191260126101BY21153462196138292710807137915647344022125025101BY31174794118191727071065122015341493034022528028202OMTF0240110501411375132100101081025316161557074002120020101BY361198533876818071012583185679616400203325025101BY39125180854811129102721051316125133102501711451513023419HANÖBUKTEN12403581680167101101060252290328861522011732115206514OMTF0102100121500150303100086227122790923100176206020615015 CiliophoraChlorophytaStationDepth (m)CyanophyceaeBacillariophyceae Dinophyceae
7
Tab. SI 3. Pico- and nanophytoplankton abundances. Samples were analyzed by flow cytometry. Subpopulations were defined based on the forward and side scatter signal and the autofluorescent properties of the cells. Red and orange fluorescence were used to distinguish chlorophyll from phycoerythrin.
Red fluorescence (Chlorophyll a)
Orange fluorescence (Phycoerythrin)
Size class Pico Nano I Nano II Pico Nano
Station Depth [m] [cells mL-1] [cells mL-1] [cells mL-1] [cells mL-1] [cells mL-1]
BY2 1 36488 1551 184 9840 1286
10 36758 2037 125 27699 1382
20 28639 1533 105 29274 1257
25 10073 245 29 24296 456
30 4351 149 12 8018 240
40 3067 51 7 2249 91
BY4 1 32720 3052 61 25952 1631
10 31858 2475 51 25587 1595
20 27701 1400 20 40586 1565
40 4412 68 0 4853 167
60 3836 23 0 608 10
85 7641 49 0 1198 37
OMTF0212 1 71714 2172 44 19343 931
10 63508 1465 15 20455 750
40 5348 112 2 3520 61
68 4326 47 2 975 22
75 4405 61 0 1624 27
90 7971 61 0 850 39
BMPK2 1 80950 2513 113 7182 1257
10 60955 2039 135 50701 2283
40 4419 105 2 3140 189
59 3716 37 0 850 56
75 7986 135 0 943 49
84 7114 121 0 870 59
PL-P3 1 150429 1921 142 5023 854
10 151526 1517 76 10732 974
40 7352 79 5 4140 233
65 3630 44 0 1256 125
75 4005 37 0 955 52
85 4920 33 2 2064 79
K1 1 176943 1143 64 7323 1141
10 177085 1234 44 18239 1352
40 19240 133 2 11026 550
65 5394 40 0 2591 167
75 2405 37 0 1104 44
83 2744 33 0 1291 56
8
Tab. SI 3. Continued.
Red fluorescence (Chlorophyll a)
Orange fluorescence (Phycoerythrin)
Size class Pico Nano I Nano II Pico Nano
Station Depth [m] [cells mL-1] [cells mL-1] [cells mL-1] [cells mL-1] [cells mL-1]
BY10 1 86876 2910 25 5846 901
10 88202 2795 27 5411 729
40 13566 332 2 12101 513
70 3892 51 0 1568 56
110 1124 26 0 807 20
130 4511 79 5 1193 20
BY15 1 87963 2094 2 5225 731
10 94369 2601 27 8795 920
40 4999 65 2 2174 69
60 4125 35 0 1990 42
80 599 7 0 238 15
110 594 7 0 326 29
140 1144 14 0 356 2
180 908 9 0 366 20
220 2270 19 0 1063 34
BY11 1 95502 3137 34 3953 648
10 97056 3326 34 5377 744
20 81782 2601 27 12388 842
30 10427 491 7 15066 825
40 4864 68 2 2680 56
60 4025 40 0 1826 49
70 2996 28 0 1291 34
80 856 14 0 326 10
110 584 16 0 346 29
130 802 19 0 353 37
150 952 12 0 331 12
190 1730 28 0 616 7
142 1 12602 7229 523 134159 9254
10 11178 3316 265 97444 5703
20 6734 804 56 34548 1556
35 6790 568 79 14499 3009
119 1 13178 4067 184 113554 7588
10 13235 3985 162 112556 6827
20 9811 1975 106 62292 3036
38 6091 425 44 15858 1379
GOR 1 19958 4979 237 87291 2739
5 23672 4466 182 139192 5000
10 20313 3229 108 127550 4480
20 15586 2170 89 86982 3014
9
Tab. SI 3. Continued.
Red fluorescence (Chlorophyll a)
Orange fluorescence (Phycoerythrin)
Size class Pico Nano I Nano II Pico Nano
Station Depth [m] [cells mL-1] [cells mL-1] [cells mL-1] [cells mL-1] [cells mL-1]
BY21 1 108591 3099 19 2384 321
10 75872 1997 22 11328 347
40 2880 34 2 1385 55
60 1577 27 0 700 12
70 764 18 0 206 24
110 1521 37 5 855 24
BY31 1 92359 2254 29 834 177
10 86426 1689 19 2990 232
40 2022 84 7 2243 69
60 1524 59 2 1294 24
70 908 43 0 613 17
110 1735 82 0 1181 17
180 1339 75 0 946 34
250 1593 80 2 949 36
300 1521 48 0 1047 17
350 1608 57 0 908 12
400 1548 73 0 1047 22
430 1562 68 0 875 19
OMTF
0240 1 80148 1600 77 861 182
10 78887 1516 48 3159 264
40 1956 57 0 1596 46
70 731 9 0 741 29
110 1803 48 0 1004 58
157 1920 59 0 1119 31
BY36 1 80160 1600 77 2601 206
10 78880 1516 48 4434 273
40 1961 57 0 2881 46
60 731 9 0 331 17
110 1757 48 0 479 62
130 1898 59 0 1484 36
10 Tab. SI 3. Continued.
Red fluorescence
(Chlorophyll a) Orange fluorescence
(Phycoerythrin)
Size class Pico Nano I Nano II Pico Nano
Station Depth [m] [cells mL-1] [cells mL-1] [cells mL-1] [cells mL-1] [cells mL-1]
BY39 1 108511 1324 29 3001 209
10 92303 1418 24 8119 302
25 8131 281 12 15880 256
40 5295 126 0 5041 46
Hanöbukten 1 10611 1333 46 7725 597
10 10405 1148 96 22937 1901
22 10309 630 74 51931 1589
40 2929 59 5 3183 187
74 7332 64 2 1239 34
OMTF0102 1 1553 62 12 6997 417
10 7713 482 36 37884 1848
23 4657 1146 41 7637 1117
36 4451 1404 46 10556 1093
Method description
Depth integrated estimates of daily net primary production at sites of available light measurements
The derivation of daily, depth-integrated net primary production rate estimates involves six consecutive analysis steps:
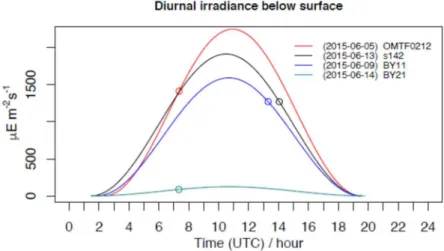
1) Reconstruction of the full diurnal cycle as a function of date, time, longitude and latitude, based on irradiance measurement directly below the sea surface (Fig. SI 1) 2) Application of Beer-Lambert law for deriving attenuation coefficients of the measured
irradiance profiles, as well as for determining depths of the euphotic zone (Fig. SI 2A) 3) Calculation of total daily irradiance with depth (integral over 24 hours), combining
information from step 1) and 2)
4) Assigning the different light levels of the incubation data to depths of identical total daily irradiance (Fig. SI 2B)
5) Fitting exponential function to four data subsets at respective stations, each fit representing a depth profile of net primary production, PP-TOC(z) and PP-DOC(z) (Fig.
SI 3)
6) Calculation of the depth-integrals (integral over depth of the euphotic zone), using the individual profiles fitted to the data subsets
For the reconstruction of the diurnal cycles we applied the R-package ‘suncalc’
(https://github.com/datastorm-open/suncalc) written by Benoit Thieurmel. For every subsample of PP-TOC and PP-DOC data we removed one measurement but for the incubation at the lowest light level (5-7 µE m
-2s
-1). We learned that the removal of data points of the lowest light level can become problematic and may yield unreasonable fits to the data, which was the case for one station. For reasons of consistency we decided not to remove those particular data at all stations. Eventually, the station’s mean values and standard deviations of the individual depth integrals are those listed in Tab. 2.
11
Fig. SI 1. Reconstructed diurnal cycles of irradiance below the ocean surface for four selected stations. The circles indicate the exact time of measurement. For extrapolation we assume weather conditions at the time of measurement to be representative, keeping them constant throughout the respective days. Note that the time was normalized to UTC, avoiding problems with the different time zones along the track.
Fig. SI 2. A) Measured and fitted depth profiles of irradiance for four selected stations, with
similar and distinct light attenuations, as well as different surface irradiance, depending on the
local weather conditions. B) Calculated total irradiance levels at depths, combining information
about diurnal cycle and light measurements. Circles reveal the derived depth levels that
correspond with the total light levels of the incubation experiments. Crosses indicate the depths
of the euphotic zone.
12
Fig. SI 3. A) Depth profiles of net primary production of total organic carbon (PP-TOC) and
B) of dissolved organic carbon (PP-DOC). The ensembles of curves represent individual fits to
data subsets, revealing the range of uncertainty of these fits. Crosses show respective depths of
the euphotic zone. Every single fit is integrated over the euphotic zone, providing at least four
estimates of intPP-TOC and inPP-DOC at every station. Means of these estimates are eventually
used for our analysis.
13
Fig. SI 4. Depth profiles of oxygen, hydrogen sulfide, nitrate and nitrite in the Baltic Sea during June 2015.
Nitrate, Sulfide [µmol L-1]
0 1 2 3 4 5
Depth [m]
0 50 100 150 200 250
Oxygen [µmol L-1] 0 100 200 300 400 500 600
Nitrite [µmol L-1] 0.00 0.05 0.10 0.15 0.20
Nitrate, Sulfide [µmol L-1]
0 1 2 3 4 5 6 7
0 50 100 150 200 250
Oxygen [µmol L-1] 0 100 200 300 400 500
Nitrite [µmol L-1] 0.00 0.05 0.10 0.15 0.20
BY10 BY11
Oxygen [µmol L-1] 0 100 200 300 400 500 0
50 100 150 200 250
Nitrite [µmol L-1] 0.00 0.05 0.10 0.15 0.20
Nitrate, Sulfide [µmol L-1]
0 2 4 6 8
BY15
Nitrate, Sulfide [µmol L-1]
0 1 2 3 4 5 6 7
Depth [m]
0 50 100 150 200 250
Oxygen [µmol L-1] 0 100 200 300 400 500
Nitrite [µmol L-1] 0.00 0.05 0.10 0.15 0.20
BY21
Nitrate, Sulfide [µmol L-1]
0 1 2 3 4 5 6 7
0
100
200
300
400
Oxygen [µmol L-1] 0 100 200 300 400 500
Nitrite [µmol L-1] 0.00 0.05 0.10 0.15 0.20 0.25
BY31
Nitrate, Sulfide [µmol L-1]
0 2 4 6 8 10
0
50
100
150
200
Oxygen [µmol L-1]
0 100 200 300 400
Nitrite [µmol L-1] 0.00 0.05 0.10 0.15 0.20
OMTF0240
Nitrate, Sulfide [µmol L-1] 0 2 4 6 8 10 12 14 16 18 20
Depth [m]
0
50
100
150
200
Oxygen [µmol L-1] 0 100 200 300 400 500
Nitrite [µmol L-1] 0.00 0.05 0.10 0.15 0.20
BY36
Oxygen
Hydrogen Sulfide Nitrate
Nitrite