Biparental immune priming in the pipefish Syngnathus typhle – Supplementary Figures
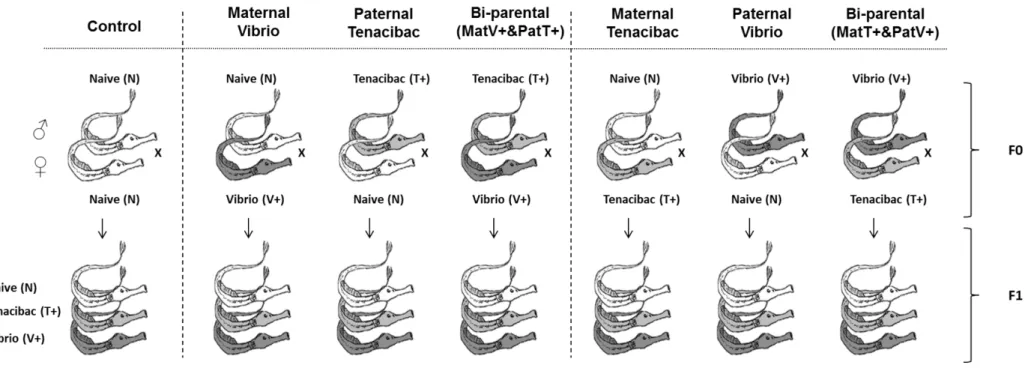
Fig. S1. Experimental design to explore maternal, paternal and biparental immune priming effects and parental bacteria specificity in the pipefish Syngnathus typhle. In total seven parental treatment groups were set up, with each sex of the parents exposed either to a different bacterial strain or without any treatment: (1) control (both parents naïve); only maternal exposure to (2) Vibrio (MatV+) or (3) Tenacibaculum (MatT+); only paternal exposure to (4) Vibrio (PatV+) or (5) Tenacibaculum (PatT+); both parents exposed to different bacteria: (6) MatV+PatT+ and (7) MatT+PatV+. At 1 week and 4 months post birth, F1 offspring were exposed to the homologous or heterologous bacteria as their parents or received no challenge as controls. To test for uni-parental immune priming effects the parental treatment groups were pooled into the following four groups: 1. Control (naïve); 2. maternal (MatV+ and MatT+); 3. paternal (PatV+ and PatT+); 4. bi-parental (MatV+PatT+ and MatT+PatV+).
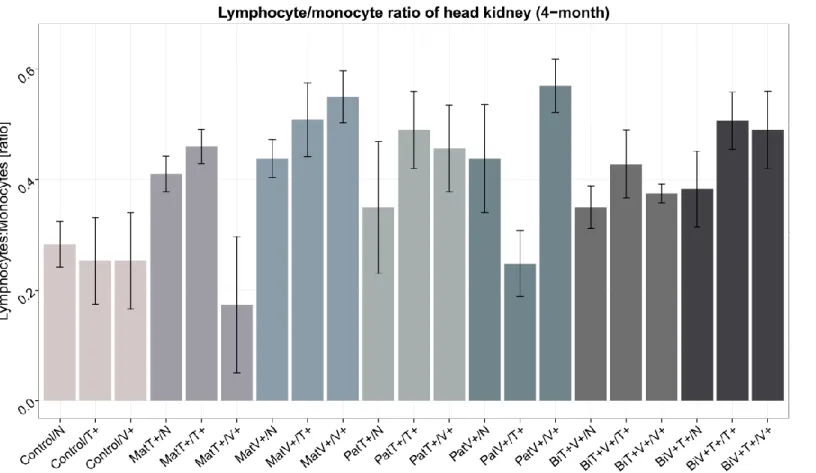
Fig. S2. Lymphocyte/monocyte ratio in head kidney of four-month-old juveniles (N = 126) grouped by F0-parents x F1-offspring interaction terms. Bar plot to visualize maternal and paternal bacteria specificity effects based on lymphocyte/monocyte ratio in the head kidney of four-month-old F1-juveniles. The first term of the annotation indicates the F0-parental treatment (parental control (Control), maternal Vibrio (MatV+) or Tenacibaculum (MatT+), paternal Vibrio (PatV+) or Tenacibaculum (PatT+), or bi-parental (Bi-(MatV+PatT+) / Bi-(MatT+PatV+)). The second term indicates the respective F1-offspring treatment (Vibrio (V+), Tenacibaculum (T+) and control (N). Error bars represent the standard error of the mean (+/-sem).
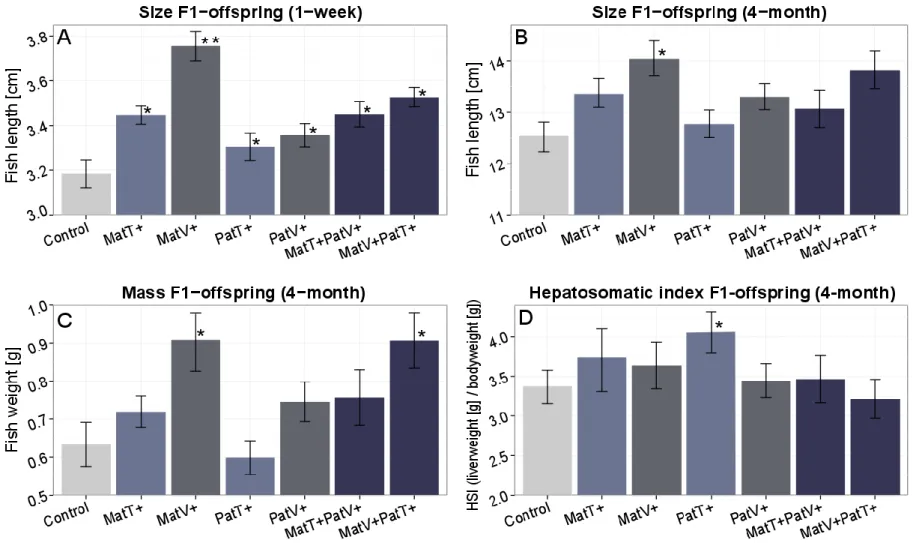
Fig. S3. Parental treatment effects based on life history parameters of one-week-old juveniles (N = 420) and four-month-old juveniles (N = 126). Bar plots are grouped according to F0-parental treatments (parental control (Control), maternal Vibrio (MatV+) or Tenacibaculum (MatT+), paternal Vibrio (PatV+) or Tenacibaculum (PatT+), biparental (Bi-(MatV+PatT+) or Bi-(MatT+PatV+)). Error bars represent the standard error of the mean (+/- sem). (A) size of one-week- old juveniles, (B) size of four-month-old juveniles, (C) mass (body weight) of four-month-old juveniles, (D) hepatosomatic index (HSI) of four-month-old juveniles.
Asterisks denote significant differences compared to the control group. The double asterisk in (A) denotes significant differences compared to the control group and the other treatment groups.
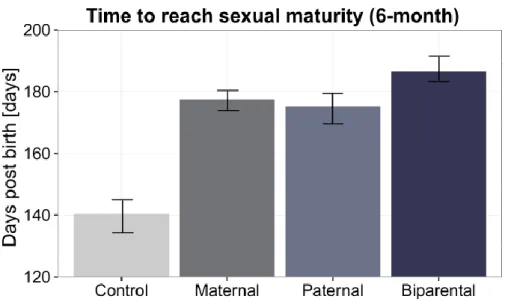
Fig. S4. Parental treatment effects on the time for F1-males to reach sexual-maturity (N = 170). Bar plot is grouped according to F0-parental treatments (parental control, maternal, paternal and biparental) and represents the time (days post birth) F1-males needed to create functional brood pouch tissue and reach sexual maturity. Error bars represent the standard error of the mean (+/-sem).