Biparental immune priming in the pipefish Syngnathus typhle
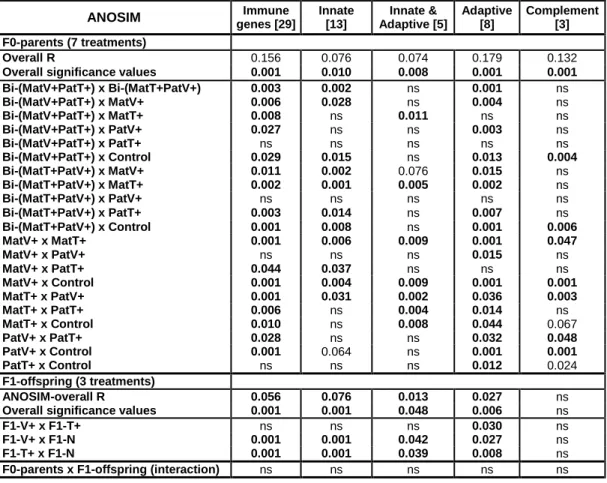
Table S3. Results from ANOSIM analysis of 29 immune genes to test for F0-parental and F1-offspring treatment effects in four-month-old F1-juveniles. Multivariate ANOSIM analysis to assess differences in the gene expression profiles per parental treatment group applying pairwise comparison to relative gene expression data (−∆Ct-values) based on a Bray-Curtis distance matrix and 999 permutations. Significant p-values are presented in boldface, “ns” indicates no statistically significatn difference. Shown are overall R and significance values over two main treatments (F0-parents and F1-offspring) and their interactions. These are followed by pairwise comparisons between parental control (Control), paternal Vibrio (PatV+) and Tenacibaculum (PatT+), maternal Vibrio (MatV+) and Tenacibaculum (MatT+), biparental (Bi-(MatV+PatT+); Bi-(MatT+PatV+)) treatment groups as well as pairwise comparisons between direct offspring treatments Vibrio (F1-V+), Tenacibaculum (F1-T+), and Naïve (F1-N). ANOSIM analysis was conducted for all target genes (44) and grouped into the following functional gene categories: genes of the innate immune system (13), of the innate and adaptive immune system (5), of the adaptive immune system (8), complement component genes (3).
ANOSIM
genes [29] ImmuneInnate [13]
Innate &
Adaptive [5]
Adaptive [8]
Complement [3]
F0-parents (7 treatments)
Overall R 0.156 0.076 0.074 0.179 0.132
Overall significance values 0.001 0.010 0.008 0.001 0.001
Bi-(MatV+PatT+) x Bi-(MatT+PatV+) 0.003 0.002 ns 0.001 ns
Bi-(MatV+PatT+) x MatV+ 0.006 0.028 ns 0.004 ns
Bi-(MatV+PatT+) x MatT+ 0.008 ns 0.011 ns ns
Bi-(MatV+PatT+) x PatV+ 0.027 ns ns 0.003 ns
Bi-(MatV+PatT+) x PatT+ ns ns ns ns ns
Bi-(MatV+PatT+) x Control 0.029 0.015 ns 0.013 0.004
Bi-(MatT+PatV+) x MatV+ 0.011 0.002 0.076 0.015 ns
Bi-(MatT+PatV+) x MatT+ 0.002 0.001 0.005 0.002 ns
Bi-(MatT+PatV+) x PatV+ ns ns ns ns ns
Bi-(MatT+PatV+) x PatT+ 0.003 0.014 ns 0.007 ns
Bi-(MatT+PatV+) x Control 0.001 0.008 ns 0.001 0.006
MatV+ x MatT+ 0.001 0.006 0.009 0.001 0.047
MatV+ x PatV+ ns ns ns 0.015 ns
MatV+ x PatT+ 0.044 0.037 ns ns ns
MatV+ x Control 0.001 0.004 0.009 0.001 0.001
MatT+ x PatV+ 0.001 0.031 0.002 0.036 0.003
MatT+ x PatT+ 0.006 ns 0.004 0.014 ns
MatT+ x Control 0.010 ns 0.008 0.044 0.067
PatV+ x PatT+ 0.028 ns ns 0.032 0.048
PatV+ x Control 0.001 0.064 ns 0.001 0.001
PatT+ x Control ns ns ns 0.012 0.024
F1-offspring (3 treatments)
ANOSIM-overall R 0.056 0.076 0.013 0.027 ns
Overall significance values 0.001 0.001 0.048 0.006 ns
F1-V+ x F1-T+ ns ns ns 0.030 ns
F1-V+ x F1-N 0.001 0.001 0.042 0.027 ns
F1-T+ x F1-N 0.001 0.001 0.039 0.008 ns
F0-parents x F1-offspring (interaction) ns ns ns ns ns