pipefish Syngnathus typhle
Anne Beemelmanns & Olivia Roth
Helmholtz-Centre for Ocean Research Kiel (GEOMAR), Evolutionary Ecology of Marine Fishes, D€usternbrooker Weg 20, 24105 Kiel, Germany
Keywords
Bacteria specificity, epigenetic inheritance, host–parasite interactions, nongenetic inheritance, transgenerational immune priming.
Correspondence
Anne Beemelmanns, Helmholtz-Centre for Ocean Research Kiel (GEOMAR), D€ustenbrooker Weg 20, 24105 Kiel, Germany.
Tel: +49 431 600-4566;
Fax: +49 431 600-4553;
E-mail: abeemelmanns@geomar.de Funding Information
This study was financed by a grant from the German Research Foundation (DFG) to OR and a grant from the Volkswagenstiftung to OR.
Received: 10 February 2016; Revised: 27 July 2016; Accepted: 1 August 2016
doi: 10.1002/ece3.2391
Abstract
The transfer of acquired and specific immunity against previously encountered bacteria from mothers to offspring boosts the immune response of the next generation and supports the development of a successful pathogen defense.
While most studies claim that the transfer of immunity is a maternal trait, in the sex-role-reversed pipefishSyngnathus typhle,fathers nurse the embryos over a placenta-like structure, which opens the door for additional paternal immune priming. We examined the potential and persistence of bacteria-type-specific parental immune priming in the pipefishS. typhle over maturation time using a fully reciprocal design with two different bacteria species (Vibrio spp. and Tenacibaculum maritimum). Our results suggest thatS. typhleis able to specifi- cally prime the next generation against prevalent local bacteria and to a limited extent even also against newly introduced bacteria species. Long-term protec- tion was thereby maintained only against prevailing Vibrio bacteria. Maternal and paternal transgenerational immune priming can complement each other, as they affect different pathways of the offspring immune system and come with distinct degree of specificity. The differential regulation of DNA-methylation genes upon parental bacteria exposure in premature pipefish offspring indicates that epigenetic regulation processes are involved in transferring immune-related information across generations. The identified trade-offs between immune priming and reproduction determine TGIP as a costly trait, which might con- strain the evolution of long-lasting TGIP, if parental and offspring generations do not share the same parasite assembly.
Introduction
On the strong selection imposed by parasites (Hamilton et al. 2008), hosts reacted with the evolution of highly specific immune systems (Schmid-Hempel and Ebert 2003; Boots and Bowers 2004) that have the ability to dif- ferentiate among distinct parasite epitopes (Frank 2002;
Kurtz 2005). Successful parasite clearance is the result of an interplay between genetic specificity and the pheno- typic plastic immunological specificity. The latter (in ver- tebrates also called immune memory) permits a faster and more powerful immune response against previously encountered parasites (Kurtz 2005). To boost the immune system of the descendants, mothers can transfer this indi- vidual experience into the next generation (transgenera- tional immune priming [TGIP]) (Grindstaff et al. 2003;
Little et al. 2003; Sadd et al. 2005; Grindstaff et al. 2006;
Swain et al. 2006; Hasselquist and Nilsson 2009; Roth et al. 2009; Jimenez de Oya et al. 2011; Roth et al. 2012b;
Ramos et al. 2014; Salmela et al. 2015). In vertebrates, TGIP is of particular importance for early life stages, as it bridges the maturation of the adaptive immune system that only starts after birth (Swain et al. 2002; Grindstaff et al. 2006; Swain et al. 2006; Zapata et al. 2006; Boulin- ier and Staszewski 2008; Hasselquist and Nilsson 2009;
Zhang et al. 2013). With offspring development, TGIP declines (Lindholm et al. 2006), but its consequences can remain over several generations (Beemelmanns and Roth 2016 in review; Ismail et al. 2015; Norouzitallab et al.
2015).
While in most species (invertebrates and vertebrates) mothers deposit immunological substances directly into the eggs, species with some particular form of parental investment can additionally transfer their immunological
experience during pregnancy and via breastfeeding or crop feeding (Patterson et al. 1962; Brambell 1970; Van- deputte-Poma 1980; Reuman et al. 1983; Jacquin et al.
2012). As sperm were considered to be too small to deposit more than just the DNA (Wassarman et al. 2001) and fathers mostly lack a close physical connection to their offspring, TGIP was traditionally assumed to be lim- ited to mothers. The recent discovery of paternal immune priming, both in invertebrates (Roth et al. 2010; Zanchi et al. 2011; Eggert et al. 2014) and in the vertebrate Syng- nathus typhle (Roth et al. 2012b), emphasizes the impor- tance of paternal effects (Crean and Bonduriansky 2014;
Kaufmann et al. 2014). The sex-role-reversed pipefish S. typhlemight be a unique case as males have an extraor- dinary close connection to their offspring during preg- nancy and nurse their embryos over a placenta-like structure (Roth et al. 2012b). This gives them the mecha- nistic opportunity to transfer immunological substances to their descendants. However, independent of a close physical connection, epigenetic marks can be passed on to the next generation (DNA-methylation patterns and his- tone modifications) (Berger et al. 2009; Kappeler and Meaney 2010; Jablonka and Lamb 2015; Szyf 2015; Gapp and Miska 2016). Over their potential to modify offspring gene expression, these epigenetic marks may directly change the activity and specificity of offspring immune defense (Mukherjee et al. 2015) and facilitate the transfer of specific immune memory across generations (Young- blood et al. 2010; Gomez-Dıaz et al. 2012).
Just like a secondary encounter of a pathogen within lifetime induces immunological specificity, the transferred immunological information is also supposed to be specific to the parentally experienced pathogen genotypes (Little et al. 2003; Roth et al. 2009). Selection for pathogen-spe- cific TGIP is expected to be strongest when parents and offspring share the same environment and have overlap- ping generation times (Garnier et al. 2012). Being born in the parental environment thus enhances the probability to encounter the same pathogen epitopes repeatedly across generations due to the spatial heterogeneous distribution of pathogens (Dybdahl and Lively 1998; Lively and Dyb- dahl 2000). In migratory species without natal homing, the likelihood of repeated pathogen encounters across generations is lower, which should decrease selection for pathogen-specific TGIP.
As induced immunity is costly due to a resource allo- cation trade-off between immune response and other life-history traits (development, maturation, reproduc- tion, growth) (Lochmiller and Deerenberg 2000), the number of pathogens an individual can transfer specific immunity against is limited (Lochmiller and Deerenberg 2000; Schmid-Hempel 2005; Ardia et al. 2011, 2012;
Contreras-Gardu~no et al. 2014). The probability of
encountering the same pathogen both in the parental and in the offspring generation is thus supposed to influence the specificity, the intensity, and the length of a transgenerational immunization (Tidbury et al. 2011;
Garnier et al. 2012).
The immune system of bony fishes (teleosts) character- izes a transition point between species relying exclusively on the phylogenetically conserved innate immune defense and species using a combination of innate and adaptive immunity (Flajnik and Kasahara 2010; Workenhe et al.
2010; Foey and Picchietti 2014). Due to their limited repertoire of antibodies and slow maturation of their lym- phocytes, teleosts primarily rely on their innate immune defense (Uribe et al. 2011; Foey and Picchietti 2014). The survival of freshly hatched free-living juveniles is enhanced by maternally derived immune components supplied during oogenesis such as antimicrobial peptides, lysosomes, complement components, lectins but also maternal antibodies (Bly et al. 1986; Sin et al. 1994; Hanif et al. 2004; Swain et al. 2006; Swain and Nayak 2009;
Zhang et al. 2013). Syngnathidae(seahorses and pipefish) neither possess a spleen nor a gut-associated lymphatic tissue, in which cells of the adaptive immune system assemble and proliferate (Matsunaga and Rahman 1998).
The recent discovery of an absence of the MHC class II pathway represents a potential secondary reduction of the adaptive immune system (Haase et al. 2013). Due to this loss of a fundamental adaptive immune pathway, we aimed to investigate to what extent this fish species is able to transfer bacteria-type-specific immunity (specificity) from parents to offspring.
We assessed transgenerational bacteria-type-specific immune priming and maternal versus paternal specificity in offspring immune resistance usingS. typhle.The paren- tal generation was exposed to two different allopatric and heat-killed bacteria epitopes (Vibrio spp. and Tenacibacu- lum maritimum) in a fully reciprocal mating design. We determined expression of 29 immune genes as well as immune cell activity of F1-offspring (one-week and four- month-old juveniles), exposed to the same (homologous) or the other bacteria isolate (heterologous) as their par- ents. This approach facilitated (i) the disentangling of the degree of parental bacteria-type-specific immune priming (specificity) over juvenile development and (ii) the extent of parental sex-specific influences on different offspring immune pathways (innate and adaptive immune pathway, complement component system). To address the role of epigenetics in TGIP, we evaluated (iii) expression of genes associated with epigenetic regulation processes (DNA- methylation and histone modifications). Finally, we inves- tigated (iv) whether the channeling of energy resources to parental immune priming bears costs in terms of disad- vantages in other life-history traits.
Material and Methods
Parental generation (F0-treatment)
The parental pipefish generation was sampled, main- tained, and treated as described in Beemelmanns and Roth (2016). Adult individuals received an injection with 50lL of 108cells/ml heat-killed bacteria as immune chal- lenge (Beemelmanns and Roth 2016). In our experimental design, always one sex of a mating pair was vaccinated with either Vibrio spp. (Italy species, I2K3) (Roth et al.
2012a) orTenacibaculum maritimum (Suzuki et al. 2001).
We applied immunologically novel (allopatric) bacteria strains to exclude any pre-adaptation due to previous pathogen encounters in the wild. Upon immune chal- lenge, the parental generation was kept in the following five final mating combinations (Fig. 1): (i) ♀Na€ıve 9♂Tenacibaculum, (ii) ♀Na€ıve9 ♂Vibrio, (iii)
♀Tenacibaculum9 ♂Na€ıve, (iv) ♀Vibrio9♂Na€ıve, and (iv)♀Na€ıve 9♂Na€ıve. The five parental treatment groups (F0-bacteria) were replicated eight times, resulting in 40 breeding pairs (families). All couples mated successfully within one-three days after the immune challenge and juveniles hatched after four weeks of male pregnancy. For further experimental work, we only included families with a minimum clutch size of 15 F1-juveniles; we thus con- tinued the experiment with F1-individuals of 20 families.
Filial generation 1 (F1-treatment)
1-week-old offspring (8 days post birth) were exposed to the same heat-killedVibrio(V+) andTenacibaculum(T+) bacteria species used for the parental generation or stayed without any treatment as control (N) (detailed descrip- tion in Beemelmanns and Roth (2016)). For the F1-bac- teria treatment, we used 20 families with an equal distribution of four families per five F0-bacteria treat- ments (Fig. 1). From each family, 15 offspring were ran- domly applied to the three F1-bacteria treatments (five biological replicates per F1-bacteria treatment) resulting in a total number of 300 juveniles. 1-week-old juveniles were pricked with a needle dipped in a solution contain- ing 109 cells/mL heat-killed bacteria into the upper sur- face of the skin. After 20 h of incubation, their standard length was measured and whole-body samples were used for RNA extraction (detailed description in Beemelmanns and Roth (2016)).
Remaining F1-offspring were pooled within their par- ental treatment groups and transferred into 36 cm9 80 cm aquaria connected to a semi-flow- through circulation system using three tank replicates (density of 20 pipefish) per parental treatment for further rearing. For comparing TGIP effects between different maturation stages, four-month-old juveniles were exposed to the same procedure as the one-week-old juveniles, but
X X
Tenacibac (F0-T+)
F0
F1 X
X
♂
F0-Naïve
Paternal Maternal
Paternal Maternal
(C)
F0-Tenacibaculum F0-Vibrio
(A) (B)
Naïve (F0-N)
Naïve (F0-N)
Naïve (F0-N)
Naïve (F0-N)
Naïve (F0-N)
Naïve (F1-N)
Tenacibac (F0-T+)
Vibrio (F0-V+)
♀
Vibrio (F1-V+)
Vibrio (F1-V+)
Naïve (F0-N) X
Tenacibac (F0-T+)
Figure 1. Experimental design to explore bacteria-type-specific immune priming in the pipefishSyngnathus typhleover one generation. In total, we analyzed 300 one-week-old and 90 4-month-old F1-offspring of parental breeding pairs that received according to F0-sex different F0-bacteria treatments: (A) F0-Na€ıve: no immune challenge for both parents (Na€ıve-“F0-N”); (B) F0-Tenabibaculum: maternal immune challenge with Tenacibaculum(“Mat F0-T+”); paternal: paternal immune challenge withTenacibaculum(“Pat F0-T+”); (C) F0-Vibrio: challenge withVibrio(“Mat F0-V+”); paternal: paternal challenge withVibrio (“Pat F0-V+”). Each of the five parental treatment combinations was replicated four times resulting in 20 families per F0-parental treatment group. F1-offspring were exposed to the same heat-killedVibrio(“F1-V+”) andTenacibaculum (“F1-T+”) bacteria species used for the parental generation or stayed without any treatment as control (“F1-N”).
injected intraperitoneally with 20lL 108 cells/mL heat- killed bacteria solution (F1-V+, F1-T+) or stayed na€ıve (F1-N) using three biological replicates per F1-bacteria treatment. In sum, 18 individuals of the five parental treatment groups were randomly collected out of the three tanks, resulting in a total number of 90 sampled juveniles. After incubation (20 h), body standard length and body mass were measured before the fish were sacri- ficed (detailed description in Beemelmanns and Roth (2016). Life-history parameters (body size, mass, and liver weight) were collected, and a hepatosomatic index (HSI) was calculated as defined in Beemelmanns and Roth (2016). For characterizing the humoral innate and adap- tive immune response, we measured the absolute number of lymphocytes and monocytes in the blood and head kidney according to the protocol of Roth et al. (2011).
As one-week-old juveniles were too small to dissect specific immune organs whole-body samples were used for gene expression analysis, while for four-month-old juveniles, immunological active gill tissue was sampled.
Accordingly, the RNA was extracted of 300 whole-body samples of early-stage juvenile pipefish (one week post birth) and 90 gill tissue samples of late-stage juvenile pipefish (four months post birth). In the further analysis, tissue-specific gene expression effects were taken into consideration.
The expression of 44 target genes and four housekeep- ing genes was measured for all 390 samples using a Flu- idigm BioMarkTM based on 96.96 dynamic arrays according to Beemelmanns and Roth (2016). The house- keeping genes ubiquitin (Ubi) and ribosome protein (Ribop) revealed the highest stability (geNorm M> 0.85), and their geomean was used to quantify relative gene expression of each target gene by calculatingΔCt values (Beemelmanns and Roth 2016). We assessed target genes of following functional categories: (i) innate immune sys- tem, (ii) adaptive immune system, (iii) innate and adap- tive immune genes, (iv) complement system, and (v) epigenetic modulators (DNA methylation, histone de/
methylation, histone de/acetylation) (Beemelmanns and Roth 2016).
Remaining F1-offspring were raised until they reached sexual maturity (approximately six-seven months post birth) while they stayed without any immune treatment and time point of first reproduction was assessed. When F1-individuals were sexually mature, they were crossed within the F0-treatment groups and their clutch size was recorded.
Data analysis and statistics
We evaluated whether gene expression (immune genes and epigenetic regulation genes), immune cell counts, and life-
history traits of juvenile pipefish from two consecutive age classes (one-week-old and four-month-old) revealed bacte- ria-type-specific effects upon the acute offspring exposure (“F1-bacteria”) and the parental challenge (“F0-bacteria”).
Secondly, we explored whether offspring that received the same bacterial isolate as the parents (homologous) showed an enhanced immune response (immunological specificity) compared to those that experienced different bacteria expo- sures (heterologous) as their parents. To do so, we exam- ined statistically and graphically the “F0-bacteria” 9
“F1-bacteria” challenge interaction. Thirdly, we analyzed parental sex-specific (“F0-sex”) immune priming differ- ences to investigate whether mothers and/or fathers equally provide protection against previously encountered bacteria.
For the identification of maternal and/or paternal immune priming specificity, we explored statistically the “F0- bacteria” 9“F1-bacteria”9“F0-sex” interaction term;
family or tank was included as random term.
The data analysis was performed in R v 3.2.2 (R Core Team 2015) and PRIMERv6 (Clarke and Gorley 2006) according to Beemelmanns and Roth (2016). A permuta- tional multivariate analysis of variance (PERMANOVA) was applied for immune gene expression (29 target genes) as well as epigenetic regulation genes (15 target genes) of one-week-old juveniles (300 samples) and four-month-old F1-juveniles (90 samples). For the latter, we further assessed life-history parameters (body size, body mass, hepatoso- matic index (HSI)), and immune cell count measurements (lymphocyte/monocyte counts of blood and head kidney).
The PERMANOVA model (“vegan” package–“adonis”
function in R) for each category was based on a Bray–
Curtis matrix of nontransformed values in which we tested for the effects of “F0-bacteria,” “F0-sex,” and “F1- bacteria” treatments and their interactions. The PERMA- NOVA was conducted by permuting treatments 1000 times and stratifying permutations within each family or tank replicate. To correct for the possible dependence between response variable and body size of the F1-juve- niles, we included standard length as a covariate in the PERMANOVA model. The analysis of similarity (ANO- SIM) was performed with the software PRIMERv6 (Clarke 1993; Clarke and Gorley 2006) based on a Bray–
Curtis distance matrix and 4th-root transformation to disentangle differences between parental and offspring treatment groups using a pairwise comparison (Brazma and Vilo 2000). Further, we applied a between-class anal- ysis (BCA), which is a particular case of a principal com- ponent analysis (“ade4” package – “bca” function in R) to investigate graphical clustering according to the respec- tive treatment group of interest (Doledec and Chessel 1987; Thioulouse et al. 1995; Chessel et al. 2004). We performed a BCA of the gene categories of interest (im- mune genes, epigenetic genes) and immune cell count
measurements. In addition, we evaluated the percentage of variance retained by the first two principal components (PCs) and calculated the variance explained by each response variable (gene contribution % to the total iner- tia) on PC1 and PC2. Genes with a contribution of above 25% summed average contribution were considered as
“important genes” which added the highest variance to the dimensional space (Kassambara 2015). Further, we applied statistical univariate approaches for life-history parameters and immune cell count measurements and focused on bacteria species-specific immune priming effects. Hereupon, a linear mixed-effect model was fitted for each response variable using the fixed interaction term
“F0-bacteria”9“F1-bacteria”, while including family or tank as random term and implementing “size of juve- niles” as a covariate. In addition, body size of F1-juveniles was assessed separately as a phenotypic trait using the same model without a covariate. The linear mixed-effect model was performed with the “lmer” function imple- mented in the “lme4” package of R (Bates et al. 2014) using type III sum of squares and Satterthwaite approxi- mation for the degrees of freedom. All significant LMERs were followed by post hoc t-tests applying the “ghlt”
function associated in the “multcomp” package of R (Hothorn et al. 2008) for multiple comparisons of “F0- bacteria”9“F1-bacteria” interaction terms.
To assess life-history traits of 6-month-old F1-offspring (time point of maturity and clutch size), a linear mixed- effect model (“nmle” package – “lme” function in R) according to Bates et al. (2014) was applied including the fixed factor “F0-bacteria” and the random-term “tank” in the model. Finally, a correlation analysis was applied to connect the biological relevance of gene expression pat- terns and immune parameters (“PerformanceAnalytics”
package in R). Using a Pearson correlation matrix, we correlated each single gene (ΔCt values) with each immune cell measurement in order to determine whether or not particular immune genes can be used as indicators for direct immune performance (Birrer et al. 2012).
Results
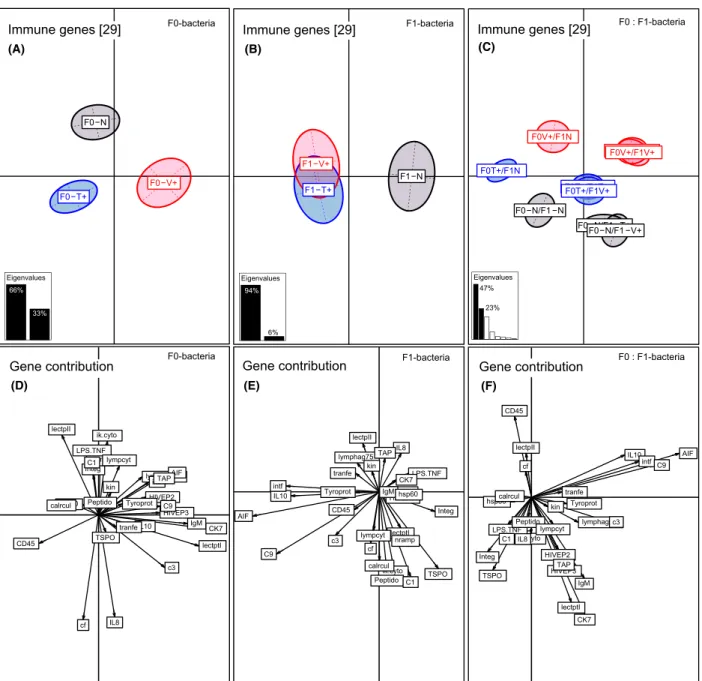
Bacteria-type-specific immune priming effect (F0-bacteria treatment effect) One-week-old F1-juveniles: gene expression Parental bacteria treatment (F0-Vibrio or F0-Tenacibaculum) changed the immune gene expression profiles in one- week-old F1-offspring (PERMANOVA-immune F2,284=10.21, P<0.001; Table 1, Fig. 2A). On the BCA Axis 1 (66% variation), the two parental bacteria treat- ments clustered apart from the control on opposite
sides, demonstrating a strong parental treatment effect (ANOSIM-immune F0-V+ vs. F0-N P=0.002; F0-T+ vs.
F0-NP= 0.001; Table S1). Also, the two parentalVibrio and Tenacibaculum bacteria treatments significantly clus- tered opposed to each other (ANOSIM-immune F0V+ vs.
F0T+ P= 0.001; Table S1, Fig. 2A), leading to a triangle shape, representing a bacteria-type-specific immune prim- ing effect. A similar pattern was identified for innate immune genes (PERMANOVA-innate F2,284= 11.88, P<0.001; Table 1), innate and adaptive immune genes (PERMANOVA-innate & adaptive F2,284=12.37, P<0.001; Table 1), adaptive immune genes (PERMA- NOVA-adaptive F2,284=7.42, P=0.027; Table 1), and complement component genes (PERMANOVA-comple- ment F2,284=10.68, P< 0.001; Table 1). For the latter two gene categories, only the parental Vibrio treatment revealed a significant effect (ANOSIM-adaptive F0-V+ vs.
F0-N P=0.003; ANOSIM-complement F0-V+ vs. F0-N P=0.006; Table S1). Immune genes explaining the Vib- rio-specific immune priming effect were chemokine 7 (17%), lectin protein I (15.5%), immunoglobulin light chain (12%), complement component 3 (6%), and HIVEP3 (6%) (Axis 1, 66%) (Table S3, Fig. 2D). In con- trast, the following genes were driving theTenacibaculum- specific immune priming effect: CD45 (6%) (Axis 1, 66%) and coagulation factor II (19%), interleukin-8 (18%), lectin II (11%) (Axis 2, 33%) (Table S3, Fig. 2D).
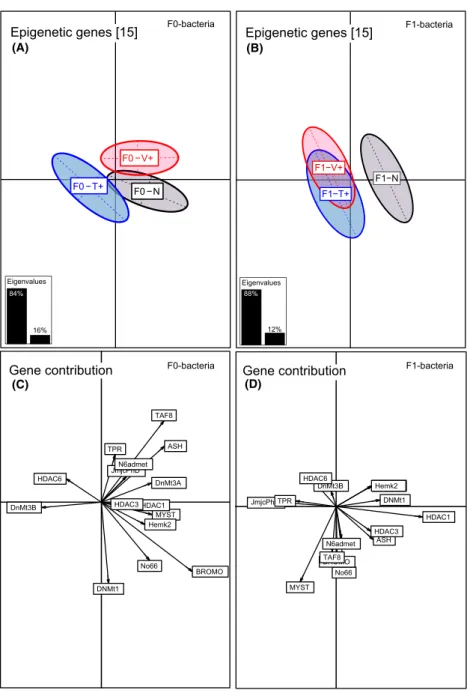
Although genes associated with epigenetic regulation mechanism were differentially regulated upon parental immune challenge (PERMANOVA-epigen F2,284=1.77, P<0.001; Table 1, Fig. 3A), pairwise comparison between parental treatments solely revealed a significant difference between F0-Vibrio and F0-Tenacibaculum treatment, but no differences between F0-bacteria treat- ments and F0-na€ıve group (ANOSIM-epigen F0-V+ vs.
F0-T+ P=0.001; Table S1). Epigenetic regulation genes with a high average contribution were histone acetyltrans- ferase KAT2B (BROMO) (25%), transcription factor 8 (11%), histone methyltransferase (ASH2) (12%), DNA- methyltransferase 3b (10%), DNA-methyltransferase 3a (8%), lysine-specific demethylase (No66) (7%), and his- tone acetyltransferase (7%) (Axis 1, 87%) (Table S5, Fig. 3C).
Four-month-old F1-juveniles: gene expression In four-month-old juveniles, we found significantly altered expression profiles among the three parental bacteria treat- ment groups (PERMANOVA-immune F2,92=4.90, P=0.021; Table 2, Fig. 4A). In contrast to the results from one-week-old juveniles, the F0-bacteria treatment effect is only preserved for the F0-Vibrio challenge (ANOSIM- immune F0-V+ vs. F0-N P<0.001; Table S2). In the
Table1.ResultsfromPERMANOVAofgeneexpressionofone-week-oldF1-juveniles. One-week-oldTotalResidualsF0-bacteriaF1-bacteriaF0-sexF0-bacteria9F1-bacteria DFDfDfF.ModelPr(>F)sigDfF.ModelPr(>F)sigDfF.ModelPr(>F)sigDfF.ModelPr(>F)sig Immunegenes[29]299284210.210.001***26.630.001***15.760.001***40.82ns Innateimmunegenes[13]299284211.880.001***26.280.001***12.720.001***40.78ns Innate&adaptivegenes[5]299284212.370.001***27.180.001***116.970.001***41.12ns Adaptiveimmunegenes[8]29928427.420.027*21.160.05913.540.027*40.65ns Complementcomponentgenes[3]299284210.680.001***219.400.001***12.560.001***41.28ns Epigeneticgenes[15]29928421.770.001***22.040.001**15.680.001***40.89ns DNA-methylationgenes[5]29928421.500.003**21.280.037*111.030.003**40.67ns Histonede/methylationgenes[4]29928421.340.001***22.670.003**12.630.001***40.79ns Histonede/acetylationgenes[5]29928422.860.001***22.950.001***12.400.001***41.330.006** TotalResidualsF0-bacteria9F0-sexF0-sex9F1-bacteriaF0-bacteria9 F1-bacteria9F0-sexSizecovariate DFdfDfF.ModelPr(>F)sigDfF.ModelPr(>F)sigDfF.ModelPr(>F)sigDfF.ModelPr(>F)sig Immunegenes[29]29928416.680.001***21.510.002**20.95ns14.27ns Innateimmunegenes[13]29928418.790.001***21.650.003**20.66ns15.99ns Innate&adaptivegenes[5]29928417.160.012*21.15ns20.84ns13.350.043* Adaptiveimmunegenes[8]29928415.230.005**20.97ns21.170.047*11.31ns Complementcomponentgenes[3]29928410.940.001***22.050.039*21.00ns16.58ns Epigeneticgenes[15]29928415.840.001***21.940.003**20.60ns16.06ns DNA-methylationgenes[5]29928411.560.008**22.200.008**20.68ns18.240.035* Histonede/methylationgenes[4]29928415.230.005**23.090.005**20.99ns17.930.049* Histonede/acetylationgenes[5]299284113.950.003**20.47ns20.34ns11.14ns MultivariatePERMANOVAtoassesstheeffectandinteractionofthethreefixedfactorsF0-parents,F0-sex,andF1-offspring,sizeascovariateandfamilyasstratatermonrelativegeneexpression values(ΔCtvalues).EachanalysiswasbasedonaBray–CurtisdistancematrixwithP-valuesobtainedby999permutations.SignificantP-valuesaremarkedinboldletters(significancecode: <0.001***,0.001**,0.01*,0.1>P-value≥0.05trend),whereas“ns”indicatesnostatisticaldifference.
BCA, this is depicted by a sidewise-shifted triangle shape, whereby only the parental F0-Vibrio treatment group significantly clusters along the first axis (89%
variation) opposed to the parental F0-control group (Fig. 4A). In turn, the parental F0-Tenacibaculum treat- ment did not influence the gene expression of four- month-old juveniles significantly (ANOSIM-immune F0-
T+ vs. F0-N P=0.256; Table S2, Fig. 4A). This F0-Vib- rio-specific parental immune priming effect was main- tained by innate immune genes (PERMANOVA-innate F2,92=3.14, P< 0.001, Table 2; ANOSIM-innate F0-V+
vs. F0-N P=0.005; Table S2). The following immune genes contributed to the Vibrio-specific immune priming effect in four-month-old juveniles: complement Immune genes [29]
F1−N F1−T+
F1−V+
(B)
d=0.2
lymphag75
HIVEP2 HIVEP3
CD45 Integ
IgM lectpII
lectptI cf
hsp60
ik.cyto IL10
kin
nramp AIF
TSPO LPS.TNF tranfe
calrcul intf
TAPIL8
Peptido Tyroprot
CK7
c3
C1 C9
lympcyt Eigenvalues
Immune genes [29]
F0−N/F1 −N
F0−N/F1 −T+
F0−N/F1 −V+
F0T+/F1N
F0T+/F1T+
F0T+/F1V+
F0V+/F1N
F0V+/F1T+F0V+/F1V+
d=0.2
lymphag75
HIVEP2 HIVEP3 CD45
Integ
IgM lectpII
lectptI cf
hsp60
ik.cyto
IL10
kin
nramp
AIF
TSPO LPS.TNF
tranfe calrcul
intf
IL8
TAP Peptido
Tyroprot
CK7 c3 C1
C9
lympcyt Eigenvalues
Immune genes [29]
F0−N
F0−T+
F0−V+
lymphag75 HIVEP2
HIVEP3
CD45
Integ
IgM lectpII
lectptI
cf hsp60
ik.cyto
IL10 kin nramp
AIF
TSPO LPS.TNF
tranfe calrcul
intf
IL8
TAP Peptido Tyroprot
CK7
c3 C1
C9 lympcyt Eigenvalues
F1-bacteria
F0-bacteria F0 : F1-bacteria
(A) (C)
(E)
Gene contribution F1-bacteria
Gene contribution F0-bacteria Gene contribution F0 : F1-bacteria
(D) (F)
66%
33%
94%
6%
47%
23%
Figure 2. Between component analysis (BCA) based on 29 immune genes of one-week-old juveniles (N=300). Different levels of factors were included in the between component analysis. (A) Factor F0-bacteria treatment (F0-Vibrio (F0-V+) in red, F0-Tenacibaculum (F0-T+) in blue, F0- Na€ıve (F0-N) in black); (B) factor F1-bacteria treatment (F1-Vibrio (F1-V+) in red, F1-Tenacibaculum (F1-T+) in blue, F1-Na€ıve (F1-N) in black); (C) factor F1:F0-bacteria treatment interaction. In the underlying scatterplot (D-F), the response variables (immune genes) are symbolized by arrows whereby the direction and the length of the arrows show the quality of the correlation between variables and principle components. The length of the arrow is directional proportional with the contribution of each variable (immune gene) to the total variability. The eigenvalues bar chart is drawn in the left corner, with the two black bars corresponding to the two axes used to draw the BCA plot.
component 3 (13%), tyroproteinkinase (11%), HIVEP3 (10%), HIVEP2 (8%), peptidoglycan recognition protein (7%), heat-shock protein 60 (Hsp60) (6%), kinesin (6%), Nramp (4%), interleukin-8 (5%) (Axis 1, 89%) as well as translocator protein (29%), transferrin (8%), calreticulin (8%), complement component 1 (6%), and
immunoglobulin light chain (8%) (Axis 2, 10%) (Table S4, Fig. 4E).
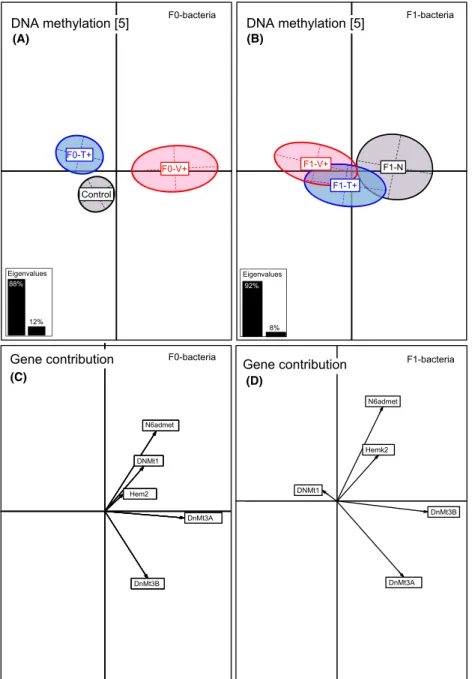
In four-month-old juveniles, solely DNA-methylation genes were affected upon the F0-bacteria treatment (PER- MANOVA-DNA.methyl F2,92=4.30, P=0.020; Table 2) and displayed the same F0-Vibrio-specific pattern as (A)
F0-bacteria
Epigenetic genes [15]
F0 −N F0 −T+
F0 −V+
d=0.2 EpigeneticGenes[15]F0 −Parents
JmjcPhD
No66 TPR
DNMt1
DnMt3A DnMt3B
N6admet ASH
BROMO MYST HDAC1 HDAC3 HDAC6
TAF8
Hemk2 Eigenvalues
Gene contribution F0-bacteria
Epigenetic genes [15]
F1−N F1−T+
F1−V+
d=0.5 EpigeneticGenes[15]F1 −Offspring
JmjcPhD
No66
TPR DNMt1
DnMt3A DnMt3B
N6admet ASH
BROMO
MYST
HDAC1 HDAC3
HDAC6
TAF8
Hemk2 Eigenvalues
Gene contribution
F1-bacteria
(B)
(D)
F1-bacteria
(C)
88%
12%
84%
16%
Figure 3. Between component analysis (BCA) based on epigenetic regultation genes of one-week-old juveniles (N=300). Different levels of factors were included in the between component analysis. (A) Factor F0-bacteria treatment (F0-Vibrio (F0-V+) in red, F0-Tenacibaculum (F0-T+) in blue, F0-Na€ıve (F0-N) in black); (B) factor F1-offspring treatment (F1-Vibrio (F1-V+) in red, F1-Tenacibaculum (F1-T+) in blue, F1-Na€ıve (F1-N) in black). In the underlying scatterplots (C, D), the response variables (epigenetic regultation genes) are symbolized by arrows whereby the direction and the length of the arrows show the quality of the correlation between variables and principle components. The length of the arrow is directional proportional with the contribution of each variable to the total variability. The eigenvalues bar chart is drawn in the left corner, with the two black bars corresponding to the two axes used to draw the BCA plot.
Table2.ResultsfromPERMANOVAofgeneexpressionoffour-month-oldF1-juveniles. Four-month-oldTotalResidualsF0-bacteriaF1-bacteriaF0-sexF0-bacteria9F1-bacteria DFDfDfF.ModelPr(>F)sigDfF.ModelPr(>F)sigDfF.ModelPr(>F)sigDfF.ModelPr(>F)sig Immunegenes[29]1079224.900.021*23.650.001***11.630.021*40.82ns Innateimmunegenes[13]1079223.140.001***24.990.001***11.970.001***40.93ns Innate&adaptivegenes[5]1079224.86ns25.020.001***15.91ns40.53ns Adaptiveimmunegenes[8]1079223.74ns21.92ns10.16ns40.83ns Complementcomponentgenes[3]10792212.34ns20.26ns10.02ns40.74ns Epigeneticgenes[15]1079226.61ns21.21ns11.19ns40.80ns DNA-methylationgenes[5]1079224.300.020*21.27ns11.360.020*41.940.012* Histonede/methylationgenes[4]1079229.88ns21.700.085●10.97ns40.15ns Histonede/acetylationgenes[5]1079226.00ns20.89ns11.63ns40.81ns Immunecellcounts[6]10772212.380.001***23.820.001***11.330.001***40.43ns Immunecellcountsheadkidney[3]10772218.320.001***29.170.001***12.450.004**41.80ns Immunecellcountsblood[3]1077229.830.006**23.220.001***11.620.001***40.23ns TotalResidualsF0-bacteria9F0-sexF0-sex9F1-bacteriaF0-bacteria9F1- bacteria9F0-sexSizecovariate DFDfDfF.ModelPr(>F)sigDfF.ModelPr(>F)sigDfF.ModelPr(>F)sigDfF.ModelPr(>F)sig Immunegenes[29]1079212.970.022*20.25ns21.23ns10.82ns Innateimmunegenes[13]1079211.080.001***20.30ns21.46ns10.52ns Innate&adaptivegenes[5]1079214.40ns20.59ns20.98ns11.35ns Adaptiveimmunegenes[8]1079218.01ns20.31ns22.120.049*10.61ns Complementcomponentgenes[3]1079210.32ns20.37ns20.66ns10.89ns Epigeneticgenes[15]1079211.53ns20.48ns20.82ns10.69ns DNA-methylationgenes[5]1079211.560.014*20.94ns20.82ns10.34ns Histonede/methylationgenes[4]1079211.27ns20.28ns21.51ns11.39ns Histonede/acetylationgenes[5]1079211.85ns20.56ns20.68ns10.80ns Immunecellcounts[6]1077211.29ns20.12ns21.190.050*11.23ns Immunecellcountsheadkidney[3]1077212.86ns22.20ns27.950.009**16.200.003** Immunecellcountsblood[3]1077210.69ns20.22ns20.21ns10.42ns MultivariatePERMANOVAtoassesstheeffectandinteractionofthethreefixedfactorsF0-parents,F0-sexandF1-offspring,sizeascovariateandtankasstratatermonrelativegeneexpression values(ΔCtvalues).EachanalysiswasbasedonaBray–CurtisdistancematrixwithP-valuesobtainedby999permutations.SignificantP-valuesaremarkedinboldletters(significancecode: <0.001***,0.001**,0.01*,0.1>P-value≥0.05trend●),whereas“ns”indicatesnostatisticaldifference.
previously described for innate immune genes (ANOSIM- DNA-methyl F0-V+ vs. F0-N P=0.001; F0-V+ vs. F0-T+
P= 0.002; Table S2, Fig. 5A). De novo methyltransferases DNMT3a (61%) and DNMT3b (18%) (Axis 1, 86%) and DNMT1 (50%) and N6admet-methylferase 36% (Axis 2, 13%) explained the highest variance (Table S6, Fig. 5C).
Four-month-old F1-juveniles: immune cell counts The parental immune challenge of four-month-old F1- offspring significantly affected the number of immune cells (lymphocytes and monocytes) in the head kidney and the blood (PERMANOVA-immune-cells F2,72=12.38, P< 0.001; Table 2, Fig. 4D, 4H). As demonstrated in the BCA, the two parental Vibrio and Tenacibaculumbacteria
treatment groups were significantly clustering apart from the parental control group (ANOSIM-immune-cells F0-T+ vs. F0-N P=0.001; F0-V+ vs. F0-N P=0.001;
Table S2, Fig. 4D) along the first axis (89% variation).
The observed clustering pattern resembles a triangle shape, demonstrating a bacteria-type-specific immune priming effect based on immune cell production (ANO- SIM counts F0T+ vs. F0V+P=0.001; Table S2, Fig. 4D).
Using a statistical univariate approach, each cell count variable was analyzed separately in a linear mixed-effect model (LMER) (Table 3). Particularly, we found an increased lymphocyte/monocyte ratio in the head kidney upon parental bacteria challenge (LMER-LM-ratio.hk F2,34=7.92, P=0.001; Tukey’s HSD: F0-N<F0-T+, F0-N<F0-V+; Table 3, Fig. 6A). The significantly higher
lymphag75
HIVEP2 HIVEP3 CD45 Integ
IgM lectpII
lectptI
cfhsp60 ik.cyto
IL10 nramp kin
AIF TSPO
LPS.TNF
tranfe
calrcul intf
IL8 TAP
Peptido Tyroprot
CK7
C3 C1
C9 lympcyt
ImmuneGenes[29]F0:F1
lymphag75
HIVEP2
HIVEP3
CD45
Integ IgM
lectpII lectptI
cf
hsp60
ik.cyto IL10 kin
nramp AIF
TSPO LPS.TNF tranfe
calrcul intf
IL8
TAP Peptido
Tyroprot
CK7 c3
C1 C9
lympcyt
lymph.blood mono.blood
L.M.blood lymph.hk
mono.hk
L.M.hk
Immune genes [29]
F1−N
F1−T+
F1−V+
F1-bacteria
Immune genes [29]
F0−N/F1 −N
F0−N/F1 −T+
F0−N/F1 −V+
F0T+/F1N
F0T+/F1T+
F0T+/F1V+
F0V+/F1N
F0V+/F1T+
F0V+/F1V+
Eigenvalues
F0−N F0−V+
Lymphocytes/monocytes
Eigenvalues
Immune genes [29]
F0−N
F0−T+
F0−V+
Eigenvalues
F0-bacteria
Eigenvalues
Gene contribution F1-bacteria
Gene contribution Contribution
Gene contribution F0-bacteria
lymphag75 HIVEP2
HIVEP3
Integ IgM
lectpII
cf hsp60
ik.cyto IL10
kin nramp
AIF
TSPO
LPS.TNF
tranfe intf
IL8
TAP Peptido
Tyroprot
CK7 c3
C1 C9
lympcyt 89%
10%
87%
13%
34%
28%
89%
11%
F0-bacteria
F0-bacteria
lectptI
CD45 calrcul
F0−T+
(B)
(A) (C) (D)
(F) (G) (H)
(E)
F0 : F1-bacteria
F0 : F1-bacteria
Figure 4. Between component analysis (BCA) based on 29 immune genes and on immune cell count measurements (lymphocyte and monocyte counts and ratio of head kidney and blood) in four-month-old juveniles (N=90). Different levels of factors were included in the between component analysis. (A&D) Factor F0-bacteria treatment (F0-Vibrio (F0-V+) in red, F0-Tenacibaculum (F0-T+) in blue, F0-Na€ıve (F0-N) in black); (B) factor F1-bacteria treatment (F1-Vibrio (F1-V+) in red, F1-Tenacibaculum (F1-T+) in blue, F1-Na€ıve (F1-N) in black); (C) factor F1:F0-bacteria treatment interaction. In the underlying scatterplots (E–H), the response variables (immune genes and immune cell measurements) are symbolized by arrows whereby the direction and the length of the arrows show the quality of the correlation between variables and principle components.
The length of the arrow is directional proportional with the contribution of each variable to the total variability. The eigenvalues bar chart is drawn in the left corner, with the two black bars corresponding to the two axes used to draw the BCA plot.
proportion of lymphocytes in the blood of F1-offspring with parentalVibriochallenge compared to the na€ıve con- trol group (LMER-L/M-ratio.blood F2,34=5.40, P=0.009;Tukey’s HSD:F0-N< F0-V+; Table 3, Fig. 6B) indicates a higher humoral adaptive immune response specifically against parentalVibriobacteria exposure.
To connect the biological relevance of gene expression and cellular measurements, a correlation analysis was con- ducted for four-month-old F1-individuals (ΔCt values were correlated with cellular immune parameters). The following genes connected to pathways of the innate sys- tem positively correlate with the number of monocytes in the head kidney:Lectin protein II (R2 =0.26, P=0.014),
interferon(R2=0.25,P=0.019),peptidoglycan(R2= 0.30, P=0.004), tyroproteinkinase (R2= 0.23, P=0.032), com- plement component 3 (R2=0.35, P<0.001) (Table S7).
Additionally, the following immune genes displayed a pos- itive correlation with the number of monocytes in the blood: lectin protein I (R2=0.28, P=0.038), Ik-cytokine (R2 =0.23, P=0.029), complement component 3 (R2 =0.23,P= 0.01),lymphocyte antigen 75 (R2= 0.22, P=0.038), and complement subcomponent 1q (R2=0.34, P= <0.001) (Table S7). Furthermore, there was a signifi- cant negative correlation between the number of lympho- cytes and the expression of the adaptive immune genes HIVEP3 (R2 =0.23, P=0.031) and complement (A)
F0-bacteria
DNA methylation [5]
DNA methylation [5]
DNA methylation [5]
DNA methylation [5]
Eigenvalues
DNA methylation [5]
DNA methylation [5]
DNA methylation [5]
DNA methylation [5]
d=0k5 EpigeneticGenes[15]F1 −Offspring
Eigenvalues
Gene contribution
F1-bacteria
(B)
(D)
F1-bacteria
DNMt1
Hem2
DnMt3B N6admet
DnMt3A DNMt1
Hem2
DnMt3B N6admet
DnMt3A DNMt1
Hem2
DnMt3B N6admet
DnMt3A DNMt1
Hem2
DnMt3B N6admet
DnMt3A Control
F0-T+
F0-V+
Gene contribution F0-bacteria
F1-N F1-T+
F1-V+
DNMt1
Hemk2
DnMt3B N6admet
DnMt3A
(C)
88%
12%
92%
8%
Figure 5. Between component analysis (BCA) based on 5 DNA-methylation genes of four- month-old juveniles (N=300). Different levels of factors were included in the between component analysis. (A) Factor F0-bacteria treatment (F0-Vibrio (F0-V+) in red, F0- Tenacibaculum (F0-T+) in blue, F0-Na€ıve (F0-N) in black); (B) factor F1-offspring treatment (F1- Vibrio (F1-V+) in red, F1-Tenacibaculum (F1-T+) in blue, F1-Na€ıve (F1-N) in black). In the underlying scatterplots (C, D), the response variables (DNA-methylation genes) are symbolized by arrows whereby the direction and the length of the arrows show the quality of the correlation between variables and principle components. The length of the arrow is directional proportional with the contribution of each variable to the total variability. The eigenvalues bar chart is drawn in the left corner, with the two black bars corresponding to the two axes used to draw the BCA plot.