INTRODUCTION TO THE
TROPICS
In geographical terminology \the tropics" refers to the region of the earth
bounded by the Tropic of Cancer (lat. 23.5 Æ
N) and the Tropic of Capricorn
(lat. 23.5 Æ
S).Thesearelatitudeswherethesunreachesthezenithjustonceat
the summersolstice. An alternativedenitionwould betochoose theregion
30 Æ
S to30 Æ
N,thereby dividingthe earthssurface intoequalhalves. Dened
in this way the tropics would bethe source of all the angular momentum of
the atmosphere and most of the heat. But is this meteorologically sound?
Some parts of the globeexperience \tropicalweather" fora part of the year
only - southern Florida would be a good example. While Tokyo (36 Æ
N)
frequently experiences tropicalcyclones, called\typhoons" intheNorthwest
Pacic region,Melbourne (37.5 Æ
S) neverdoes.
Riehl(1979)chooses todenethemeteorological\tropics" asthoseparts
of the world where atmospheric processes dier signicantly from those in
higherlatitudes. Withthisdenition,thedividinglinebetweenthe"tropics"
and the \extratropics"is roughly the dividing linebetween the easterly and
westerly wind regimes. Of course, this line varies with longitude and it
uctuates with the season. Moreover, in reality, no part of the atmosphere
exists in isolation and interactions between the tropics and extratropics are
important.
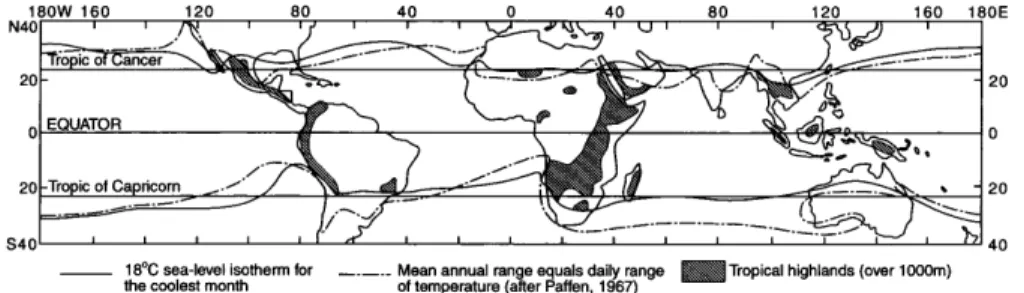
Figure 1.1 shows a map of the principal land and ocean areas within
40 Æ
latitude of the equator. The markedly non-uniform distribution of land
and ocean areas inthis regionmay be expected tohave alarge inuence on
the meteorology of the tropics. Between the Western Pacic Oceanand the
Indian Ocean, the tropical land area is composed of multitude of islands of
various sizes. This region, to the north of Australia, is sometimes referred
to as the \Maritime Continent", a term that was introduced by Ramage
Figure 1.1: Principal land and ocean areas between 40 Æ
N and 40 Æ
S. The
solid line shows the 18 Æ
C sea level isotherm for the coolest month; the dot-
dash line is where the mean annual range equals the mean daily range of
temperature. The shadedareasshow tropicalhighlandsover1000 m. (From
Nieuwolt, 1977)
(1968). Sea surface temperatures there are particularly warm providing an
ample moisture supply for deep convection. Indeed, deep convective clouds
are a dominant feature of the Indonesian Region, so much so that the area
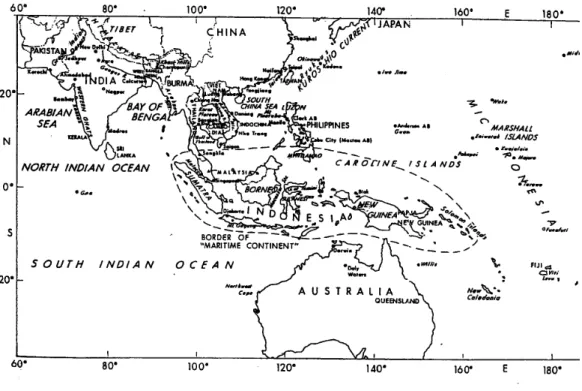
has been called \the boiler-box" of the atmosphere. The Indian Ocean and
West Pacic region with the maritimecontinent delineated is shown inFig.
1.2.
1.1 The zonal mean circulation
Figure 1.3 shows the distribution of mean incoming and outgoing radiation
attheedge oftheatmosphereaveragedzonallyand overayear. Iftheearth-
atmosphere system is in thermal equilibrium, these two streams of energy
must balance. It is evident that there isa surplus of radiativeenergy in the
tropicsandanetdecitinmiddleand inhighlatitudes, requiringonaverage
a poleward transport of energy by the atmospheric circulation. Despite the
surplusof radiativeenergy inthe tropics,the tropicalatmosphereisaregion
of net radiative cooling (Newell et al., 1974). The fact is that this surplus
energy heats the ocean and land surfaces and evaporates moisture. In turn,
some of this heat nds its way into the atmosphere in the form of sensible
and latent heat and it is energy of this type that is transported polewards
by the atmospheric circulation.
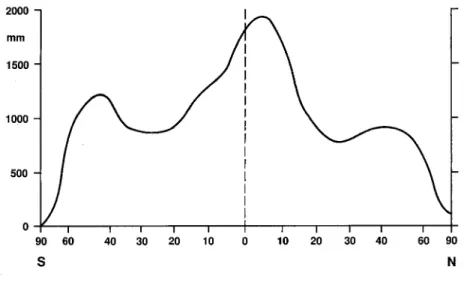
Figure 1.4 shows the zonally-averaged distribution of mean annual pre-
cipitationasfunctionof latitude. Notethatthe precipitationishigherinthe
tropics than inthe extratropics with amaximum atabout 10 Æ
N. When pre-
Figure 1.2: Indian Ocean and Western Pacic Region showing the location
of theMaritimeContinent(theregionsurroundedbyadashedclosedcurve).
Figure 1.3: Zonally averaged components of the absorbed solar ux and
emitted thermalinfrared ux at the top of the atmosphere. + and - denote
energy gain and loss, respectively. (From Vonder Haar and Suomi, 1971,
Figure 1.4: Mean annualprecipitation asa function of latitude. (After Sell-
ers, 1965)
cipitationoccurs,i.e. anet amountof condensation withoutre-evaporation,
then latent heat isreleased. The implicationis that latent heat release may
bean importanteect inthe tropics.
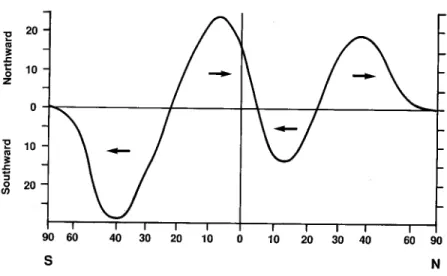
Figure1.5shows themean annualmeridionaluxof water vapour inthe
atmosphere. While there is some degree of uncertainty in the accuracy of
the details, it is a clear that the ux is poleward outside the region 25 Æ
S to
25 Æ
N. Inside this region, there isa large ux convergence towards a latitude
between5Nand10N,whichmarksthemeanpositionoftheInter-Tropical
Convergence Zone(ITCZ) - see below. This convergence of water vapour
canbebroadlyassociatedwiththeequatorwardlow-levelbranchofthemean
Hadley circulation, shown in Fig. 1.6, although this particular gure
suggestsincorrectlythatthemeanupwardbranchofthecirculationliesalong
the equator.
Avarietyofdiagramshavebeenpublisheddepictingthemeanmeridional
circulation of the atmosphere (see. e.g. SM, Ch. 2). While these dier
in detail, especially in the upper troposphere subtropics, they all show a
pronouncedHadleycellwithconvergencetowardstheequatorinthelow-level
tradewinds,risingmotionatorneartheequatorintheso-calledequatorial
trough, which is co-located with the ITCZ, poleward ow in the upper
troposphere and subsidence intothe subtropicalhigh pressure zones.
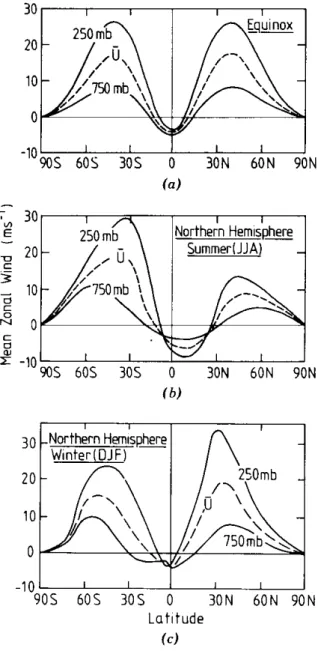
Figure1.7 shows the zonally-averagedzonal wind component at 750 mb
and 250 mb during June, July and August (JJA) and December, January
Figure 1.5: The mean annual meridional transfer of water vapour in the
atmosphere (in10 15
kg). (AfterSellers, 1965)
Figure1.6: Themeanmeridionalcirculationand mainsurfacewind regimes.
(From Defant,1958)
and February (DJF). The most important features are the separation of
the equatorial easterlies and middle-latitude westerlies and the variation of
the structure between seasons. In particular, the westerly jets are stronger
and further equatorward in the winter hemisphere. The rather irregular
distribution of land and sea areas in and adjacent to the tropics gives rise
to signicant variation of the ow with longitude so that zonal averages of
variousquantities may obscure a good deal of the action!
1.2 Data network in the Tropics
Onefactorthathashamperedthedevelopmentoftropicalmeteorologyisthe
relatively coarse data network, especially the upper air network, compared
with the network available in the extra-tropics, at least in the Northern
Hemisphere. This situation is a consequence of the land distribution and
hence the regions of human settlement.
Themainoperationalinstrumentsthatprovidedetailedandreliableinfor-
mation on the vertical structure of the atmosphere are radiosondes. Figure
1.8 shows the distribution and reception rates of radiosonde reports that
were received bythe EuropeanCentrefor MediumRangeWeather Forecasts
(ECMWF) during April1984. The northern hemisphere continents are well
covered and reception rates from these stations are generally good. How-
ever,coveragewithinthetropics,withcertainnotableexceptions, isminimal
and reception rates of many tropical stations is low. Central America, the
Caribbean, India and Australia are relatively well-covered, with radiosonde
soundingsatleastonceadayandwindsoundingsfourtimesaday. However,
most ofAfrica,SouthAmerica andvirtuallyallofthe oceanicareas are very
thinly covered. The situation at the beginning of the 21st century is much
the same.
Satelliteshaveplayed animportantrole inalleviatingthe lack ofconven-
tional data, but onlyto a degree. For example,they provide valuable infor-
mationonthe locationoftropicalconvective systemsand stormsand canbe
used to obtain \cloud-drift" winds. The latter are obtained by calculating
the motion of smallcloud elements between successive satellite pictures. A
source of inaccuracy lies in the problem of ascribing a height to the chosen
cloudelements. Usinginfra-redimageryonecan determineatleastthecloud
top temperature which can be used to infer the broad height range. Gener-
ally use ismade of low levelclouds, the motionof whichis oftenascribed to
the 850 mb level (approximately 1.5km), and high levelcirrus clouds, their
motion being ascribed to the 200 mb level (approximately 12 km). Clouds
Figure 1.7: Mean seasonalzonally averaged wind at250 mband 750 mbfor
(a)the equinox, (b) JJA,and (c) DJF asafunction of latitude. Thedashed
line indicates the tropospheric vertical average. Units are ms 1
. (Adapted
from Webster, 1987b)
their \steering level"is.
Satellites instruments have been developed also to obtain vertical tem-
Figure 1.8: Distributionand reception rate of radiosonde ascents, fromland
stations, received at ECMWF during April 1984. Upper panels are for 12
UTC; lowerpanels for 00UTC.
instrument (TIROS-N OperationalVertical Sounder) described by Smith et
al. (1979), which is carried on the polar-orbiting TIROS-N satellite. While
thesedatadonotcompeteinaccuracywithradiosondesoundings,theirareal
coverage is very good and they can be valuable in regionswhere radiosonde
soundings are sparse.
wind reports, mostly from jet aircraft which cruise at or around the 200
mb level. Accordingly, much of our discussion will be based on the ow
characteristics atlowandhigh levelsinthe tropospherewhere thedata base
is more complete.
1.3 Field Experiments
The routine data network in the tropics is totally inadequate to allow an
in-depth study of many of the important weather systems that occur there.
Forthis reason several major eldexperimentshavebeencarriedout during
the last two decades to investigateparticular phenomena in detail. A num-
ber of these were organized under the auspices of the Global Atmospheric
Research Programme (GARP), sponsored by the World Meteorological Or-
ganization - (WMO) and other scientic bodies (see Fleming et al., 1979).
Theprogrammeincludedaglobalexperiment,code-namedFGGE(TheFirst
GARP GlobalExperiment),which washeld fromDecember1978 toDecem-
ber1979. In turn, this included two special experiments to study the Asian
monsoon and code-named MONEX (MONsoon EXperiments). The rst
phase, Winter-MONEX, was held in December 1978 and focussed on the
Indonesian Region (Greeneld and Krishnamurti, 1979). The second phase,
Summer- MONEX,wascarriedout overtheIndianOceanand adjacentland
area from May to August 1979 (Fein and Kuettner, 1980).
Aforerunnerofthese experimentswasGATE, theGARPAtlanticTropi-
calExperiment,whichwasheldinJuly1974inaregionothe coastofWest
Africa. Its aim was to study, inter alia, the structure of convective cloud
clusters that make up the Inter-Tropical Convergence Zone (ITCZ) in that
region (see Kuettner et al.,1974).
More recently, the Australian Monsoon EXperiment (AMEX) and the
Equatorial Mesoscale EXperiment (EMEX) were carried out concurrently
in January-February 1987 inthe Australian tropics,the former to study the
large-scaleaspectsofthesummertimemonsoonintheAustralianregion,and
the latter tostudy the structure of mesoscale convective cloud systems that
develop within the Australian monsoon circulation. Details of the experi-
ments are given by Holland et al. (1986) and Webster and Houze (1991).
The last large experiment at the time of writing was TOGA-COARE.
TOGA stands for the Tropical Ocean and Global Atmosphere project and
COARE for the Coupled Ocean-Atmosphere Response Experiment. The
experiment was carried out between November 1992 and February 1993 in
the WesternPacic region,totheeast ofNew Guinea,inthe so-calledwarm
oceans and the global atmosphere as a time-dependent system in order to
determine the extent to which the system is predictable on time scales of
monthstoyearsandtounderstandthemechanismsandprocessesunderlying
this predictability" (Webster and Lukas,1992).
1.4 Macroscale circulations
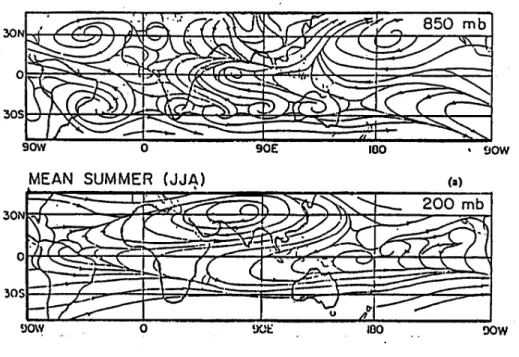
Figure 1.9 shows the mean streamline distribution at 850 mb and 200 mb
for JJA. These levels characterize the lower and upper troposphere, respec-
tively. Similar diagrams for DJF are shown in Fig. 1.10. At a rst glance,
the streamline patterns showasomewhat complicatedstructure, but careful
inspection reveals somerather general features.
At 850 mb there is a cross-equatorial component of ow towards the
summer hemisphere,especiallyinthe Asian, Australianand Africansectors.
This ow, which reverses between seasons, constitutes the planetary mon-
soons. In the same sectors in the upper troposphere the ow is generally
opposite to that atlow levels, i.e., itis towards the winter hemisphere, with
strong westerly winds (much stronger in the winter hemisphere) anking
the more meridional equatorial ow. Note that the spacing of the stream-
lines is not simply proportional to the wind speed because, in general, the
wind ishorizontally divergent. However, streamlines have been traditionally
used inthe tropics inpreference toisobars atconstant height orisoplethsof
geopotentialheightonisobaric surfacesbecausethe geostrophicrelationship
between wind speed and isobars becomes progressively weaker with dimin-
ishing latitude. Moreover, the mean isobar spacing in the tropics is rather
large, i.e. pressure gradients are relatively weak compared with those at
higher latitudes.
Boththe upperand lowertropospheric owinthe Asian, Australianand
African regionsindicatethe importanteects of the land distributionin the
tropics. Away from the Asian continent, over the Pacic Ocean, the ow
adopts a dierent character. At low levels it is generally eastward while
at upper levels it is mostly westward. Thus the equatorial Pacic region is
dominated by motionsconned to azonal plane.
In constructing zonally-averaged charts, an enormous amount of struc-
ture is \averaged-out". To expose some of this structure while stillproduc-
ing a simpler picture than the streamline elds, we can separate the three-
dimensionalvelocityeldintoarotationalpartandadivergentpart(see e.g.
Holton, 1972, Appendix C). Thus
Figure 1.9: Mean streamline patterns at 850 mb and 200 mb during JJA.
(From Webster et al., 1977)
where is a streamfunction and a velocity potential. The contribution
k^r isrotationalwithr^(k^r ) =kr 2
,butnondivergent,whereas,
r is irrotational, but has divergence r 2
. Because of this last property,
examinationof the velocitypotentialis especiallyuseful asa diagnostictool
for isolatingthedivergentcirculation. It isthispart of thecirculation which
responds directly tothe large-scale heatingand cooling of the atmosphere.
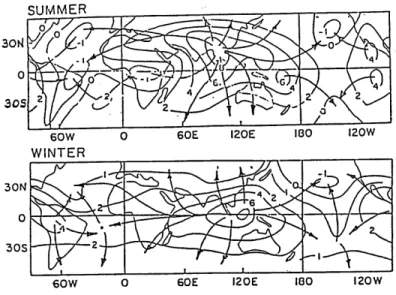
Figure 1.11 shows the distribution of the upper-tropospheric mean sea-
sonalvelocitypotentialandarrowsdenotingthedivergentpartofthemean
seasonal wind eld during summer and winter. Two features dominate the
picture. These are the large area of negative centred over southeast Asia
in JJA and the equallystrong negative regionover Indonesiain DJF.These
negativeareasarelocatedoverpositivecentresatlowlevels(Krishnamurti,
1971,Krishnamurtietal.,1973) 1
. Moreover,thetwoareasdominateallother
features.
The wind vectors indicate distinctzonal ow in the equatorial beltover
the Pacic and Indian Oceans and strong meridional ow northward into
Asia and southward across Australia. The meridional ow is strongest in
these sectors (i.e., in regions of strongest meridionally-orientated r ) and
showsthattheHadleycellisactuallydominatedbyregionalowatpreferred
longitudes.
When interpreting the -elds, a note of caution is appropriate. Re-
member that rV = r 2
and that jwjjrVj. Therefore centres of
maximum or minimum do not coincide with centres of w maximum or
minimum. The latter occur where r 2
is a maximum orminimum.
Krishnamurti's arrows are also somewhat misleading as they refer only
to the wind direction and not its magnitude. It is possible to study the
ow in the equatorial belt by considering a zonal cross-section (longitude
versus height) along the equator with the zonal and vertical components of
velocityplotted. Themeancirculationinsuchacross-sectionisshowninFig.
1.12. Strong ascending motion occurs in the western Pacic and Indonesian
regionwith subsidenceextendingovermost ofthe remainingequatorialbelt.
Exceptions arethe smallascending zonesoverSouth Americaand Africa. It
should benoted that the Indonesian ascending region liesto the east of the
velocity potential maximum in Fig. 1.11, in the area where r 2
is largest.
Thedominanteast-west circulationisoftencalledtheWalker Circulation.
Also plotted in Fig. 1.12 are the distributions of the pressure deviation in
the upperand lowertroposphere. These are consistentwith the sense of the
1
NotethatKrishnamurtidenestohavetheoppositesigntothenormalmathemat-
ical conventionused here. Accordingly, the signsin Fig. 1.11have been changed to be
consistentwithoursignconvention,theconventionusedalsobytheAustralianBureauof
Figure 1.11: Distributionof the uppertropospheric (200 mb)meanseasonal
velocitypotential(solidlines)andarrows indicatingthe divergentpartofthe
mean seasonal wind whichis proportionalto r 2
. (Adapted from Krishna-
murti et al.,1973).
large-scale circulation,the owbeingessentiallydown thepressure gradient.
Figure1.12displayssignicantverticalstructureinthelargescalevelocity
eld. Data indicatethat the tropospheric wind eld possesses two extrema:
one in the uppertroposphere and one inthe lowertroposphere. A theory of
tropical motions willhave to account for these large horizontal and vertical
scales. Indeed, it isinteresting tospeculate onthe reason for the large scale
of the structures which dominate the tropicalatmosphere. Their stationary
nature, at least on seasonal time scales, suggests that they are probably
forced motions, the forcing agent being the dierential heating of the land
and ocean orother formsof heatingresultingfrom it.
Thereis a considerable amount of observational evidence to support the
heating hypothesis. Forexample, Fig. 1.13 shows the distribution of annual
rainfallthroughoutthetropics. Itisnoteworthy thatthe heaviest fallsoccur
intheIndonesianandSoutheastAsianregionwithadistributionwhichcorre-
spondstothevelocitypotentialeldshownearlier. Oneisledtosurmisethat
the common ascending branch of the Hadley cell and Walker cell is driven
in some way by latent heat release. It is a separate problem to understand
why the maximum latent heat release would be located in the Indonesian
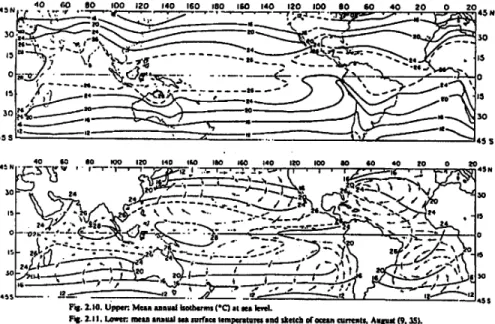
region. Figure 1.14 points to a solution. The upper panel shows the mean
Figure1.12: Schematicdiagramof thelongitude-heightcirculationalongthe
equator. The surface and 200 mb pressure deviations are shown as dashed
lines. Clouds indicate regions of convection. Note the predominance of the
PacicOcean-IndonesiancellwhichisreferredtoastheWalkerCirculation.
(From Webster,1983)
Figure 1.13: Distribution of annual rainfall in the tropics. Contour values
marked incm.
gitudinalvariation,but this correlates wellwiththe sea surface temperature
(SST) distribution shown in the lower panel. Of great importance is the
8-10 Æ
Clongitudinal temperature gradient across the Pacic Ocean. The air
mass over the western Pacic should be much more unstable to convection
than that overlying the cooler waters of the eastern Pacic.
Itisimportanttorememberthattheseasonalorannualmeaneldsshown
above possesses both temporal and spatial variations on even longer time
scales (see section 1.6). Figure 1.15 shows the mean annual temperature
range of the air near sea level. It is signicant that in the equatorial belt,
the temperature variations are generally very small, perhaps an order of
magnitude smaller than those observed at higher latitudes. This is true for
Figure 1.14: Mean annual surface air temperature (upper panel) and sea
surface temperature(lowerpanel) inthe tropics.
bothlandandsea areas. Wemayconcludethatthevariationswithlongitude
shown earlierwillbemaintained. On theotherhand,athigherlatitudes, the
near surface temperature overthe sea possesses arelatively large amplitude
variation which is surpassed only by the temperature variation over land.
Figure 1.15 shows only the amplitude of the variation and gives no details
of its phase. In fact, the ocean temperature at higher latitudes lags the
insolation by some 2 months. Continental temperatures lag by only a few
weeks.
1.5 More on the Walker Circulation
The term \Walker Circulation"appears to havebeen rst used by Bjerknes
(1969) to refer to the overturning of the troposphere in the quadrant of the
equatorialplanespanningthePacicOceananditwasBjerkneswhohypoth-
esized that the \driving mechanism" for this overturning is condensational
heating over the far western equatorial Pacic where SSTs are anomalously
warm. Theimplicationisthatthesourceofprecipitationassociatedwiththis
driving mechanism is the localevaporation associated with the warm SSTs.
Figure1.15: Mean annual temperaturerange ( Æ
C) of the airnear sea level.
This assumption was questioned by Cornejo-Garrido and Stone (1977) who
showed on the basis of a budget study that the latent heat release driving
theWalkerCirculationisnegatively-correlatedwithlocalevaporation,where-
upon moisture convergence from other regions must be important. Newell
et al. (1974) dened the WalkerCirculation as the deviation of the circula-
tion in the equatorialplane fromthe zonal average. Figure1.16, taken from
Newell et al., shows the contours of zonal mass ux averaged over the three
month period December 1962 - February 1963 in a 10 Æ
S wide strip centred
ontheequator. Inthisrepresentationthereare veseparate circulationcells
visible around the globe, but the double cell whose upward branch liesover
the farwesternPacic isthe dominantone. A similardiagramforthenorth-
ern summerperiodJune toAugust(Fig. 1.16(b))showsonlythreecells, but
again the major rising branch liesover the western Pacic. As we shall see,
the circulation undergoes signicant uctuations on both interannual (1.6)
and intraseasonal (1.7) timescales.
(a)
(b)
Figure 1.16: Deviations of the zonal mass ux, averaged over the latitude
belt0 Æ
-10 Æ
N,fromthezonal mean. forthe periods(a)December-February,
and (b) June - August calculated by Newell et al. (1974). Contours do
not correspond withstreamlines, but giveafairly goodrepresentationof the
velocity eld associated with the Walker Circulation.
1.6 El Ni~no and the Southern Oscillation
There isconsiderableinterannualvariabilityinthe scale and intensity of the
(SO). The latter is associated with uctuations in sea level pressure in the
tropics, monsoon rainfall, and the wintertime circulation over the Pacic
Ocean. It is associated also with uctuations in circulation patterns over
North America and other parts of the extratropics. Indeed, it is the single
most prominent signalin year-to-year climatevariability inthe atmosphere.
The SO was rst described in a series of papers inthe 1920s by Sir Gilbert
Walker(Walker, 1923,1924,1928)andareviewandreferences arecontained
in a paper by Julian and Chervin (1978). The latter authors use Walkers
own words to summarize the phenomenon. \By the southern oscillation is
implied the tendency of (surface) pressure at stations in the Pacic (San
Francisco, Tokyo, Honolulu, Samoa and South America), and of rainfall in
India and Java... to increase, while pressure in the region of the Indian
Ocean (Cairo,N.W.India, Darwin,Mauritius,S.E. Australiaand the Cape)
decreases..." and \We can perhapsbest sum up the situationby sayingthat
thereisaswayingofpressureonabigscalebackwards andforwardsbetween
the Pacic and Indian Oceans...".
Figure 1.17a depicts regions of the globe aected by the SO. It shows
the simultaneous correlationof surface pressure variationsat allplaces with
the Darwin surface pressure. It is clear, indeed, that the \sloshing" back
and forth of pressure which characterizes the SO does inuence a very large
area of the globe and that the \centres of action", namely Indonesia and
the eastern Pacic, are large also. Figure 1.17b shows the variation of the
normalized Tahiti-Darwinpressure anomaly dierence, frequently used asa
Southern OscillationIndex (SOI), which givesan indicationof the temporal
variation of the phase of the SO. For example, a positive SOI means that
pressures over Indonesia are relatively low compared with those over the
eastern Pacic and vice versa.
It was Bjerknes (1969) who rst pointed to an association between the
SO and the WalkerCirculation, althoughthe seeds for this association were
present in the investigations by Troup (1965). These drew attention to the
presenceofinterannualchangesintheuppertroposphereowoverthetropics
associated withthe SO and indicated thatthe anomaliesinthe owcovered
a large range of longitudes. Bjerknes stated:
\The Walker Circulation...must be part of the mechanism of
the still larger Southern Oscillation statistically dened by Sir
GilbertWalker...whereastheWalkerCirculationmaintainseast-
west exchange of air covering a little over an earth quadrant of
the equatorial belt from South America to the west Pacic, the
concept of the Southern Oscillationrefers tothe barometrically-
Figure 1.17: The spatial variationof the simultaneous correlation of surface
pressure variations at all points with the Darwin surface pressure (upper
panel). Shaded areas shownegativecorrelations. The lowerpanel shows the
variationofthenormalizedTahiti-DarwinpressuredierenceontheSouthern
OscillationIndex. (From Webster, 1987b)
the globe in tropical latitudes. What distinguishes the Walker
Circulation fromothertropicaleast-west exchanges of airisthat
it operates a large tapping of potentialenergy by combining the
large-scale rise of warm-moistairand descent of colder dry air".
In asubsequent paper,Bjerknes (1970)describesthis thermally-directcircu-
lation oriented in a zonal plane by reference to mean monthly wind sound-
ings atopposing \swings" of the SO and the patterns of ocean temperature
anomalies.
El Ni~no isthe name given tothe appearance of anomalouslywarm sur-
facewaterotheSouthAmericancoast,aconditionwhichleadsperiodically
to catastrophic downturns in the Peruvian shing industry by severely re-
ducingthecatch. ThecolderwaterthatnormallyupwellsalongthePeruvian
Ni~no. The phenomenon has been the subject of research by oceanographers
formanyyears,butagainitseemstohavebeenBjerknes(1969)whowasthe
rst tolink it with the SO as some kind of air-sea interaction eect. Bjerk-
nes used satelliteimagerytodenethe regionofheavy rainfalloverthe zone
of the equatorial central and eastern Pacic during episodes of warm SSTs
there. He showed that these uctuations in SST and rainfall are associated
with large-scale variations in the equatorial trade wind systems, which in
turnaect themajorvariationsoftheSOpressure pattern. Theuctuations
in the strength of the trade winds can be expected to aect the ocean cur-
rents, themselves, and therefore the ocean temperatures to the extent that
these aredeterminedbythe advectionofcoolerorwarmerbodiesofwater to
aparticular locality,or,perhapsmore importantlytochanges inthe pattern
of upwelling of deeper and cooler water.
Figure 1.18 shows time-series of various oceanic and atmospheric vari-
ables at tropical stations during the period 1950 to 1973 taken from Julian
and Chervin (1978). These data include the strength of the South Equato-
rialCurrent; theaverage SSToverthe equatorialeastern Pacic;the Puerto
Chicama (Peru) monthly SST anomalies; the 12 monthrunning averages of
the Easter Island-Darwindierences insea levelpressure; and thesmoothed
Santiago-Darwinstationpressuredierences. Thegureshowsalsothezonal
wind anomalies at Canton Island (3 Æ
S, 172 Æ
W) which was available for the
period1954-1967 only. Themutualcorrelation andparticular phaseassocia-
tionofthesetimeseriesisstrikingandindicateanatmosphere-oceancoupling
with a time scale of years and a spatial scale of tens of thousands of kilo-
metres involvingthe tropics aswellas parts of the subtropics. This coupled
ocean-atmospherephenomenon isnow referred toasENSO, anacronym for
El Ni~no-Southern Oscillation.
DuringEl Ni~noepisodes, the equatorial waters inthe easternhalf of the
Pacicare warmerthan normalwhile SSTs west of the date lineare near or
slightlybelownormal. Thentheeast-westtemperaturegradientisdiminished
and waters near the date line may be as warm as those anywhere to the
west ( 29 Æ
C). The region of heavy rainfall,normally over Indonesia,shifts
eastwards so that Indonesia and adjacent regions experience drought while
the islands intheequatorial centralPacic experience monthaftermonthof
torrential rainfall. Near and to the west of the date line the usual easterly
surface winds along the equator weaken or shift westerly (with implication
for ocean dynamics), while anomalously strong easterlies are observed at
the cirrus cloud level. In essence, in the atmosphere there is an eastward
displacementof the WalkerCirculation.
There are various theories for the oceanic response to changes in the
Figure 1.18: Composite low-pass ltered time series for various oceano-
graphic and meteorologicalparameters involved in the Southern Oscillation
and Walker-Circulation. Series are (top to bottom): the strength of the
SouthEquatorialCurrent,awestwardowingcurrentjustsouthoftheequa-
tor; ocean surface temperature anomalies in the region 5 Æ
N-5 Æ
S and 80 Æ
W
to 180 Æ
W (solidline), and monthlyanomaliesofPuerto Chicamaocean sur-
face temperature, dashed; two Southern Oscillationindices, the dashed line
being 12-month running means of the dierence in station pressure Easter
Island-Darwin and the solid linebeing a similar quantity except Santiago is
used instead of Easter Island; the bottom series are low-pass ltered zonal
wind anomalies (from monthly means) at Canton at 850 mb (dashed) and
200 mb (solid). The short horizontal marks appearing between two panels
denote the averaging intervals used in compositing variables in cold water
and El Ni~nosituations. (From Julian and Chervin,1978)
one. A briefreview of theseis given by Hirst (1989). Apopularstyle review
of the meteorological aspects of ENSO is given by Rasmussen and Wallace
(1983), who discuss, inter alia, the implications of ENSO for circulation
changes in middle and higher latitudes. A more recent review is that of
Philander (1990).
1.7 The Madden-Julian/Intraseasonal Oscil-
lation
As well as uctuations on an interannual basis, the Walker Circulation ap-
pears to undergo signicant uctuations on intraseasonal time scales. This
discovery dates back to pioneering studies by Madden and Julian (1971,
1972) who found a 40-50 day oscillation in time series of sea-level pressure
and rawinsonde data at tropical stations. They described the oscillationas
consisting of global-scale eastward-propagating zonal circulation cells along
theequator. Theoscillationappearstobeassociatedwithintraseasonalvari-
ations in tropical convective activity as evidenced in time series of rainfall
and in analysesof anomaliesincloudiness and outgoinglong-wave radiation
(OLR) as measured by satellites.
Theresultsof variousstudies tothemid-80sare summarizedby Lauand
Peng (1987). They list the key features of the intraseasonal variability as
follows:
i. There is a predominance of low-frequency oscillations in the broad
range from30-60 days;
ii. The oscillationshave predominant zonal scales of wavenumbers 1 and
2 and propagate eastward along the equator year-round.
iii. Strong convection is conned to the equatorial regions of the Indian
Ocean and western Pacic sector, while the wind pattern appears to
propagate around the globe.
iv. Thereisamarkednorthwardpropagationofthe disturbanceoverIndia
and East Africa during summer monsoon season and, to a lesser ex-
tent, southward penetration overnorthern Australia duringthe south-
ern summer.
v. Coherent uctuationsbetween extratropical circulation anomaliesand
thetropical40-50dayoscillationmayexist,indicatingpossibletropical-
midlatitude interactions onthe abovetime scale.
vi. The 40-50day oscillationappears to be phase-locked to oscillationsof
10-20 day periods overIndiaand the western Pacic. Both are closely
related tomonsoononset andbreak conditions overthe above regions.
Figure1.19shows aschematicdepiction ofthe time and spacevariations
of the circulation cells in a zonal plane associated with the 40-50 day oscil-
Figure 1.19: (a) Schematicdepiction of the time and space variations of the
disturbanceassociatedwiththe 40-50dayoscillationalongtheequator. The
times of the cycles (days) are shown to the left of the panels. Cloudsdepict
regions of enhanced large-scale convection. The mean disturbance pressure
is plotted at the bottom of each panel. The circulation on days 10-15 is
quite similar to the Walker circulation shown in Fig. 1.12. The relative
tropopause height isindicated atthe top of each panel. (b) shows the mean
annual SST distribution along the equator. The 40-50 day wave appears
strongly convective when the SST is greater than 27 Æ
C as in panels 2-5 in
(a). Panel (c) shows the variations of pressure dierence between Darwin
and Tahiti. The swingisreminiscentof theSO,but withatimescale oftens
of days rather than years. (From Webster, 1987b)
Figure 1.20 shows the eastward propagation of the 40-50 day wave in
terms of its velocity potential in the Eastern Hemisphere. The four panels,
each separated by ve days, show the distributions of the velocity potential
at 850 mb. The centre of the ascending (descending) region of the wave
is denoted by A (B). As the wave moves eastwards, it intensies as shown
by the increased gradient. Furthermore, and very important, as centre A
moves eastwards from the southwest of India (which liesbetween 70 Æ
E and
90 Æ
E) to the east of India, the direction of the divergent wind over India
changes fromeasterly towesterly. Noticealsothat ascentre A movesacross
the Indian region that the gradient of velocity potential intensies to the
north asindicated by the movement of the stippled regions in panels 2 and
3. Thus, dependingonwhere thecentres Aand B are locatedrelativetothe
monsoon ow, the strength of the monsoonsouthwesterlies owing towards
the heated Asian continent willbe strengthened orweakened. Thus we can
the importanceof the phase of the MJO onthe mean monsoonal ow.
Figure1.20: (a)Thelatitude-longitudestructureofthe40-50daywaveinthe
Eastern Hemisphere in terms of 850 mb velocity potential. Units 10 6
s 1
.
The arrows denote the direction of the divergent part of the wind and the
stippled region the locations of maximum speed associated with the wave.
Letters A and B depict the centres of velocity potential, which are seen to
moveeastwards. Centre A may be thoughtof asa regionof rising airand B
a region of subsidence. (From Webster 1987b)
According to Lau and Peng, the most fundamental features of the os-
slowtime scaleinthe range30-60 days. Todate,observational knowledgeof
the phenomenon has outpaced theoretical understanding, but it would ap-
pear that the equatorial wave modes to be discussed in Chapter 3 play an
important role in the dynamics of the oscillation. Furthermore, because of
the similar spatialand relativetemporalevolutionof atmosphericanomalies
associated with the 40-50 day oscillation and those with ENSO, it is likely
that the two phenomena are closely related (see. e.g. Lauand Chan,1986).
Indeed, one might view the atmospheric part of the ENSO cycle as uc-
tuations in a longer-term (e.g. seasonal average of the MJO). Two recent
observational studies of the MJO are those of Knutson et al., (1986) and
Knutson and Weickmann (1987). A recent review of theoretical studies is
included inthe paperby BladeandHartmann(1993)andarecentreviewsof
observational studies are contained in papers by Madden and Julian (1994)
and Yanai et al. (2000).
One might view the Walker Circulation as portrayed in Figs. 1.12 and
1.16 as anaverage of several cycles of the MJO.
1.8 More on Monsoons
The term monsoon originates from the Arabic \Mausim", a season, and
was used to describe the change in the wind regimes as the northeasterlies
retreated tobe replaced by the southwesterlies or vice versa. The term will
be used here to describe the westerly air stream (southwesterly in the NH,
northwesterly in the SH) that results as the trade winds cross the equator
and owintotheequatorialtrough. Accordingly, thetermrefers tothewind
regime and not to areas of continuous rain etc., which are associated with
the monsoon. Figure1.21 shows the typicallow-levelow and othersmaller
scale featuresassociated withthe (NH)summerand winter monsoons inthe
Asian regions.
Two main theories have been advanced to account for the monsoonal
perturbations.
1.8.1 The Regional Theory
This regardsthe monsoon perturbations aslow-levelcirculation changes re-
sulting entirely from the large-scale heating and cooling of the continents
relative to oceanic regions. In essence the monsoon is considered as a con-
tinental scale \sea breeze" where air diverges away from the cold winter
continents and converges into the heat lows in the hot summer continents.
Figure 1.21: Air ow patterns and primary synoptic- and smaller scale fea-
turesthat aectcloudiness andprecipitationinthe regionof (a)the summer
monsoon,and(b)thewintermonsoon. In(a),locationsofJunetoSeptember
rainfallexceeding 100 cm the land west of 100 Æ
E associated with the south-
west monsoon are indicated. Those over water areas and east of 100 Æ
E are
omitted. In(b)theareacoveredbytheshiparrayduringthewinterMONEX
experiment isindicated by aninverted triangle. (From Houze, 1987)
1.8.2 The Planetary Theory
With the great increase in upper air observations during the second half of
been found to accompany the onset of monsoonal conditions in the lower
levels. In particular, marked changes in the position of the subtropical jet
stream accompany the advance of the monsoonalwinds.
There are several objections to the regional theory. For example, mon-
soonal circulationsareobserved overthe oceans,wellremoved fromanyland
mass, and the heat low over the continents is often remote from the main
monsoonal trough. Moreover, the seasonal displacement of surface and up-
perairfeaturesiswellestablishedfrommeanwindcharts. Thisdisplacement
is on a global scale, but is greatest over the continental land masses, espe-
cially the extensive Asian continent. Hence an understanding of planetary
circulation changes in conjunction with major continental perturbations is
necessary in understanding the details of the monsoonal ow.
1.9 Monsoon variability
Superimposedupontheseasonalcyclearesignicantvariationsintheweather
of the tropicalregions. Forexample, inthe monsoon regionsthe established
summer monsoon undergoes substantial variations, vacillating between ex-
tremely active periods and distinct \lulls" in precipitation. The latter are
referred to as\monsoonbreaks".
Anexampleofthisformofvariabilityisshown inFig1.22whichsumma-
rizes the monsoonrainsof two years, 1963 and 1971,along the west coast of
India. The \active periods" are associated with groups of disturbances and
the \breaks"with anabsence ofthem,. Usually,duringthe break, precipita-
tion occurs fartothe southof Indiaand alsotothe northalong the foothills
ofthe Himalaya. Suchvariabilityasthisappearscharacteristicofthe precip-
itating regions of the summer and winter phases of the Asian monsoon and
the Africanmonsoon.
1.10 Synoptic-scale disturbances
Theindividualdisturbancesoftheactivemonsoonandthoseassociatedwith
thenear-equatorialtroughsmovewestwardinafairlyuniformmanner. Such
movementisshownclearlyinFig. 1.23. Thewestwardmovementisapparent
in the bands of cloudiness extending diagonallyfrom rightto left across the
time-longitudesections.
To illustrate the structure of propagating disturbances, Webster (1983)
discusses aparticular exampletaken fromWinter-MONEX) in1978. Figure
1.24showstheJapanesegeostationarysatellite(GMS)infra-red(IR)satellite
Figure1.22: Dailyrainfall(cm/day)alongthewesterncoastofIndiaincorpo-
rating the districtsof Kunkan, CoastalMysore and Kerala for the summers
of 1963 and 1971. (From Webster,1983)
picture at 1800 UTC on 25 December 1978 for the Winter-MONEX region
with the.2300UTCsurface pressureanalysis underneath. Figure1.25 shows
the correspondingwind eldsat250 mband950 mb. What isstriking isthe
existence of signicant structures in the satellite cloud eld which have no
obvious signature in the surface pressure eld. Indeed, the tropical portion
of thepressure eldisrelativelyfeatureless,except fortheheat lowinnorth-
westernAustraliaandthebroadtroughthatspansthenearequatorialregion
of the southern hemisphere just west of the date line. The most that one
can say is that the major cloud regions appear to resideabout the axis of a
broad equatorial trough.
Webster considers three major regions of deep high cloudiness denoted
Figure 1.23: Time-longitudesection of visible satellite imagery for the lati-
tude band 10-15 Æ
N of the tropics. Cloud streaks moving from right to left
with increasing timedenotes westward propagation. Notethat there istypi-
cally easterly owat these latitudes. (From Wallace, 1970)
that these can be associated with areas of low-level convergence in the 950
mb wind eld lying beneathareas of upper-level divergence at 200 mb. The
implication is that these are each deep divergent systems. Such properties:
lowertropospheric convergence, deeppenetrative convectionand upper-level
divergence appear characteristic of the synoptic-scale tropical disturbances
Figure 1.26 shows the surface pressure trace for Darwin from 23 - 28
December1978,coveringthe periodof thecasestudy presented inFigs. 1.23
and 1.24. The major variation in the pressure is associated with the semi-
diurnal oscillation which has an amplitude of about 4 mb. Little alteration
tothesemi-diurnaltrendisapparentnear 25December1978whichcoincides
with the existence there of the disturbance. Indeed at lowlatitudes only on
rare occasions with the passage of a tropical cyclone willthe synoptic-scale
pressure perturbations be largerthan the semi-diurnalvariation.
Figure 1.24: The winter MONEXregion of 25December 1978. Upperpanel
shows the GMSIR satellitepicture with the surface-pressure pattern shown
on lower panel. Both panels are on the same projection. Pressure analysis
after McAvaney et al. (1981): Letters A. B and C identify synoptic-scale
disturbances referred toin the text. (From Webster, 1983)
Figure1.25: The 250mb(upperpanel)and 950mb(lowerpanel)windelds
forthe winter MONEXregionof25December1978withthehorizontalwind
divergence superimposed in the 20 Æ
N - 20 Æ
S latitude strip. In the upper
troposphere areas the divergence are stippled whereas in the lower tropo-
sphere areas of convergence are stippled. Stippled areas denote divergence
magnitudes greater than5010 5
s 1
. (From Webster, 1983)
Figure1.26: ThevariationofsurfacepressureatDarwinfortheperiod23-28
December1978. Thestructureisdominatedbythesemi-diurnalatmospheric
tide.