Tropical Meteorology
Roger K. Smith
INDO IR 01010510
GMS IR 01022621
GOES IR 00112909
¾ Introduction to the tropics
¾ The zonal mean circulation (Hadley circulation)
¾ The data network in the tropics (field experiments)
¾ Macroscale circulations, Inter-Tropical Convergence Zone (ITCZ), Monsoons, The Walker circulation
¾ El Niño – Southern Oscillation
¾ The Madden-Julian Oscillation
¾ Westerly wind bursts
Topics
¾ Chapter 2 Equations and scaling at low latitudes
¾ Chapter 3 Diabatic Processes
¾ Chapter 4 Theory of the Hadley circulation
¾ Chapter 5 Wave motions in the tropics
¾ Chapter 6 The role of deep convection
¾ Chapter 7 Tropical cyclones
Topics
Principal land and ocean areas between 40°S and 40°N. The dot- dash line is where the mean annual range equals the mean daily range of temperature. The shaded areas show tropical highlands (over 1000 m).
18°C sea level isotherm for the coolest month
From Nieuwolt (1977)
How does one define the tropics?
Tropic of Capricorn 23.5os Tropic of Cancer 23.5oN
The maritime continent
Zonal mean meridional circulation
The three-cell meridional circulation pattern
Hadley cell Ferrel
cell
(after Rossby, 1950)
mean meridional circulation
The mean meridional circulation and main surface wind regimes.
(after Defant, 1958)
ITCZ
ITCZ
Radiative heat balance
Zonally averaged components of the absorbed solar flux and emitted thermal infrared flux at the top of the atmosphere.
energy gain
(after Vonder Haar and Suomi, 1971, with modifications)
energy loss
Mean annual precipitation
Mean annual precipitation as a function of latitude.
(after Sellers, 1965)
Meridional water transport
The mean annual meridional transfer of water vapour in the atmosphere (in 1015kg).
(after Sellers, 1965)
The zonally averaged wind for the NH summer and winter
Distribution and reception rate of radiosonde ascents, from land stations, received at ECMWF at 00 UTC during April 1984.
Distribution and reception rate of radiosonde ascents, from land stations, received at ECMWF at 12 UTC during April 1984.
Field Experiments in the Tropics 1969 - 1974
¾ BOMEX(1969)
Bermuda Oceanographic and Meteorological EXperiment
Holland & Rasmusson, (1973), MWR, 101, 44-55.
¾ GATE(July 1974)
Global Atmospheric Research Programme (GARP) Atlantic Tropical Experiment
GARP: Fleming et al., (1979), BAMS, 60, 649-659.
GATE: Kuettner et al. (1974) BAMS, 55, 711-744.
Field Experiments in the Tropics 1978 - 1979
¾ MONEX(WinterDecember 1978; SummerMay – August, 1979)
The MONsoon EXperiment (WMONEX, SMONEX)
Winter MONEX: Greenfield & Krishnamurti (1979), BAMS, 60, 649-659.
Summer MONEX: Fein & Kuettner (1980) BAMS, 61, 461-474.
Field Experiments in the Tropics 1987 -
¾ AMEX – EMEX(January – February 1987)
Australian Monsoon EXperiment & Equatorial Mesoscale EXperiment
AMEX Holland et al. (1986), BAMS, 67, 1466-1486.
EMEX Webster & Houze (1991), BAMS, 72, 1481-1505.
¾ TOGA COARE(November 1992 – February 1993)
Tropical Oceans Global Atmosphere Couple Ocean Atmosphere Response Experiment
Webster & Lucas (1992), BAMS, 73, 1377-1416.
Mean streamline patterns at 850 mb and 200 mb during the Northern Hemisphere summer (JJA).
(From Webster et al.,1977)
Mean streamline patterns at 850 mb and 200 mb during the Northern Hemisphere winter (DJF).
(From Webster et al.,1977)
Velocity potential
V = ∧ ∇ + ∇ k ψ χ
∇ ∧ ( k ∧ ∇ ψ ) = ∇ k
2ψ
We can separate the three-dimensional velocity field into a rotational part and a divergent part (see e.g. Holton, 1972, Appendix C.)
rotational nondivergent
irrotational divergent
( )
∇ ∧ ∇χ = 0
( ) 0
∇⋅ k ∧ ∇ψ = ∇⋅ ∇χ = ∇ χ ( )
2Upper tropospheric (200mb) mean seasonal velocity potential indicating the divergent part of the mean seasonal wind which
is proportional to χ.
(Adapted from Krishnamurtiet al., 1973).
Distribution of annual rainfall in the tropics. Contour values marked in cm.
Mean annual surface air temperature (upper panel) and sea surface temperature (lower panel) in the tropics.
26 20
28
26
20
Mean annual temperature range (°C) of the air near sea level.
5 10 5
5
1
5 5
2.5
2.5
2.5 1
Walker circulation
Deviations of the zonal mass flux, averaged over the latitude belt 0 – 10oN, from the zonal mean.
JJA
Walker - down Walker - up
Deviations of the zonal mass flux, averaged over the latitude belt 0 – 10oN, from the zonal mean.
DJF
Walker - down Walker - up
Monsoons
Indian Monsoon
Australasian Monsoon
An example of monsoon variability
19631971 West coast
of India
(From Webster, 1983)
Time-longitude section of vis imagery - latitude band 10 -15 N
(From Wallace, 1970)
time JulyAugustJune
1 1
1
Easterly waves over Africa
WV Imagery 17 June 1997 00Z
Fig. 1.23
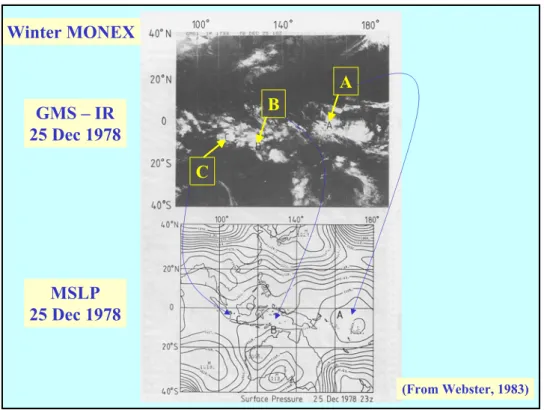
GMS – IR 25 Dec 1978
MSLP 25 Dec 1978 Winter MONEX
A B
C
(From Webster, 1983)
Fig. 1.24
250 mb 25 Dec 1978
850 mb 25 Dec 1978 Winter MONEX
A
C B
A
B C
horizontal wind divergence
(From Webster, 1983)
The variation of surface pressure at Darwin for the period 23 - 28 Dec. 1978.