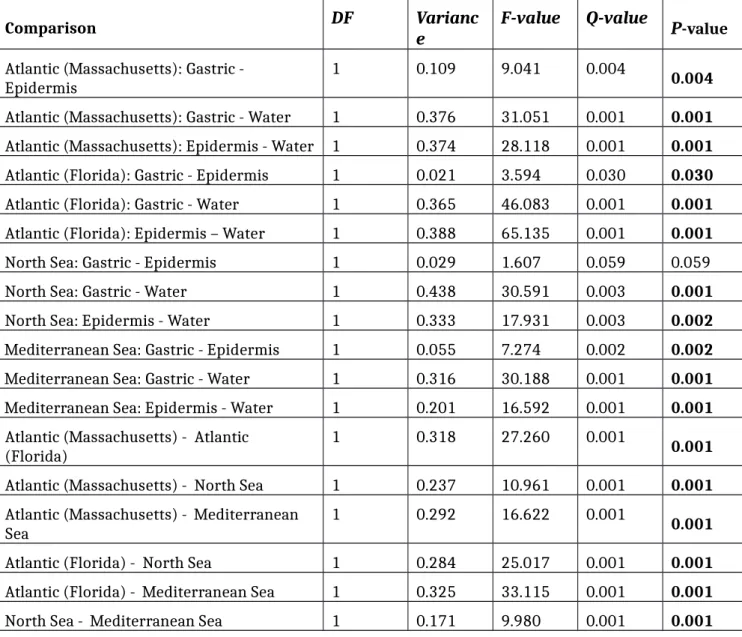
Table S1: Results of pairwise tests in beta diversity analysis. All samples were normalized to 23,622 raw sequences per sample. Tests were conducted for specified comparisons. DF, degree of freedom; F-value, F distribution under null hypothesis; Q-value, Bonferroni-Holm-corrected P- value.
Comparison
DF Varianc
e F-value Q-value P
-value Atlantic (Massachusetts): Gastric -Epidermis 1 0.109 9.041 0.004 0.004
Atlantic (Massachusetts): Gastric - Water 1 0.376 31.051 0.001 0.001 Atlantic (Massachusetts): Epidermis - Water 1 0.374 28.118 0.001 0.001 Atlantic (Florida): Gastric - Epidermis 1 0.021 3.594 0.030 0.030
Atlantic (Florida): Gastric - Water 1 0.365 46.083 0.001 0.001
Atlantic (Florida): Epidermis – Water 1 0.388 65.135 0.001 0.001
North Sea: Gastric - Epidermis 1 0.029 1.607 0.059 0.059
North Sea: Gastric - Water 1 0.438 30.591 0.003 0.001
North Sea: Epidermis - Water 1 0.333 17.931 0.003 0.002
Mediterranean Sea: Gastric - Epidermis 1 0.055 7.274 0.002 0.002
Mediterranean Sea: Gastric - Water 1 0.316 30.188 0.001 0.001
Mediterranean Sea: Epidermis - Water 1 0.201 16.592 0.001 0.001 Atlantic (Massachusetts) - Atlantic
(Florida) 1 0.318 27.260 0.001 0.001
Atlantic (Massachusetts) - North Sea 1 0.237 10.961 0.001 0.001 Atlantic (Massachusetts) - Mediterranean
Sea 1 0.292 16.622 0.001 0.001
Atlantic (Florida) - North Sea 1 0.284 25.017 0.001 0.001
Atlantic (Florida) - Mediterranean Sea 1 0.325 33.115 0.001 0.001
North Sea - Mediterranean Sea 1 0.171 9.980 0.001 0.001