Biodiversity changes and their functional consequences in the pelagic ecosystems of the central Baltic Sea
Cruise-No. AL522
15 May – 30 May 2019, Kiel (Germany) – Kiel (Germany)
Thorsten Reusch
GEOMAR Helmholtz Centre for Ocean Research Kiel
Research Division Marine Ecology/Marine Evolutionary Ecology
2019
Table of Contents
1 Cruise Summary ... 3
1.1 Summary in English ... 3
1.2 Zusammenfassung ... 4
2 Participants ... 5
2.1 Scientific Party ... 5
2.2 Participating Institutions ... 5
3 Research Program ... 6
4 Narrative of the Cruise ... 7
5 Preliminary results ... 8
5.1 Ichthyo- and zooplankton sampling ... 8
5.2 Fishery ... 10
5.3 Hydrography ... 11
5.4 Food web structure of the Baltic pelagic ecosystem ... 12
5.5 Comparison of traditional net catches of zooplankton and fish species inventory to assessments using eDNA analysis ... 13
5.6 Marine microbes and viruses under climate change ... 14
5.7 Asessing microplastic contamination of Baltic Sea waters ... 15
6 Station List ... 16
7 Data and Sample Storage and Availability ... 26
8 Acknowledgements ... 27
9 Appendices ... 28
9.1 Electronic appendix with station list of AL521 (supplied as electronic file) ... 28
1 Cruise Summary 1.1 Summary in English
The AL522 cruise extended a 33yr long-term data series on (eco-)system composition and functioning of the Baltic Sea, with a focus on the deeper basins. A key characteristic of the cruise is the integration of oceanographic and biological information to enhance understanding of environmental and (fish) population fluctuations, and evolutionary processes in this system. The resulting data- and sample sets support ongoing projects in the Research Unit Marine Evolutionary Ecology at GEOMAR, as well as the EU Horizon 2020 project GoJelly and several international collaborations. The spatial focus lay on the Bornholm Basin as most important spawning area of Baltic cod, but also covered parts of the pronounced salinity gradient of the Baltic Sea and included the Western Baltic Sea, Arkona and Gotland Basin, Gdansk Deep, and Stolpe Trench.
Specific investigations included a detailed hydrological survey (oxygen, salinity, temperature) of the cruise area, plankton surveys (zoo- and ichthyoplankton including gelatinous plankton (jellyfish), with the goal to determine the composition and the abundance and vertical and horizontal distribution of species, and to take samples for later measurements of nutritional condition), and pelagic fishery hauls. The latter served to determine stock structure, gonadal maturation, stomach contents, and egg production of sprat and cod, and to sample tissue and otolith samples for individual-level genetic and ecological analyses of cod. The abundance and distribution of fishes in the cruise area was also assessed with hydroacoustic methods.
Additional cruise components were: (i) cod gonad and liver sampling for fecundity and parasite studies, (ii) vertically resolved plankton sampling for studies of plankton phenology (iii) depth-resolved sampling of microplastic using an neuston catamaran (iv) sampling and experimental work of photosynthesis rates of different phytoplankton fractions (v) eDNA filter sampling to compare with traditional net based methods.
Main preliminary results were that (i) bottom oxygen conditions in the main spawning ground of Eastern Baltic cod deteriorated during spring within 1 month to become anoxic (ii) cod nutritional condition seem to slightly improve, while the size structure of the stock is still very critical, with most individuals (>95%) smaller than 50 cm in length and (iii) moderate amounts of microplastic are present in the surface waters that await detailed verification and quantification.
1.2 Deutsche Zusammenfassung
Die AL522-Ausfahrt erweiterte eine 33-jährige Langzeitdatenreihe über das pelagische Ökosystem der zentralen Ostsee, mit einem Schwerpunkt auf den tieferen Becken. Ein wesentliches Merkmal der Kreuzfahrt ist die Integration ozeanographischer und biologischer Informationen, um das Verständnis von Umwelt- und (Fisch-)Bevölkerungsschwankungen und evolutionären Prozessen in diesem System zu verbessern. Die daraus resultierenden Daten- und Stichprobensätze unterstützen laufende Projekte in der Forschungseinheit „Marine Evolutionsökologie am GEOMAR sowie das EU Horizon 2020 Projekt GoJelly und mehrere internationale Kooperationen. Der räumliche Fokus lag auf dem Bornholm-Becken als wichtigstem Laichgebiet des Ostseedorschs, aber erfasste auch den ausgeprägten Salzgehaltsgradienten der Ostsee und umfasste die westliche Ostsee, das Arkona- und Gotlandbecken, das Danziger Tief und die Stolper Rinne.
Zu den spezifischen Untersuchungen gehörten eine detaillierte hydrologische Untersuchung (Sauerstoff, Salzgehalt, Temperatur) des Fahrtgebietes, Planktonuntersuchungen (Zoo- und Ichthyoplankton einschließlich gelatinösem Plankton (Quallen) mit dem Ziel, die Zusammensetzung und den Artenreichtum sowie die vertikale und horizontale Verteilung der Arten zu bestimmen und Proben für spätere Messungen des Ernährungszustandes zu entnehmen) und pelagische Fischereihols. Letzteres diente zur Bestimmung der Bestandsstruktur, der Gonadenreifung, des Mageninhalts und der Eierproduktion von Sprotte und Kabeljau sowie zur Probenahme von Gewebe- und Otolithenproben für genetische und ökologische Analysen auf individueller Ebene. Auch die Häufigkeit und Verteilung der Fische im Fahrtgebiet wurde mit hydroakustischen Methoden bewertet.
Weitere wissenschaftliche Ziele waren: (i) Kabeljau-Gonaden- und Leberproben für Fruchtbarkeits- und Parasitenstudien, (ii) vertikal aufgelöste Planktonproben für Studien der Planktonphänologie, (iii) tiefenaufgelöste Probenahme von Mikroplastik mit einem Neustonkatamaran, (iv) Probenahme und experimentelle Arbeit mit Photosyntheseraten verschiedener Phytoplanktonfraktionen, (v) eDNA-Filterprobenahme im Vergleich zu herkömmlichen netzbasierten Methoden.
Die wichtigsten vorläufigen Ergebnisse waren, dass sich (i) die Boden-Sauerstoffbedingungen im Hauptlaichgebiet des östlichen Dorschbestandes im Frühjahr innerhalb eines Monats drastisch verschlechtert haben, um anoxisch zu werden, (ii) sich der Ernährungszustand des Dorsches leicht zu verbessern scheint, während die Größenstruktur des Bestands immer noch sehr kritisch ist, wobei die meisten Individuen (>95%) kleiner als 50 cm lang sind und (iii) moderate Mengen an Mikroplastik an der Oberfläche gefunden wurde, die auf eine detaillierte Überprüfung und Quantifizierung warten.
2 Participants 2.1 Scientific Party
Name Discipline Institution1
Thorsten Reusch Marine Evolutionary Ecology (Chief Scientist) GEOMAR
Svend Mees Technician GEOMAR
Tatjana Liese Biological Oceanography/ MSc Student GEOMAR
Grace Walls Biological Oceanography/MSc Student GEOMAR
Eva Rohlfer Biological Oceanography/MSc Student GEOMAR
Erik Borchert Microbiology/postdoc GEOMAR
Fabian Wittmers3 Microbiology/postdoc GEOMAR
Luisa Listmann Marine Evolutionary Ecology/Postdoc UHAM Elisa Schaum3 Marine Evolutionary Ecology/professor UHAM
Richard Klinger Fisheries Science/MSc Student UHAM
Dörte Müller-Navarra2 Ecology/Scientist UHAM
Christian Pawlitzki Biology/BSc Student CAU
Katarzyna Spich Observer NMFRI
Erik Borchert Microbiology/postdoc GEOMAR
1Abbreviations explained under Section 2.2.
2First cruise leg Kiel - Rönne.
3Second cruise leg Rönne - Kiel.
2.2 Participating Institutions Abbreviation Full name
GEOMAR Helmholtz-Centre for Ocean Research Kiel, Germany CAU Christian-Albrechts-Universität zu Kiel, Germany UHAM University of Hamburg
SDU University of Southern Denmark
NMFRI National Marine Fisheries Research Institute, Poland
3 Research Program (including Work Area, Aims and Agenda)
Although the Baltic Sea, and in particular its central parts, is species poor, it nevertheless provides ecosystems services to the Baltic nations in terms of primary productivity and
harvestable fish stocks. Understanding the interactions among major ecosystem components such as fish and their major prey, zooplankton on the one hand, and climatic forcing impinging on these populations, such as salinity, oxygen supply and climate forcing on the other, is the central research question of the ALKOR May (and April) cruise. At the same time, the central Baltic Sea is one of the systems most affected by the combination of global (including climate) and local anthropogenic changes, and has undergone strong hydrographic and biological shifts in the past decades, which is why novel anthropogenic perturbations such as microplastic have been added to the sampling program.
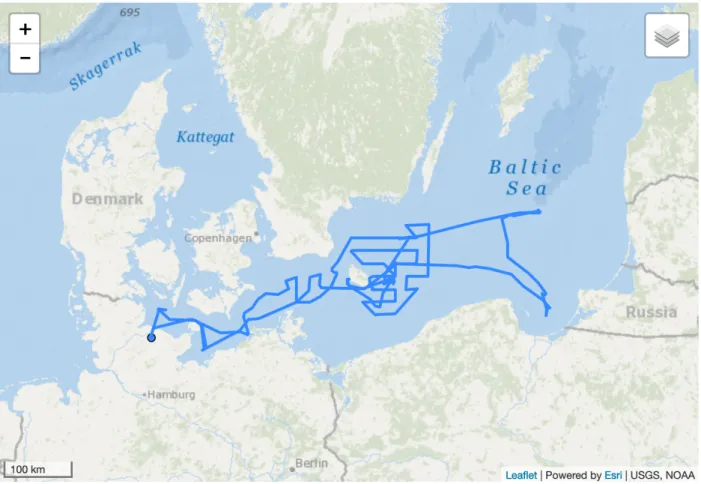
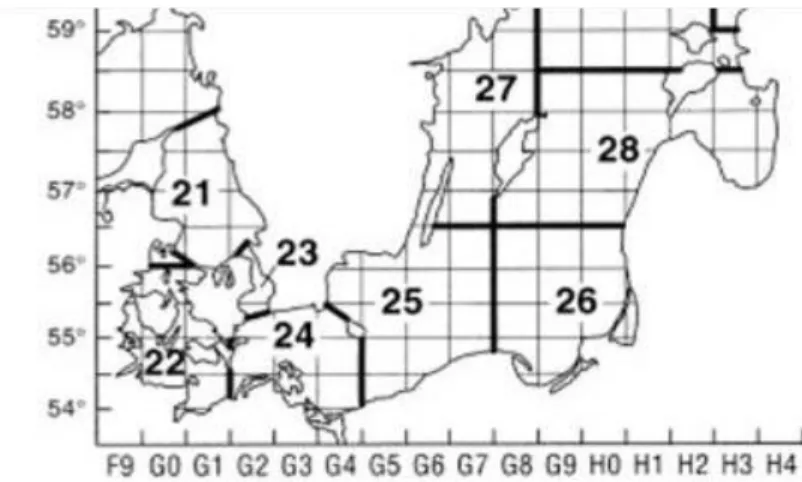
Cruise AL522 is part of a 33-year effort to collect long-term data series on hydrography, zooplankton and fish species composition along the salinity gradient of the Baltic Sea, with an emphasis on the central Baltic Sea, dating back to 1987 by the GEOMAR Helmholtz Centre for Ocean Research and its predecessors IFM-GEOMAR Kiel and IFM Kiel. The rationale for the specific spatial focus “Bornholm Basin” results from its growing importance as the only major remaining spawning area of Eastern Baltic cod. However, the cruise also included the western Baltic Sea, Arkona and Gotland Basin and Gdansk Deep (Figure 3.1), thus covering ICES subdivisions (SD) 22, 24, 25, 26 and 28 (Figure 3.2).
The cruise integrated oceanographic and biological sampling, permitting a later time series analysis as to how Baltic pelagic food webs and (fish) species across the environmental gradients of the Baltic Sea change in response to both, environmental forcing and human exploitation. Data sets and samples obtained during cruise AL522 are essential for a number of projects, including the large-scale international project EU Horizon 2020 GoJelly and
collaborations with the Technical University of Denmark, National Institute of Aquatic Resources (DTU Aqua), Stockholm University, and the University of Hamburg.
Figure 3.1 Cruise track of AL522
Specific investigations during AL522 included (1) a detailed hydrographic survey (oxygen, salinity, temperature) (2) zoo- and ichthyoplankton surveys to determine the
composition, abundance, vertical and horizontal distribution and nutritional status of species as well as patterns of plankton phenology (3) sampling of important food web components
including nutrients, seston, phyto-, zoo- (including jellyfish) and ichthyoplankton, (4) benthic and pelagic fishery hauls (5) eDNA assessments using filtered water samples (6) surface layer hauls with the newly constructed Neuston catamaran for sampling surface born microplastic.
Fisheries hauls served to determine size distributions, maturity status, and length – weight relationships of the three dominant fish species in the pelagic system of the Baltic, cod (Gadus morhua), herring (Clupea harengus) and sprat (Sprattus sprattus) as well as flatfishes including flounder (Plathichthys flesus). Secondly, various samples for more detailed analyses back on land were obtained, including cod gonads, livers and otoliths, herring and sprat stomachs and whole samples for dietary analyses, and tissue samples of cod, flounder, whiting, plaice and other species for genetic and stable isotope analysis. In addition, hydroacoustic data were
collected continuously along the cruise track for later analysis of fish abundance and distribution.
Additional work lines carried out in the context of collaborations with external groups included sampling and on-board experiments on photosynthesis and respiration rates of different phytoplankton fractions.
4 Narrative of the Cruise
RV ALKOR was loaded on the days prior to the onset of the cruise. ALKOR then departed from the GEOMAR Westshore pier on 15 May 2019 at 08:00 am (all times board time) and headed to the first research area in Kiel Bight (SD22). During AL522, all work laid out in the original cruise program was accomplished as planned, except for some minor delays when two small periods of stronger winds led to interruptions during passing Mecklenburg Bay (17 May) and the 2nd day in Bornholm Basin (25 May). Nevertheless, due to optimal allocation of ship time, and the perfect cooperation of the ship crew and the scientific team, the cruse ended one day early.
Over the course of the cruise, pelagic fishery hauls, zooplankton hauls with Bongo/IKS- 80 nets, water sampler, and CTD hauls were carried out following a large-scale spatial sampling design covering Kiel Bight (SD22) on 15 May, Mecklenburg Bight (SD22) on 16 May, Arkona Basin on 17 May, Bornholm Basin (SD25) on 18 May and again in more detail from 21-29 May, Stolpe Trench (SD25) on 18 May, Gdansk Deep (SD26) on 19 May, and Gotland Basin (SD26) on 20 May (Figure 3.1, 3.2). Hydroacoustic data obtained with four different echosounder frequencies (38, 70, 120 and 200 kHz) were continuously recorded over the duration of the cruise.
Figure 3.2 ICES subdivisions in the cruise area (Source: ICES). ICES SD22 corresponds to Kiel Bight = KB, SD24 to Arkona Basin = AB, SD25 to Bornholm Basin = BB and Stolpe Trench = SR, SD26 to Gdansk Deep = GD and Southern Gotland Basin (GB).
The scientific work was interrupted by a scheduled harbor stay in Rönne, Bornholm on 23/24 May where some people of the scientific crew were exchanged.
As in previous years, the central deep station BB23 in Bornholm Basin was intensively sampled on two occasions, early in the cruise on 18 May (including CTD casts, zooplankton sampling with Bongo, Apstein and WP-2 nets, oxygen measurements of water samples obtained with the rosette water sampler with the Winkler method for the calibration of oxygen probe measurements, and phytoplankton sampling) and late in the cruise on 24/25 May (same sampling as on 18 May, followed by the detailed vertically and temporally resolved sampling of plankton communities by four towed Multinet MAXI and four vertical Multinet MIDI hauls over a 24 hour period, covering the water column in 5 m and 10 m depth layers, respectively). Moreover, whole food web samples (nutrients, seston, phyto- and zooplankton including jellyfish and fish larvae) were obtained at 4 stations, using a combination of water sampler, Bongo, WP-2 and WP-3 hauls. Additional sampling was carried out throughout the cruise area for the special projects on phytoplankton communities (surface water samples at 16 stations) and on eDNA assessments of pelagic fish and zooplankton compositions (4 stations). Table 4.1 provides a spatially resolved overview over all gear deployments during AL522. A newly tested gear was the Neuston-catamaran, a zooplankton sampler for the surface layer that, at the same time, was designed to sample possible microplastic contamination of Baltic Sea surface waters (Fig. 5.7.1)
Table 4.1 Overview of all gear deployments during AL522. Mesh sizes of all nets are given in brackets. For location designations are KB=Kiel Bay, MB= Mecklenburg Bay, AB=Arkona Basin, BB=Bornholm Basin, SR= Stolpe Trench, GD=Gdansk Deep, GB=Gotland Basin. Numbers designate the Baltic Sea subdivisions.
5 Preliminary Results
5.1 Ichthyo– and zooplankton sampling
Zooplankton samples were taken along the entire salinity gradient from Kiel Bight to Gotland Basin. A target area was the Bornholm Basin where the “Bongo-Grid” was taken, a quasi- synoptic survey of the entire basin on a grid spanning stations at 10 nm intervals. Bongo- and Baby-Bongo hauls covered Kiel Bight (5 hauls), Mecklenburg Bight (4 hauls), Arkona Basin (24 hauls), and Bornholm Basin including the western part of Stolpe Trench (53 hauls). Larvae of sprat (Sprattus sprattus; n = 681), flounder (Plathichthys flesus; n = 210), sculpin
(Myoxocephalus scorpius, n = 2), common seasnail (Liparis liparis; n = 26) and sandeel
(Ammodytes tobianus; n = 22) were picked from the 500 µm bongo-samples and 300 µm
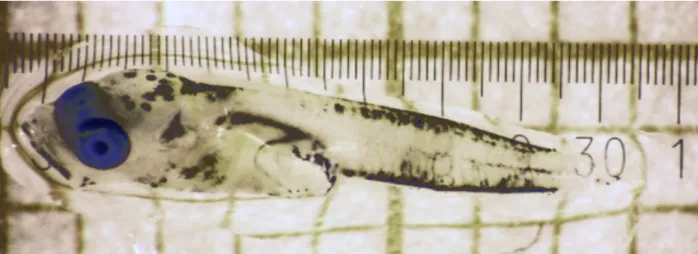
Multinet samples and conserved at -80 °C for subsequent RNA/DNA, stable isotope and genetic analyses. As in the April cruise, a low number (n = 2) of cod (Gadus morhua) larvae was found which is consistent with the continual shift of the spawning period of Eastern Baltic cod stock towards later in the year (i.e, summer) (Fig. 5.1.1).
Fig. 5.1.1 One of 2 cod larvae caught in zooplankton hauls of AL522 and stored for later biochemical and genetic analyses.
All zooplankton net catches were checked for the presence of gelatinous zooplankton.
Ephyrae (larvae) and small adults of scyphozoan jellyfish (identified on board as Cyanea capillata, potentially low numbers of Aurelia aurita) were present in much higher abundances than in May 2018, whereas the invasive comb jelly (Ctenophora) Mnemiopsis leidyi was entirely absent. A possible explanation are much higher water temperatures in 2019 compared to the same period in 2018, and possible effects on the phenology of gelatinous zooplankton. After removing fish larvae and jellyfish, all zooplankton catches samples were conserved in 4%
buffered formalin solution in sweater for alter analysis, and are available for the determination of species composition and abundance of zoo- and ichthyoplankton throughout the 30yr time series.
Stations in the eastern part of Stolpe trench and in the Gdansk Deep and Southern
Gotland Basin were sampled with IKS-80 nets instead of Bongo nets to ensure the compatibility of data with a long-term IKS-80 sampling series maintained by the Latvian Fish Resources Agency (LATFRA; Andrei Makarcuks).
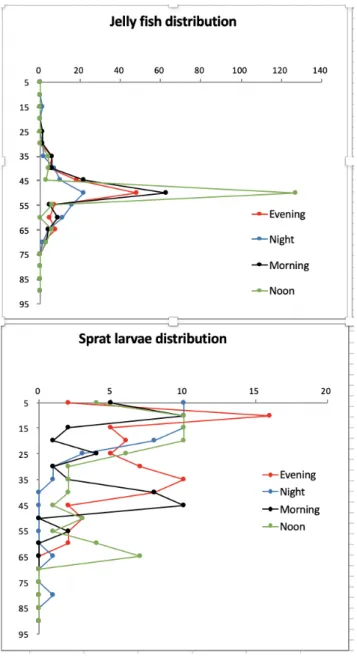
At our key central Bornholm Basin station BB23 Multinet MAXI (300 µm, towed, sampling of the water column in 5 m layers) and MIDI (50 µm, vertical, sampling of the water column in 10 m layers) casts were performed over a one-day period on 25/26 May to assess diurnally resolved vertical distributions of ichthyo- and zooplankton. One of the first results is a markedly different depth distribution of small jellyfish, continually centered around 50-55 m water depth compared to the diel vertical migration of fish larvae (mainly sprat Sprattus sprattus) (Figure 5.1.2).
5.2 Fishery
As oxygen conditions near the bottom were generally low to sustain higher life including fish at water depth >70m, most hauls (except those in Kiel and Mecklenburg Bay) were done within or slightly above the halocline, i.e. in the pelagic zone. Fishery hauls were conducted in Kiel Bight (1 haul), Mecklenburg Bight (1 haul) Arkona Basin (3 hauls), Bornholm Basin (5 hauls), Gotland Basin (3 hauls) and Gdansk Deep (3 hauls). The overall catch composition is shown in Table 5.2.1.
In the Arkona Basin, but also in western parts of the Bornholm basin, the whiting population seems to further increase in abundance compared to earlier years. Individualized samples of whiting (otoliths, fin clips for genetic analysis, gonads and livers) were taken from a total of 125 individuals, and of a further 346 were length /weight were recorded. For cod, single fish data (length, weight, sex and maturity stage) and samples (otoliths, fin clips for genetic analysis, gonads and livers) were obtained for 927 individuals in total. Length and weight were measured for additional individuals. On the positive side, the condition of animals, assessed as Fulton’s K, slightly improved compared to previous years (Figure 5.2.1).
Figure 5.1.2 Depth resolved quantification of zooplankton and ichtyoplankton with the multi-net at Bornholm Basin station BB23. Top panel:
Constant depth distribution of jellyfish ephyrae (mainly Cyanea capillata). Bottom panel sprat (Sprattus sprattus) larvae and their vertical migration movement from deeper layers closer to the surface during night over a 24-hour period on 25-26 May 2019.
Table 5.2.1 Fish catch composition for AL522 of the topmost 6 abundant species. Single fish measurement and samples were taken for 927 cod and 219 whiting individuals. For herring and sprat, sub-samples were taken at each station. For flatfishes and all other species, measurements and fin clips of all individuals were taken.
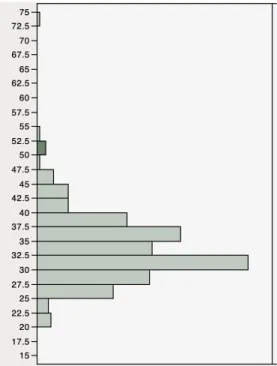
Also, in Bornholm Basin, the main spawning area of Baltic cod, the mean size of individuals has increased slightly from 32.9 cm in 2018 to 33.5 cm in May 2019 (Figure 5.2.2). However, the size structure in general is still not satisfactory, and larger individuals >50 cm, which were frequently observed in past decades, were mostly absent from the population. Both of these observations are consistent with temporal trends over past years. Further analyses will be directed towards what caused the apparent improvement, including a stable isotope analysis of the likely food items in the weeks prior to catch particular individuals.
Figure 5.2.1 Cod individuals were on average in better condition than in previous years, assessed as the ratio between weight and length (Fulton’s K), indicating that the nutritional situation has improved.
An important downstream laboratory analysis will be as to whether and how the genetic structure has changed over time. The objective is here to identify possible gene loci that reveal signs of temporal selection for smaller sizes, i.e. fisheries induced evolution by means of full genome re-sequencing.
For sprat and herring, de tailed stock size structures were recorded for maximally 200 randomly picked individuals. For these planktonic zooplanktivorous species, stomach samples (sprat: 20 per 1 cm length class; herring: 20 per 2 cm length class) as well as 2 kg frost samples were taken at each fisheries station.
5.3 Hydrography
During AL 522, CTD profiles were obtained with the ADM-CTD at 102 stations and the rosette water sampler with attached CTD (14 stations). Two additional vertical oxygen profiles were obtained for calibration purposes at the deep central Bornholm Basin station BB23 by
determining oxygen concentrations in depth resolved water samples taken with the water sampler using the Winkler method on 19 and 24 May.
Compared to early 2019 (cruise AL521 Ostsee “April”), oxygen concentrations in the deeper layers of Bornholm Basin but also Gdansk Deep had decreased considerably and were at 0 ml/l for most of the parts below the halocline in 70-75m depth in both, the Gotland and Bornholm basin. This rapid decay of oxygen influx within only a single month paralleled a similarly rapid decline observed in the April-May interval in 2018. Consequently, the fisheries had to be modified and the trawling happened 15-35m above bottom. Owing to these peculiar oxygen conditions, flatfish had to adopt a pelagic life style and were often caught in the free water column, in particular flounder, plaice and dab (Table 5.2.1). Together with 33 yrs of time series from previous ALKOR cruises, a detailed analysis is planned as to how quickly the oxygen content of oxygenated inflow is respired away, as a function of the rising water temperatures below the halocline that was observed in the past 2 decades. The combined observations of environmental parameters and the differences compared to the same time period in 2018 highlights that in order to make sense of the strong fluctuations in environmental
conditions that are taking place in the Baltic Sea long-term observations over several decades are needed.
5.4 Food web structure of pelagic systems in the deep basins of the Baltic Sea (Dörte Müller-Navarra, EU Horizon 2020 project GoJelly)
Figure 5.2.2 Cod individual size distribution (in cm standard length) in May 2019. Only 2.5% of individuals were >50 cm.
In collaboration with the EU-funded GoJelly project, one cruise component was to assess the role of jellyfish in marine food webs, with a focus on the interactions between jellyfish and commercially important fish species. Here, the Baltic Sea is as one of several case study areas to address these topics, with other areas including Norwegian Fjords, Madeira in the North Atlantic and the eastern Mediterranean. Work during AL522 was a continuation of sampling efforts that took place during the ALKOR cruises AL507 and 509 in April and May 2018, as well as AL521 in Arial 2019 (see the respective cruise reports for details).
During AL522, three stations (KB06 in Kiel Bight, BB 23 in Bornholm Basin, and GB79 in Gotland Basin) were intensively sampled to obtain sample sets for subsequent laboratory analyses of fatty acid and stable isotope composition as food web markers. This included jellyfish ephyrae and small medusae, fish adults and larvae, and the main representatives of lower trophic levels (e.g., copepods, cladocerans). Additionally, phytoplankton and water samples were taken for chlorophyll, carbon to nitrogen ratios, bacteria and nutrient measurements.
5.5 Comparison of traditional net catches of zooplankton and fish species inventory to assessments using eDNA analysis (Thorsten Reusch, Marine Evolutionary Ecology at GEOMAR)
At four stations distributed along the salinity gradient of the Baltic Sea, three replicates of 2L of Niskin water samples from the surface layer and from below the halocline were filtered by gravity through a 0.4 um filter cassette and immediately deep frozen at -80°C. These samples will be DNA extracted later the year, subject to group specific PCR primers targeting the
cytochrome oxidase I genes for crustaceans and for fish, respectively, and deep-sequenced using an Illumina MiSeq analyzer at the IKMB Kiel. The goal of this project will be to compare the species inventory obtained by eDNA to those captured by the zooplankton sampling (i.e. Bongo Nets) and the traditional fisheries using the JFT (pelagic trawl)
5.6 Marine microbes and viruses of the Baltic Sea under climate change (Luisa Listmann, Elisa Schaum, Hamburg University, in collaboration with the Research Unit Marine Evolutionary Ecology at GEOMAR)
As part of this project on the ecological and evolutionary effects of different temperatures and salinities in the Baltic Sea on phytoplankton, we aim to answer the following questions: a) Does the short-term physiological response of picoplankton to temperature and salinity differ between samples from different regions of the Baltic Sea? b) From which regions of the Baltic Sea can we isolate Ostreococcus sp. and its associated viruses?
To help answer these questions, we took surface water samples at 13 stations along the cruise track of AL522. On board, we measured photosynthesis and respiratory activity of two different size fractions (0.2-2 µm and 0.2-37.5 µm) immediately after sampling, and assessed these responses over a gradient of salinity and temperature. Furthermore, water samples of the smaller size fractions were set aside to isolate viruses and picoplankton back in the laboratory at the institute in Hamburg. The 16 stations were divided into Kiel Bay (2 station), Mecklenburg Bay (2 stations), the Arkona Basin (3 stations) and the Bornholm Basin (6 stations).
Preliminary analyses of the temperature curves show that the size fractions are similar in their metabolic activity, but point to differences between different regions along the salinity gradient of the Baltic Sea and the metabolic activities (i.e. GP and R). In-depth analyses are ongoing, and point toward regional environmental forcing (e.g. comparisons between Bornholm Basin and Kiel Bight) having an impact on par with that of seasonal forcing (e.g. comparisons between spring and summer). Our results suggest that while populations from either region can
swiftly adjust their metabolic profiles along gradients of environmental change, the underlying mechanisms differ. For samples from the Bornholm Basin, rapid species sorting seems to explain most of the responses, whereas samples from Kiel Bight tend to respond to environmental change through sorting within the same species and phenotypic plasticity. In-depth analyses are ongoing.
Further, we have had first lysis successes pointing toward the presence of lytic host-virus pairs across the Baltic Sea Basins.
5.7 Assessing microplastic contamination of Baltic waters (Eric Borchert, Grace Walls, Division of Marine Ecology at GEOMAR)
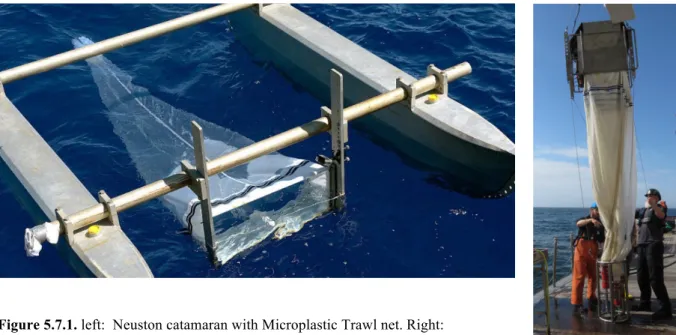
While for the Baltic Sea intense anthropogenic pressure has been documented, we know relatively little on the extent of pollution by plastic. A particular feature worth studying is the vertical stratification of salinity, which effectively creates a density gradient that may trap sinking plastic at a particular depth, corresponding to its density. Originally buoyant plastic may sediment out due to an accumulation of biofilms, becoming encapsulated within transparent exopolymer particles (TEP) or marine snow, or sink outright due to original density. We hypothesize that the strong halocline will act as a boundary to this sinking plastic and cause an accumulation of plastic to occur at depth. This causes the majority of plastic to be found at the surface and at the halocline, with less plastic being found in the depths between these zones. Annually a Maxi-MultiNet (Fig.
5.7.1) was used to collect a vertical profile of the water column in 5 m increments from 0-5m subsurface to 85-90m at the deepest depth. For the first time this year, a Neuston catamaran (Fig.
5.7.1) outfitted with a microplastic trawl net was used to sample the surface and subsurface of the water column (from 0-0.4 m depth) for buoyant plastic. The catamaran was towed starboard of the vessel outside of the wake to prevent any contamination from either the ship or the ships wake from effecting the sample. The catamaran was also equipped with a flowmeter to determine the volume of water filtered by the net. Within Bornholm Basin (station BB23) two Maxi-MultiNet tows were made to compare the surface/subsurface sample of the catamaran with the vertical profile from the Maxi-MultiNet. In addition to sampling the central Bornholm Basin station the catamaran was deployed throughout the Baltic to allow for a horizontal comparison of surface buoyant plastic. The samples were preserved in ethanol until further analysis of microplastic could take place upon returning to land. In addition to these samples 5 blanks of both the catamaran trawl and Maxi-MultiNet were collected along with several laboratory blanks to note the possible microfiber contamination caused by handling and sampling gear. These will also be analyzed upon returning to land to help separate contamination from collected samples.
Figure 5.7.1. left: Neuston catamaran with Microplastic Trawl net. Right:
Deployment of Maxi-MultiNet.
6 Station List
The list and additional cruise data are also permanently available via the GEOMAR OSIS data portal under the link:
https://portal.geomar.de/metadata/cruise/show/348649
ship cruise
ID gear gear nr ship_sta
tion nr yearx month quarter date_st art time
start time
end number
of day Latitude Longitude bottom_d
epth_min bottom_d
epth_max SD area SD + area station
ID Duration min
AL522 CTD 1 1 2019 5 2 15.05.1
9 12:37 12:40 135 544148 102039 25 25 22 KB
22 -
KB KB06 00:03
AL522 WS-Klein 1 1 2019 5 2 15.05.1
9 12:45 12:46 135 544149 102034 25 25 22 KB
22 -
KB KB06 00:01
AL522 JFT 1 1 2019 5 2 15.05.1
9 13:01 13:46 135 544153 102141 28 22 KB KB06 00:45
AL522 CTD 2 2 2019 5 2 15.05.1
9 14:20 14:23 135 544096 103001 26 26 22 KB
22 -
KB KB12 00:03 AL522 Bo/BABo
150, 335, 500 1 2 2019 5 2 15.05.1
9 14:27 14:30 135 544095 102983 27 27 22 KB
22 -
KB KB12 00:03 AL522 Bo/BABo
150, 335, 500 2 3 2019 5 2 15.05.1
9 15:01 15:04 135 544148 102077 19 19 22 KB
22 -
KB KB06 00:03
AL522 WS-CTD 1 3 2019 5 2 15.05.1
9 15:17 15:22 135 544145 102032 25 25 22 KB 22 -
KB KB06 00:05
AL522 Neuston 1 3 2019 5 2 15.05.1
9 17:45 18:10 135 544148 102045 25 25 22 KB
22 -
KB KB06 00:25
AL522 WP2-200 1 3 2019 5 2 15.05.1
9 18:23 18:28 135 544148 102035 25 25 22 KB
22 -
KB KB06 00:05
AL522 WP3 1000 1 3 2019 5 2 15.05.1
9 18:34 18:35 135 545146 102035 25 25 22 KB
22 -
KB KB06 00:01 AL522 Bo/BABo
150, 335, 500 3 3 2019 5 2 15.05.1
9 18:36 18:41 135 544144 102041 24 24 22 KB
22 -
KB KB06 00:05
AL522 WS-Klein 2 4 2019 5 2 15.05.1
9 20:11 20:12 135 543296 104047 20 20 22 KB
22 -
KB KBLL 00:01
AL522 CTD 3 4 2019 5 2 15.05.1
9 20:06 20:07 135 543295 104044 20 20 22 KB
22 -
KB KBLL 00:01
AL522 CTD 4 5 2019 5 2 16.05.1
9 07:31 07:33 136 541117 112741 23 23 22 MB
22 -
MB MB02 00:02
AL522 WS-Klein 3 5 2019 5 2 16.05.1
9 07:36 07:39 136 541117 112740 23 23 22 MB
22 -
MB MB02 00:03 AL522 Bo/BABo
150, 335, 500 4 5 2019 5 2 16.05.1
9 07:47 07:51 136 541129 112748 23 23 22 MB
22 -
MB MB02 00:04
AL522 JFT 2 5 2019 5 2 16.05.1
9 136 22 MB MB02 00:00
AL522 Bo/BABo
150, 335, 500 5 6 2019 5 2 16.05.1
9 10:18 10:21 136 541678 114811 24 24 22 MB
22 -
MB MB01 00:03
AL522 WS-Klein 4 6 2019 5 2 16.05.1
9 10:24 10:25 136 541690 114827 24 24 22 MB
22 -
MB MB01 00:01
AL522 CTD 5 6 2019 5 2 16.05.1
9 10:30 10:33 136 541689 114819 24 24 22 MB
22 -
MB MB01 00:03
AL522 CTD 6 7 2019 5 2 16.05.1
9 12:09 12:11 136 542398 120997 21 21 24 AB
24 -
AB H31 00:02
AL522 150, 335, 500 12:16 542401 120994 AB H31 AL522 Bo/BABo
150, 335, 500 7 8 2019 5 2 17.05.1
9 07:29 07:32 137 543746 121586 18 18 24 AB
24 -
AB H30 00:03
AL522 CTD 7 8 2019 5 2 17.05.1
9 07:37 07:39 137 543760 121616 18 18 24 AB
24 -
AB H30 00:02
AL522 CTD 8 9 2019 5 2 17.05.1
9 08:39 08:41 137 544297 122943 18 18 24 AB
24 -
AB H29 00:02 AL522 Bo/BABo
150, 335, 500 8 9 2019 5 2 17.05.1
9 08:44 08:47 137 544303 122949 18 18 24 AB
24 -
AB H29 00:03 AL522 Bo/BABo
150, 335, 500 9 10 2019 5 2 17.05.1
9 09:37 09:39 137 544984 123668 16 16 24 AB 24 -
AB H28 00:02
AL522 CTD 9 10 2019 5 2 17.05.1
9 09:43 09:45 137 544997 123693 14 14 24 AB
24 -
AB H28 00:02
AL522 CTD 10 11 2019 5 2 17.05.1
9 10:34 10:36 137 545448 124747 27 27 24 AB
24 -
AB H27 00:02
AL522 WS-Klein 5 11 2019 5 2 17.05.1
9 10:40 10:41 137 545452 124749 27 27 24 AB
24 -
AB H27 00:01 AL522 Bo/BABo
150, 335, 500 10 11 2019 5 2 17.05.1
9 10:44 11:48 137 545461 124753 28 28 24 AB
24 -
AB H27 01:04 AL522
Bo/BABo
150, 335, 500 11 12 2019 5 2 17.05.1
9 11:56 12:02 137 545321 130453 43 43 24 AB
24 -
AB H23 00:06
AL522 CTD 11 12 2019 5 2 17.05.1
9 12:05 12:09 137 545348 130489 43 43 24 AB
24 -
AB H23 00:04
AL522 JFT 3 12 2019 5 2 17.05.1
9 12:25 12:55 137 545996 130554 43 24 AB H23 00:30
AL522 CTD 12 13 2019 5 2 17.05.1
9 13:42 13:46 137 545746 131489 46 46 24 AB
24 -
AB H22 00:04 AL522 Bo/BABo
150, 335, 500 12 13 2019 5 2 17.05.1
9 13:49 13:55 137 545754 131497 46 46 24 AB
24 -
AB H22 00:06 AL522 Bo/BABo
150, 335, 500 13 14 2019 5 2 17.05.1
9 18:04 18:10 137 550380 131542 43 43 24 AB
24 -
AB H02 00:06
AL522 WS-Klein 6 14 2019 5 2 17.05.1
9 18:12 18:13 137 550398 131594 43 43 24 AB
24 -
AB H02 00:01
AL522 CTD 13 14 2019 5 2 17.05.1
9 18:19 18:23 137 550400 131594 43 43 24 AB
24 -
AB H02 00:04
AL522 CTD 14 15 2019 5 2 17.05.1
9 19:19 19:22 137 550693 132969 43 43 24 AB 24 -
AB H04 00:03 AL522 Bo/BABo
150, 335, 500 14 15 2019 5 2 17.05.1
9 19:26 19:33 137 550701 132982 43 43 24 AB
24 -
AB H04 00:07 AL522 Bo/BABo
150, 335, 500 15 16 2019 5 2 17.05.1
9 21:24 21:29 137 544681 132927 42 42 24 AB
24 -
AB H20 00:05
AL522 WS-Klein 7 16 2019 5 2 17.05.1
9 21:32 21:33 137 544693 132980 43 43 24 AB
24 -
AB H20 00:01
AL522 CTD 15 16 2019 5 2 17.05.1
9 21:38 21:41 137 544695 132984 42 42 24 AB
24 -
AB H20 00:03
AL522 CTD 16 17 2019 5 2 17.05.1
9 23:01 23:04 137 545643 134685 49 49 24 AB
24 -
AB H18 00:03 AL522 Bo/BABo
150, 335, 500 16 17 2019 5 2 17.05.1
9 23:09 23:15 137 545654 134693 46 46 24 AB
24 -
AB H18 00:06 AL522 Bo/BABo
150, 335, 500 17 18 2019 5 2 18.05.1
9 00:13 00:19 138 550668 134761 44 44 24 AB
24 -
AB H05 00:06
AL522 CTD 17 550697 1134789 AB H05
AL522 CTD 18 19 2019 5 2 18.05.1
9 01:17 01:20 138 550896 140197 44 44 24 AB
24 -
AB H06 00:03 AL522
Bo/BABo
150, 335, 500 18 19 2019 5 2 18.05.1
9 01:23 01:28 138 550900 140190 44 44 24 AB
24 -
AB H06 00:05 AL522 Bo/BABo
150, 335, 500 19 20 2019 5 2 18.05.1
9 02:18 02:23 138 550099 140107 46 46 24 AB
24 -
AB H17 00:05
AL522 CTD 19 20 2019 5 2 18.05.1
9 02:27 02:31 138 550105 140156 46 46 24 AB
24 -
AB H17 00:04
AL522 CTD 20 21 2019 5 2 18.05.1
9 08:35 08:42 138 551749 154502 95 95 25 BB 25 -
BB BB23 00:07 AL522 Bo/BABo
150, 335, 500 20 21 2019 5 2 18.05.1
9 08:46 09:01 138 551749 154506 95 95 25 BB
25 -
BB BB23 00:15
AL522 WS-CTD 2 21 2019 5 2 18.05.1
9 09:37 09:45 138 551745 154496 95 95 25 BB
25 -
BB BB23 00:08
AL522 Neuston 2 21 2019 5 2 18.05.1
9 09:50 10:02 138 551741 154511 95 95 25 BB
25 -
BB BB23 00:12
AL522 Neuston 3 21 2019 5 2 18.05.1
9 10:07 10:19 138 551772 154678 95 95 25 BB
25 -
BB BB23 00:12 AL522
Bo/BABo
150, 335, 500 21 21 2019 5 2 18.05.1
9 10:22 10:58 138 551752 154501 95 95 25 BB
25 -
BB BB23 00:36 AL522 Bo/BABo
150, 335, 500 22 21 2019 5 2 18.05.1
9 10:45 11:14 138 551751 154493 95 95 25 BB
25 -
BB BB23 00:29
AL522 WP2-200 2 21 2019 5 2 18.05.1
9 11:03 11:29 138 551750 154498 95 95 25 BB
25 -
BB BB23 00:26
AL522 WP2-200 3 21 2019 5 2 18.05.1
9 11:16 11:29 138 551750 154500 95 95 25 BB
25 -
BB BB23 00:13
AL522 WS-CTD 3 21 2019 5 2 18.05.1
9 12:12 138 551748 154502 95 95 25 BB
25 -
BB BB23
AL522 IKS-80 1 22 2019 5 2 18.05.1
9 18:12 138 551502 173498 82 82 25 SR
25 -
SR SR49
AL522 CTD 21 22 2019 5 2 18.05.1
9 18:24 18:31 138 551503 173500 82 82 25 SR
25 -
SR SR49 00:07
AL522 CTD 22 23 2019 5 2 18.05.1
9 19:38 19:43 138 551400 175495 63 63 25 SR
25 -
SR SR50 00:05
AL522 IKS-80 2 23 2019 5 2 18.05.1
9 19:45 138 551400 175502 63 63 25 SR 25 -
SR SR50
AL522 IKS-80 3 24 2019 5 2 18.05.1
9 21:31 138 550899 182483 79 79 26 GD
26 -
GD GD56
AL522 CTD 23 24 2019 5 2 18.05.1
9 21:40 21:46 138 550900 182487 79 79 26 GD
26 -
GD GD56 00:06
AL522 CTD 24 25 2019 5 2 18.05.1
9 22:59 23:05 138 545996 184102 92 92 26 GD
26 -
GD GD59a 00:06
AL522 IKS-80 4 25 2019 5 2 18.05.1
9 23:07 23:14 138 545996 184110 92 92 26 GD
26 -
GD GD59a 00:07
AL522 IKS-80 5 26 2019 5 2 19.05.1
9 00:10 00:19 139 545400 185405 98 98 26 GD
26 -
GD GD59 00:09
AL522 CTD 25 26 2019 5 2 19.05.1
9 00:21 00:27 139 545394 185402 98 98 26 GD
26 -
GD GD59 00:06
AL522 CTD 26 27 2019 5 2 19.05.1
9 01:20 01:27 139 544895 190793 103 103 26 GD
26 -
GD GD60 00:07