Coupled benthic and pelagic oxygen, nutrient and trace metal cycling, ventilation and carbon degradation in the oxygen minimum zone of
the Peruvian continental margin (SFB 754).
Cruise No. M 136
11.04. – 03.05.2017 Callao (Peru) – Callao
Solute-Flux Peru I
Marcus Dengler, Stefan Sommer and the shipboard party
Chief Scientist Marcus Dengler
GEOMAR Helmholtz Centre for Ocean Research Kiel
2019
Table of contents
1 Cruise summary ... 3
1.1 Summary in English ... 3
1.2 Zusammenfassung ... 3
2 Participants ... 4
2.1 Principal investigators ... 4
2.2 Scientific party ... 4
2.3 Participating institutions ... 5
2.4 Crew ... 5
3 Research program ... 6
3.1 Aims of the cruise ... 6
3.2 Agenda of the cruise and description of the work area ... 6
4 Narrative of the cruise ... 8
5 Preliminary results ... 10
5.1 Hydrographic observations ... 10
5.1.1 CTD/O2 system and calibration ... 10
5.1.2 Underway-CTD/Rapidcast measurements and calibration ... 12
5.1.3 Thermosalinograph ... 13
5.1.4 Glider operations ... 13
5.1.5 Turbulence measurements using microstructure sensors ... 15
5.2 Current observations ... 15
5.2.1 Vessel mounted acoustic Doppler current profiler ... 15
5.2.2 Mooorings ... 17
5.3 In situ benthic flux measurements, BIGO-I and BIGO-II ... 18
5.4 Porewater geochemistry ... 20
5.5 Surface drifting sediment traps ... 23
5.6 Trace metal sampling ... 25
5.6.1 Trace metal CTD ... 25
5.6.2 Underway tow fish measurements ... 26
5.7 Microbial N transformations: the importance of microniches ... 26
5.8 Evaluation of the biological carbon pump efficiency using the 234Th isotopes ... 28
5.9 Dissolved organic matter sampling ... 29
6 Ship’s meteorological station ... 31
7 Station list M136 ... 32
7.1 Overall station list ... 32
7.2 Station list of marine gel particle samples ... 38
8 Data and sample storage and availability ... 39
9 Acknowledgements ... 40
10 References ... 41
1 Cruise summary
1.1 Summary in English
The magnitude of nutrient and trace metal cycling in oxygen minimum zones (OMZ) and the involved loss of fixed nitrogen is crucial for the ocean’s nutrient budget, particularly in light of the ongoing expansion of OMZs. The major focus of the measurement program that was carried out in the frame of the DFG Collaborative Research Centre (SFB) 754 „Climate-biogeochemical interactions in the tropical ocean“, was to advance interdisciplinary understanding of benthic and pelagic nutrient and trace metal cycling processes in the OMZ off Peru and to quantify loss of nitrogen nutrients. Further objectives were to determine ventilation rates by submesoscale processes, quantify export fluxes of particulate organic matter, determine production and decay rates of dissolved organic material, and investigate mechanisms of iron stabilization, removal and cycling. The physical-biogeochemical measurement program focused on a transect perpendicular to the coastline at 12°S. Additionally, a transect at 14°S was completed and a submesoscale process study in an upwelling filament structure was carried out in the region of 15°S, 77°W. The coordinated sampling scheme included CTD profiling and water sampling stations, shipboard turbulence and velocity observations, a glider swarm experiment, moored velocity and hydrography observations, in situ benthic flux measurements using landers, sediment retrieval with a multiple corer, drifting sediment trap deployments and recovery and in situ pump deployments. The measurement program that was closely linked to the follow-up cruise M137 was successfully completed and all data sets were acquired as planned.
1.2 Zusammenfassung
Die Stärke der benthischen und pelagischen Umwandlungsprozesse von Nährstoffen und Spurenmetallen in Sauerstoffminimumzonen (SMZ) und der damit einhergehende Verlust von Stickstoffverbindungen ist für den Nährstoffhaushalt im Ozean von entscheidender Bedeutung, besonders im Hinblick auf die gegenwärtig beobachtete Ausbreitung von SMZ. Die Hauptzielsetzung des interdisziplinären Messprogramms, das im Rahmen des Kieler SFB 754
„Climate-biogeochemical interactions in the tropical ocean“ durchgeführt wurde, war das benthisch pelagische Nährstoff- und Spurenmetallbudget quantitativ zu erfassen und die Verlustraten von Nährstoffen in der SMZ zu bestimmen. Weitere Zielsetzungen waren die Quantifizierung der Ventilationsraten durch submesoskalige Prozesse, die Bestimmung des Exports von partikulärem organischem Material und der Produktionsraten und des Abbaus von gelöstem organischem Material sowie Untersuchungen zu Stabilisierung, Regenerierung und dem Abbau von Eisenverbindungen. Die physikalisch-biogeochemischen Arbeiten, welche eng mit der nachfolgenden Fahrt M137 verknüpft waren, fokussierten auf einem Schnitt parallel zur Küste bei 12°S. Zusätzlich wurde ein Schnitt bei 14°S und ein Auftriebsfilament bei 15°S, 77°W beprobt. Das benthisch-pelagische Messprogramm umfasste CTD Profilmessungen mit Wasserprobenentnahme, schiffgebundene Turbulenz- und Geschwindigkeitsprofilmessungen, autonome hydrographische und Sauerstoffmessungen durch fünf Ozeangleiter, die Aufnahme von Strömungs- und Schichtungszeitserien durch Verankerungen, benthische in situ Nährstoff- und Spurenmetallflussmessungen und Sedimentprobenentnahme durch Lander und Multicorer, Probenentnahme durch treibende Sedimentfallen und Entnahme von Proben für Spurenstoffisotopenmessungen durch in situ Pumpen. Das Messprogramm wurde erfolgreich und wie geplant abgeschlossen.
2 Participants
2.1 Principal investigators
Name Institution
Dengler, Marcus, Dr. GEOMAR
Sommer, Stefan, Dr. GEOMAR
Achterberg, Eric, Prof., Dr. GEOMAR
Dale, Andrew, Dr. GEOMAR
Engel, Anja, Prof., Dr. GEOMAR
Krahmann, Gerd, Dr. GEOMAR
Lavik, Gaute, Dr. MPI Bremen
Thomsen, Sören, Dr. GEOMAR
2.2 Scientific party
Name Discipline Institution
Dengler, Marcus, Dr Chief scientist, MSS, moorings, lander GEOMAR Achterberg, Eric, Prof., Dr. Trace metals, Fe dynamics, DOP, DON GEOMAR Beck, Antje BIGO Lander, O2, nutrients, technician GEOMAR Bristow, Laura, Dr. Particles, N2-fix, N-loss, incubations MPI-Bremen Cisternas-Novoa, Carolina, Dr. Particle traps, biological oceanography GEOMAR
Clemens, David BIGO Lander, N-geochemistry GEOMAR
Dale, Andy, Dr. BIGO Lander, MUC, N-geochemistry GEOMAR
Hopwood, Mark, Dr. Trace metals, Fe dynamics, Phosp., DOP, DON GEOMAR Karthäuser, Clarissa Particles, incubations, N2-fix, N-loss MPI-Bremen
Klüver, Tanja DOM, cell activity, technician GEOMAR
Krahmann, Gerd, Dr. Glider, CTD, salinometers, physical oceanogr. GEOMAR Lavik, Gaute, Dr. Particles, N2-fix, N-loss, incubations MPI-Bremen Le Moigne, Frederic, Dr. Particle traps, biological oceanography GEOMAR
Lüdke, Jan ADCP. physical oceanography GEOMAR
Massmig, Marie DOM, cell activity GEOMAR
Papenburg, Uwe Mooring, CTD, MSS, technician GEOMAR
Petersen, Asmus BIGO lander, MUC, mechanics, technician GEOMAR Plass, Anna Benthic Fe geochemistry, MUC, BIGO lander GEOMAR
Raeke, Andreas Bordwetterwarte, technician DWD
Rentsch, Harald Bordwetterwarte DWD
Roa, Jon Particle traps, technician GEOMAR
Scholz, Florian, Dr. Benthic Fe geochemistry, MUC, BIGO lander GEOMAR Schüßler, Gabriele Geochemistry, nutrients, technician GEOMAR
Sommer, Stefan, Dr. BIGO lander, biogeochemistry GEOMAR
Surberg, Regina Geochemistry, nutrients, technician GEOMAR
Thomsen, Sören, Dr. u-CTD, glider, physical oceanography GEOMAR Türk, Matthias BIGO Lander, MUC, electronics, technician GEOMAR
Vosteen, Paul Geochemistry GEOMAR
Xie, Ruifang, Dr. Thorium, in situ pumps GEOMAR
2.3 Participating institutions
Name Institution
GEOMAR Helmholtz-Zentrum für Ozeanforschung Kiel
DWD Deutscher Wetterdienst, Geschäftsfeld Seeschifffahrt MPI Bremen Max-Planck-Institut für Marine Mikrobiologie
2.4 Crew
Name Rank
Schubert, Jan F. Kapitän / Master
Reinstädler, Marko Ltd. Naut. Offizier / Chief Officer Göbel, Jens Erster Naut. Offizier / 1st Officer Werner, Lena Zweiter Naut. Offizier / 2nd Officer
Rathnow, Klaus Schiffsarzt / Ship's doctor
Neumann, Peter Leiter der Maschine / Chief Engineer Brandt, Björn 2. Techn. Off. / 2nd Engineer
Heitzer, Ralf 2. Techn. Off. / 2nd Engineer Starke, Wolfgang Elektriker / Electrician
Willms, Olaf Ltd. Elektroniker / Chief Electronics Engineer Hebold, Catharina Elektroniker / Electronics Engineer
Bagyura, Bernhard System Manager / System Manager
Lange, Gerhard Deckschlosser / Fitter
Krüger, Frank Motorenwärter / Motorman
Schroeder, Manfred Motorenwärter / Motorman
Kudraß, Klaus Motorenwärter / Motorman
Wolf, Alexander Bootsmann / Bosun
de Moliner, Ralf Schiffsmechaniker / SM
Zeigert, Michael Schiffsmechaniker / SM
Durst, Planung Schiffsmechaniker / SM
Bußmann, Piotr Schiffsmechaniker / SM
Behlke, Hans-Joachim Schiffsmechaniker / SM
Hampel, Ulrich Schiffsmechaniker / SM
Drakopoulos, Evgenios Schiffsmechaniker / SM
Wernitz, Peter Koch / Chief Cook
Fröhlich, Mike 2. Koch / 2nd Cook
Wege, Andreas 1. Steward / Chief Steward
Jürgens, Monika Steward / Steward
Parlow, Jan Steward / Steward
Zhang, Guomin Wäscher / Laundryman
Schweiger, Sophia Auszubildender / Apprentice
Staffeldt, Felix Auszubildender / Apprentice
3 Research program 3.1 Aims of the cruise
The research cruise to the Peruvian oxygen minimum zone was carried out within the framework of the DFG Collaborative Research Centre (SFB) 754 „Climate-Biogeochemical Interactions in the Tropical Ocean“. The overarching goal of the cruise was to investigate benthic and pelagic cycling of nutrients, oxygen, and trace metals. Specific objectives were to:
quantify the effect of benthic nutrient release on the nutrient inventories in the water column and its feedback on primary productivity at the near surface;
quantify pelagic cycling of nutrients, oxygen, and trace metals;
investigate how particle load and oxygen transport within particles from the euphotic zone regulate the nutrient cycling;
determine effects of anoxia on particle remineralisation rates, elemental stoichiometry, and on patterns of organic geochemical tracer changes during the degradation process;
quantify the role of oxygen and dissolved organic matter transport by submesoscale subduction processes;
improve understanding of organic matter availability to heterotrophic bacteria in oxygen minimum zones;
determine iron fluxes and mechanisms of iron stabilization, removal and recycling, with an emphasis on the effects of spatial and temporal variations in redox conditions in the water column.
3.2 Agenda of the cruise and description of the work area
To improve quantitative understanding of nutrient loss and nutrient cycling in the ocean, physical and biogeochemical observational approaches were combined. In the physical approach, observations were carried out to construct nutrient, oxygen, and trace metal flux budgets. This involves determining turbulent, lateral-diffusive and advective solute (i.e. nutrient, oxygen, and trace metal) fluxes in the water column and combining these with in-situ flux measurements across the sediment interface. To achieve this objective, moorings measuring velocity and hydrography as well as gliders were deployed and shipboard sampling of velocity, turbulence and hydrography was carried out along with solute concentration measurements. Furthermore, biogeochemical measurement techniques were used to directly determine rates of microbial nitrogen transformations by incubations. A particular focus of this pelagic biogeochemical programme was to investigate how particle load and oxygen transport within particles from the euphotic zone regulate the nutrient cycling. On several stations, sinking particles about to enter the anoxic water column were collected using a large water bottle (Snow Catcher). In situ benthic nutrient fluxes were determined with Biogeochemical Observatory (BIGO) landers equipped with benthic chambers. Along the continental slope and shelf of the 12°S transect, 9 BIGO lander stations were carried out at different water depth between 75 m and 1000 m. The benthic flux measurements were complemented by geochemical porewater analysis of sediment cores collected during Multicorer deployments.
Nutrient loss is fuelled by the export flux of organic matter. However, quantitative estimates of export fluxes in OMZs are still sparse. To investigate effects of anoxia on particle
remineralisation rates two different approaches were used: particulate organic matter was collected in different depths of the water column using drifting sediment traps and large volume pumps were deployed from the vessel for thorium isotope measurements in the water column.
A 3-day process study was carried out in upwelling filaments to investigate the interplay of biogeochemical processes in frontal zones that included high-resolution hydrography sampling as well as taking water samples for biogeochemical analysis. This data set should allow to investigate the role of oxygen and dissolved organic matter transport by submesoscale subduction processes. Finally, an iron-free CTD system (TM-CTD) having its own winch and a trace metal free wire was used to collect water samples for trace metal analysis. This data, along with the other data sets collected during the cruise shed new light on iron dynamics in OMZs.
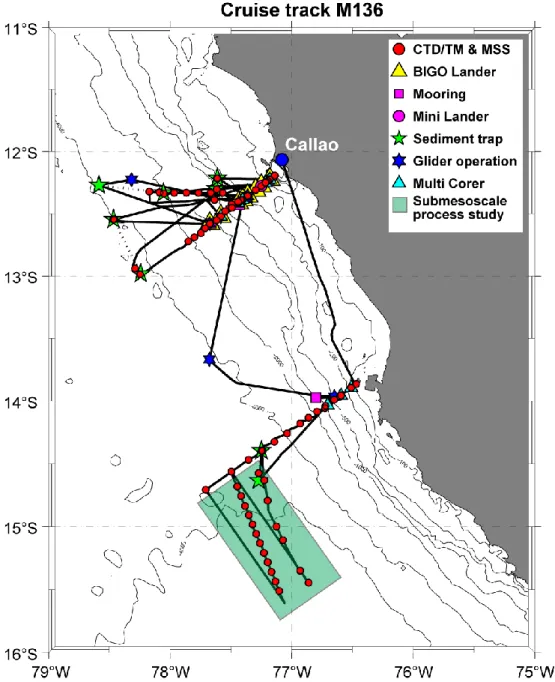
Fig. 3.1 Bathymetric map with cruise track of R/V METEOR cruise M136 (black solid line) including locations of CTD stations, Biogeochemical Observatory (BIGO) Lander, mooring and Mini Lander deployments, sediment trap deployments and recoveries, glider operations and Multicorer stations. The region of the submesoscale process study is contoured in light green.
In accordance with the ship time proposal, we successfully conducted measurements at all planned stations. We followed the DFG regulations summarized in the „Erklärung zu einer verantwortungsvollen Meeresforschung“ and the (OSPAR) Code „Code of Conduct for Responsible Marine Research in the Deep Seas and High Seas of the OSPAR Maritime Area” to avoid unnecessary environmental and ecosystem disturbances. The impact of the conducted work to the environment was very minor. All deployed instruments including moorings, gliders and landers, were recovered on this or the follow-up cruises. There were no activities, which could lead to substantial physical, chemical, biological or geological changes or damage of marine habitats. Care was taken to avoid activities, which could disturb the experiments and observations of other scientists. We made use of the most environmentally-friendly and appropriate study methods, which are presently available, and avoided collecting data that are not essential to conduct the scientific research. The number of samples was reduced to the necessary minimum.
4 Narrative of the cruise
One day before the departure from Callao port, a reception was held on R/V METEOR. It was nicely arranged by the German Embassy in Lima, Peru. About 80 guests joined the reception from different departments of the Peruvian government, colleagues from Peruvian research institutions, and employees of the German Embassy including vice Ambassador Schmidt. We were particularly happy about the visit of vice Minister for Production Hector Soldi and the President of the Peruvian marine research institution IMARPE Admiral Javier Gaviola. The reception was a great success and was complemented upon by our guests.
R/V METEOR left Callao port at noon local time on April 11 and headed south to complete a transect perpendicular to the coastline at 14°S (Fig. 3.1). Weather and sea conditions were excellent during the first 10 days when significant seas of 1 m to 2 m and southeasterly trade winds between 3 Bft. and 5 Bft. were experienced. Measurements along the 14°S transect started in the early morning of April 12 and included conductivity-temperature-depth-oxygen (CTD/O2) profiles and water sampling using Niskin bottles that was analyzed for nutrients and various other biogeochemical parameters. A metal-free CTD/O2 system having its own winch was used to collect water samples for trace metals concentration analysis in the water column. Usually, one trace metal CTD/O2 (TM-CTD/O2) profile was collected each day. Additionally, ship-board microstructure measurements, upper-ocean velocity measurements using R/V METEORs’ Ocean Surveyors, sediment sampling with a Multicorer, particle sampling with a Snow Catcher and thorium sampling using large volume in situ pumps were performed. In the evening of April 12, a mooring with an acoustic Doppler current profiler attached was successfully deployed at 1000 m depth about 5 nm to the north of the transect. Subsequently, the 14°S transect was continued. R/V METEOR arrived at the 5000 m isobath in the morning of April 14, where a drifting sediment trap was deployed.
For the next 3 days, a submesoscale process study (SMPS) was performed to the south of the transect investigating the physical-biogeochemical interaction at fronts and filaments. Satellite sea surface temperature data and real-time data from gliders deployed during the previous cruise in the 14°S region indicated that temperature and salinity fronts were located further offshore than we had anticipated during cruise planning. The sampling region for the SMPS was thus relocated to the region between 14.5°S, 77.8°W and 15.5°S, 76.6°W. Sampling included
underway CTD profiles using the Rapid Cast system, shipboard velocity measurements and CTD/O2 profiles including water sampling that was analyzed nutrients, dissolved organic matter, primary productivity, rates of microbial nitrogen transformations via incubations and trace metals. In total, two CTD/O2 transects and 4 underway CTD transects were competed. In the morning of April 17, the drifting sediment trap deployed three days earlier was recovered about 10 nm to the south of the deployment position. The SMPS was terminated at 15:30 UTC on April 17. After taking a last Multicorer at 800 m depth on the continental slope, the 14°S transect was completed.
While heading towards the main transect at 12°S, two gliders were recovered. The position of the first glider (IFM12) was reached in the late afternoon following the Multicorer station. The second glider (IFM09) had reported difficulties during ascent in the morning of April 17. Since then, it had remained at the sea surface. R/V METEOR arrived at the glider’s position at 23:00 local time and despite darkness, the recovery went very well. It turned out that water had leaked into the nose cone of the microstructure probe attached to the glider. The fast recovery of the package prevented further damage or loss of the instruments.
The main working area at 12°S was reached at 13:00 UTC on April 18. The working schedule along the 12°S transect was predominately constrained by eight 40-hour long deployments of the BIGO landers, four 3 to 6-day deployments of drifting sediment traps, four mooring deployments, glider operations, and sediment sampling using the multi corer that all needed to be conducted during day time. During night time, the measurement program focused on CTD/O2
and TM-CTD/O2 profiling including water sampling, additional water sampling using a bottom water sampling device, particle sampling using a Snow Catcher, intensive microstructure profiling and trace element sampling using large volume in situ pumps.
The coordinated benthic and pelagic sampling concentrated on different water depths along the transect. The location of the stations was chosen based on oxygen and nutrient distributions and on expected benthic providences. On the shelf, benthic - pelagic sampling stations were selected at 75 m, 128 m, 143 m, and 200 m water depth, while along the continental slope stations at 240 m, 300 m, 750 m and 1000 m were sampled. Sampling at these sites included BIGO lander deployments, CTD/O2 profiling and water sampling that were analyzed for oxygen, nutrients, nutrient cycling rates, primary productivity and trace metal concentrations.
Additionally, in situ pump deployments were carried out to determine export rates, a bottom water sampler was used at some of these stations to determine near-bottom nutrient gradients and particles were collected with the Snow Catcher. Microstructure profiling combined with CTD/O2
and nutrient sampling was frequently repeated at these sites to allow for determining diffusive nutrient fluxes due to turbulent mixing. Finally, sediment cores using the Multicorer were taken to complement nutrient and trace metal sampling at these sites.
Moorings with attached acoustic Doppler current profiler and a McLane Moored Profiler were deployed and distributed along the continental slope to allow for determining the role of nutrient advection by the boundary currents. Furthermore, the pelagic measurement program was supported by autonomous glider measurements with additional turbulence and nitrate sensors that sampled a 12°S transect 5 nm to the north of the main transect to avoid collision with the research vessel. Altogether, 6 glider operations were performed in the region of 12°S. The coordinated benthic –pelagic sampling program started with the deployment of a BIGO lander at the 240 m in the late afternoon on April 18 and was terminated after taking sediment samples
with a Multicorer in the morning of May 2. All deployments/recoveries and station measurements within the coordinated sampling were carried out successfully.
Drifting sediment trap deployments along the 12°S transect started in the afternoon of April 20 with a deployment in a water depth of 500 m. Two days later, a second trap was deployed at the outermost position of the transect at 5000 m water depth before the 500 m trap was successfully recovered in the morning of April 24. The analyzed upper ocean velocity data from R/V METEOR’s ocean surveyors and also the surface drift of the 500 m trap had indicated an unexpected but persistent onshore flow during the first week of sampling along the 12°S transect.
The onshore flow originated from the presence of an anticyclonic subsurface mesoscale eddy having its center about 30 nm to the north of the 12°S transect. The eddy had just recently been formed, presumably by an instability process of the Peruvian Undercurrent. To investigate the characteristics of the eddy, a physical-biogeochemical station in the center of the eddy center was carried out in the afternoon of April 26. This station included the deployment of the fourth sediment trap at about 2000 m water depth and in situ pump measurements. Eddy sampling was concluded after a zonal CTD/O2 transect across the inshore flank of the eddy along a 12°20’S that included nutrient concentration measurements during the night of April 26. The 5000 m trap was recovered after 7 days 30 nm to the north of deployment position in the evening of April 29.
The sediment trap released in the eddy center drifted to west and was recovered 40 nm away from its release position on April 30.
The work program was completed at 21:30 UTC on May 2. The cruise was terminated as scheduled in Callao port at 14:00 UTC on May 3.
5 Preliminary results
5.1 Hydrographic observations 5.1.1 CTD/O2 system and calibration
(M. Dengler, G. Krahman, S. Thomsen, J. Lüdke)
A total number of 99 CTD profiles were collected in most cases to full ocean depth. Positions and profiling depth of the casts are detailed in section 7.1. During the whole cruise the GEOMAR SBE7, a Seabird Electronics (SBE) 9plus underwater unit, was used. It was attached to a GO4 rosette frame. The SBE7 was equipped with one Digiquartz pressure sensor (s/n 1162) and double sensor packages for temperature (T), conductivity (C) and oxygen (O) (primary set:
T1 = s/n 4051, C1 = s/n 2512, O1 = s/n 2669; secondary set: T2 = s/n 2120, C2 = s/n 3374, O2 = s/n 992). Additionally, fluorescence and turbidity sensors (Wetlabs), a sensor measuring photosynthetically active radiation (PAR) and a sensor measuring nitrate concentrations were attached to the SBE7. To collect water samples, 24 10-liter bottles were attached to the rosette frame. All sensors worked well throughout the cruise. Data acquisition was done using Seabird Seasave software version 7.23.2.
For calibration of the CTD conductivity and oxygen sensors, conductivity values were determined from 109 water samples using a Guildline Autosal salinometer (AS) and oxygen concentrations were determined from 248 water samples using Winkler titration. Throughout this cruise, conductivity values from the water samples were analyzed using the GEOMAR salinometer AS 8 (Model 8400 B). Only small adjustments to the standardization potentiometer of the salinometers were necessary during the cruises and subsequent sub-standards
determinations within each measurement day indicated an adequate stability of the instrument.
For Winkler titration measurements, the same measurement setup and titration procedures as during M135 and M137 were used. For details, the reader is referred to section 5.2.1 in the M135 cruise report (Visbeck et al., submitted).
CTD conductivity was calibrated using linear dependencies of pressure, temperature and conductivity to match the salinometer-derived values. To increase accuracy of the calibration, salinometer-derived values from M135 and M137 were additionally used for the calibration of the conductivity sensors, as the same sensors were used during all three cruises. CTD oxygen was calibrated using linear dependencies of pressure, temperature and oxygen as well as 2nd order in oxygen and the product of oxygen and pressure. The misfit, taken here as the root-mean square (rms) of the differences between CTD values and the respective water samples, was 0.00010 S/m and 0.00010 S/m for the C1 and C2 sensors, respectively. The conductivity misfit translates into a salinity misfit of 0.0010 psu and 0.0010 psu. The misfits for O1 and O2 sensors on M136 were 0.39 and 0.38 μmol kg-1, respectively. For each fit, the 33% most deviating water samples values were removed to exclude biases by bad samples. For the final data set that will also be publicly available, the primary sensor set was used for all CTD stations. Data from the fluorescence and turbidity sensors and the PAR sensor were calibrated by the calibration coefficients provided by the manufacturer. No further corrections were applied. Data from nitrate sensor (type SUNA, manufactured by Seabird Satlantic, s/n 761) were calibrated against 1149 nitrate measurements made from water samples. The independently collected and processed nitrate data from the SUNA sensor was later merged with the CTD data.
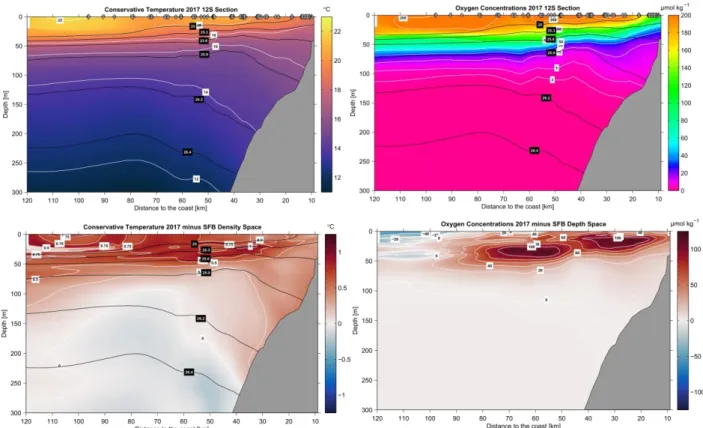
Fig. 5.1: Distance to coast - depth distribution of conservative temperature (upper left panel) and oxygen concentration (upper right panel) along the transect 12°S. Diamonds above the plot mark positions of CTD stations. Black contours indicate isopycnals () in kg m-3. Lower panels show temperature difference (left panel) and oxygen concentration differences (right panel) across the 12°S section between the data collect during January-March 2013 (R/V METEOR M92 and M93 cruises) and the data collected during M136.
CTD/O2 system preliminary results:
In the upper ocean along the 12°S transect, we encountered anomalously warm, saline, and oxygenated waters in comparison to previous cruises. Waters in the upper 80m were about 1°C warmer (Fig. 5.1) and between 0.02 psu and 0.03 psu richer in salinity compared to hydrographic data from 12°S collected during austral summer 2013. This anomalous water mass was also rich in oxygen leading to oxygenated waters above the upper continental slope and shelf in depth shallower than 100m (Fig. 5.1). In contrast, during the previous cruises mentioned above, waters above the upper continental slope and shelf below 30m depth were found to be anoxic (e.g.
Thomsen et al., 2016).
We presume that the anomalous water mass is linked to the coastal El Niño event that had occurred in northern Peru just a few weeks prior to the cruise. The coastal El Niño event was associated with heavy rainfall that led to land-sliding and extensive flooding in northern Peru. A first analysis suggests that the anomalous water mass likely originated from above the EUC core at the equator and was rapidly advected southward along the continental margin off Peru, perhaps by coastally trapped waves (e.g. Pietri et al., 2014).
5.1.2 Underway-CTD/Rapidcast measurements and calibration (S. Thomsen, M. Dengler, G. Krahmann)
The underway RapidCast system allows continuous and autonomous sampling of temperature, salinity and pressure while the vessel is steaming. For measurements from the surface to depth of 100 m, a profile can be obtained about every 4 minutes while the vessel is moving at 10 knots. During the cruise, the RapidCast was deployed during transit and to survey the upper ocean for submesoscale filaments and fronts (Fig. 5.2). A total of 1225 underway
Fig. 5.2: (a) Satellite sea surface temperature from April 14, 2019 showing two cold filaments in the region of the submesoscale process study off Peru. (b) High-resolution temperature transect measured with the underway RapidCast system, (c) oxygen concentrations along the same transect as in but measured with the CTD/Rosette system, and (d) Chlorophyll a (CTD Sensor) and nitrate concentrations (water samples) across a cold filament.
conductivity-temperature-depth (uCTD) profiles were collected during 19 deployments (see section 7.1). Two different uCTD probes (s/n 54 and 155) measuring and internally recording pressure, temperature and conductivity were used along with Teledyne RapidCast system. For the calibration of the sensors, the probes were attached to the CTD rosette during calibration casts. Fortunately, pressure offsets were found to be very small. The subsequent calibration of temperature and salinity included a thermal lag correction and a temporal drift analysis from the comparison between the CTD-calibrated thermosalinograph data and the uCTD surface measurements. It was found that only the salinity of s/n 155 required the addition of a small offset of -0.005 PSU to match the thermosalinograph values. In neither probe a temporal drift of the sensor readings was diagnosed.
One aim of our observational program was to advance understanding on the coupling between physical and biogeochemical processes. Enhanced coupling is expected to occur in the mixed layer at sharp temperature fronts and within cold filaments. We captured these structures with the RapidCast system by measuring hydrography at high-spatial and temporal resolution (Fig. 5.2).
In our optimized sampling strategy, we first identified the exact positions of the features of interest using the RapidCast data and the subsequently sampled biogeochemical parameters within the features.
5.1.3 Thermosalinograph (G. Krahmann, M. Dengler)
Sea surface temperature (SST) and sea surface salinity (SSS) were continuously measured by the ship’s dual thermosalinograph. The system consists of two devices, one with an inlet at the starboard side (TSG1) and the second with an inlet at the portside (TSG2). The area off Peru is difficult for these systems as clogging occasionally limits the water flow in the systems.
Additionally, the strong biological activity leads to elevated drifts of the sensor readings when bio-fouling occurs within the system. The calibration of TSG1 and TSG2 salinities was separated into 2 time intervals. TSG1 required 2nd order time dependent drift corrections, while for TSG2 two constant offsets were sufficient for the two time intervals.
All four temperature sensors (T1 through T4) and both conductivity sensors (S1, S2) were calibrated against the 5 dbar values from the 99 CTD profiles taken during the cruise. Estimated uncertainties are ±0.0179°C (T1), ±0.0157°C (T2), ±0.0179°C (T3), ±0.0136°C (T4), ±0.006 (S1), and ±0.007 (S2).
5.1.4 Glider operations
(G. Krahmann, M. Dengler, S. Thomsen)
An integral component of the measurement program was the use of autonomous platforms (ocean gliders) measuring hydrography, turbulence, and various biogeochemical parameters at high spatial resolution across the continental slope. Altogether, five Slocum gliders (ifm03, ifm07, ifm09, ifm12, ifm13) were used during eight glider deployments (Fig. 5.3, Tab. 5.1). The measurement program started with the deployment of two gliders (ifm12 and ifm09) during R/V METEOR cruise M135 on April 3, 2017 and was completed after the recovery of ifm09 (3rd mission) during R/V METEOR cruise M138 on June 11, 2017.
All gliders were equipped with temperature, conductivity, pressure, chlorophyll (chl-a), turbidity and oxygen sensors. Apart from the sensors built into the gliders, four of the five gliders carried self-contained sensor packages mounted to the gliders’ top (Tab. 5.1). Ifm03 and
ifm09 were equipped with a microstructure probe (MicroRider, Rockland Scientific) with two microstructure shear and two microstructure temperature sensors as well as fast-responding accelerometers while ifm12 and ifm13 was equipped with an optical nitrate sensor (SUNA, Satlantic). All internal and external sensors of the gliders worked well throughout the missions.
Fig. 5.3: Tracks of the eight glider missions carried out during the glider measurement program.
During the cruise, 8 glider operations were carried out. Glider ifm09 and ifm12 were recovered at the beginning of the cruise shortly after completing the 14°S transect on April 17 and 18, respectively. The batteries of both glider were replaced, gliders were cleaned and goose barnacles and seaweed were removed that had slowed down the gliders earlier. On April 20, ifm03 was deployed in 750m water depth at the 12°S section. Three days later on April 23, the shallow water glider ifm07 was deployed on the upper continental slope at 12°S. ifm09 was redeployed on April 25 and ifm03 was deployed on April 29. Both gliders were recovered on the
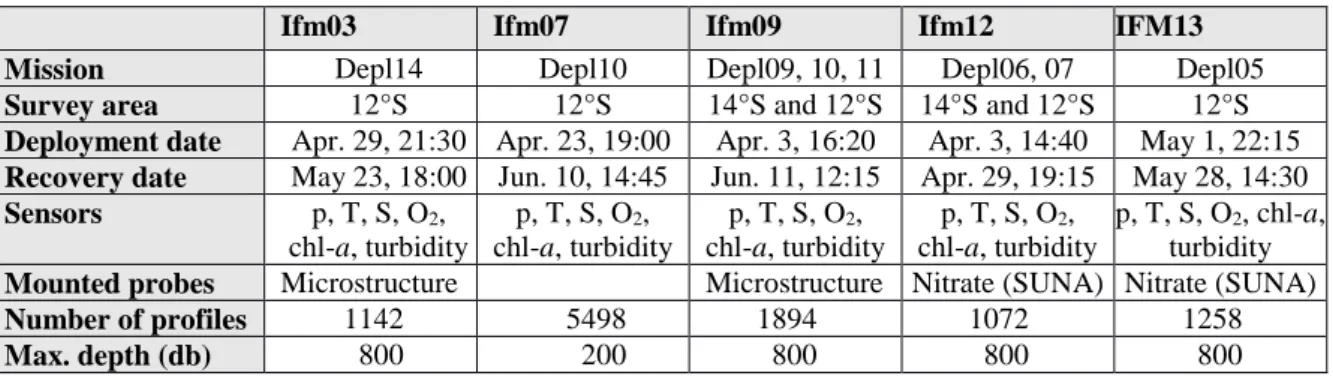
Tab. 5.1: Summary of glider missions. Abbreviations are used as follows: p- pressure, T – temperature, S – salinity, O2 – oxygen concentration, chl-a – chlorophyll.
Ifm03 Ifm07 Ifm09 Ifm12 IFM13
Mission Depl14 Depl10 Depl09, 10, 11 Depl06, 07 Depl05
Survey area 12°S 12°S 14°S and 12°S 14°S and 12°S 12°S
Deployment date Apr. 29, 21:30 Apr. 23, 19:00 Apr. 3, 16:20 Apr. 3, 14:40 May 1, 22:15 Recovery date May 23, 18:00 Jun. 10, 14:45 Jun. 11, 12:15 Apr. 29, 19:15 May 28, 14:30 Sensors p, T, S, O2,
chl-a, turbidity
p, T, S, O2, chl-a, turbidity
p, T, S, O2, chl-a, turbidity
p, T, S, O2, chl-a, turbidity
p, T, S, O2, chl-a, turbidity Mounted probes Microstructure Microstructure Nitrate (SUNA) Nitrate (SUNA)
Number of profiles 1142 5498 1894 1072 1258
Max. depth (db) 800 200 800 800 800
follow up cruise M137. Shortly before the end of the cruise on April 30 glider ifm12 was recovered. Finally, on the second to last day, glider ifm13 was deployed to be recovered on the subsequent cruise. All glider operations were carried out successfully using the rubber boat of R/V METEOR. Details of the glider swarm experiment and plots of the satellite-transmitted data can be retrieved from the GEOMAR web site https://gliderweb.geomar.de/html/swarm09.html.
5.1.5 Turbulence measurements using microstructure sensors (M. Dengler, S. Thomsen, J. Lüdke)
A microstructure measurement program was carried out to quantify pelagic diffusive fluxes of oxygen, nutrients and other solutes due to turbulent mixing along the Peruvian continental slope and shelf. Additionally, the program aimed at advancing the understanding of the mixing processes at the continental slope and shelf. Here, tide-topography interaction generates baroclinic tides and nonlinear internal waves (e.g. Mosch et al., 2012; Erdem et al., 2016) that lead to enhanced near-bottom and near-surface mixing.
The turbulence measurement program consisted of autonomous turbulence sampling by two gliders equipped with microstructure sensors (see section 5.1.4) and of shipboard microstructure profiling system (MSS) manufactured by Sea & Sun Technology. For the ship-based microstructure measurements, two MSS90-D profiler (S/N 26 and S/N 73), a winch and a data interface was used. The loosely tethered profiler were optimized to sink at a rate of 0.55 ms-1. In total, 189 profiles were collected during 45 microstructure stations. Both profilers were equipped with three shear sensors, a fast-response temperature sensor, an acceleration sensor, two tilt sensors and conductivity, temperature, depth sensors sampling with a lower response time.
Additionally, profiler S/N 73 carried an optical oxygen sensor. A comparison of the CTD oxygen sensor data and the MSS oxygen sensor data showed that both sensors were able to resolve comparable small-scale variability of oxygen. The MSS oxygen sensor thus proved to be adequate to resolve the elevated oxygen gradients found in the upper water column off Peru.
Shear sensors attached to profiler S/N 26 during all collected profiles were S/N130 (sh1), S/N 44 (sh2) and S/N 120 (sh3). Profiler S/N 73 was carrying S/N 134 (sh1), S/N 135 (sh2) and S/N 125 (sh3). Due to a loss of sensitivity of S/N 125, we replaced this sensor by S/N 133 prior to MSS station 28 (after S/N 73 profile 58). At the same time, the pre-amplifier of the shear channel was replaced as well.
5.2 Current observations
5.2.1 Vessel mounted acoustic Doppler current profiler (J. Lüdke, M. Dengler)
Upper-ocean velocities along the cruise track were recorded continuously by the two vessel mounted acoustic Doppler current profiler (vmADCP) systems of R/V METEOR. The 38 kHz RDI Ocean Surveyor (OS38) system was operated in narrowband mode with 32 m bins and a blanking distance of 16 m while 55 bins were recorded. The 75 kHz RDI Ocean Surveyor (OS75) was operated in narrowband mode recording 100 bins of 8 m length and a blanking distance of 4 m. The measurement range of the OS75 was about 700 m, but due to low backscatter abundance within the OMZ, the data quality was occasionally reduced between 300 and 400 m depth. The OS38 recorded high-quality data to about 1200 m depth during the whole cruise. Both systems worked reliably throughout the cruise.
Post-processing of the data included bottom editing and a water track calibration of the misalignment angle and amplitude of the Ocean Surveyor signals (Tab. 5.2). To increase data accuracy, we combined the velocity records from M136 and the follow-up M137 for the water track calibration. As indicated by the relatively low standard deviation of the misalignment angle calibration, the collected data set was of high quality.
Tab. 5.2 Misalignment angle, amplitude factor and their uncertainties resulting water track calibration of the Ocean Surveyor data.
OS Mode Misalignment angle
± Standard deviation
Amplitude factor
± Standard deviation
75 NB -1.0267 ± 0.65097 1.0054 ± 0.01314
38 NB -0.43998 ± 0.74786 1.0037 ± 0.01519
Preliminary results vmADCP
During the cruise period, we encountered a moderate poleward Peru-Chile Undercurrent (PCUC, Fig. 5.4) that was situated above the upper continental slope and shelf at depth above 200 m within 50 km of the coast. Poleward velocities averaged between April 18 and May 2 were above 20 cm s-1 on the upper shelf. Maximum climatological average poleward flow within the PCUC is about 10 cm s-1 (Chaigneau et al., 2013).
Figure 5.4: Alongshore velocity across the 12°S section averaged from all data collected between April 18 and May 2, 2017. Negative velocities (blue) indicate southeastward flow. The Peru-Chile
Undercurrent is well pronounced above the upper continental slope and shelf within 40 km of the coast.
Upon arrival at the 12°S section on April 18, the vmADCP data revealed the existence of an anticyclonic subsurface eddy centered about 60 km offshore from the coast that subsequently propagated westward (Fig. 5.5). During the previous cruises in austral summer 2013, the separation of the PCUC core and subsequent evolution of an eddy was observed in detail at exactly the same position (Thomsen et al 2016). This supports previous results suggesting eddy generation to be associated with boundary layer separation of the PCUC (Marshall and Tansley, 2001). The complex topography just upstream of 12°S causes changes in the streamline curvature of the current, which facilitates separation of the flow. Subsequently, several CTD stations were taken from the eddy core to analyze its physical and biogeochemical properties.
5.2.2 Mooorings
(M. Dengler, S. Thomsen, G. Krahmann)
A mooring program carried out during M136 and the subsequent cruises M137 and M138 to investigate the variability of the circulation and hydrography along the continental slope off Peru and to capture internal tides and non-linear internal waves propagating onto the continental slope and shelf. Altogether, four moorings and two oceanographic lander were deployed at different depth along the continental slope near the 12°S and 14°S transects (Tab. 5.3). While all equipment was deployed during M136, the landers’ recovery was carried out during the final days of M137 and all mooring recoveries occurred during M138. Three moorings were equipped with 300 kHz ADCPs that had target depths between 100 m and 250 m. Additionally, these mooring carried a temperature, salinity and pressure loggers and one of those moorings had a second downward-looking ADCP (1200kHz) attached. The forth mooring (KPO 1180) was equipped with a McLane moored profiler (MMP) set to climb the depth range from 15 m to 290 m every 45 minutes. The MMP records 3‐D velocity and CTD data while climbing up and down the mooring cable.
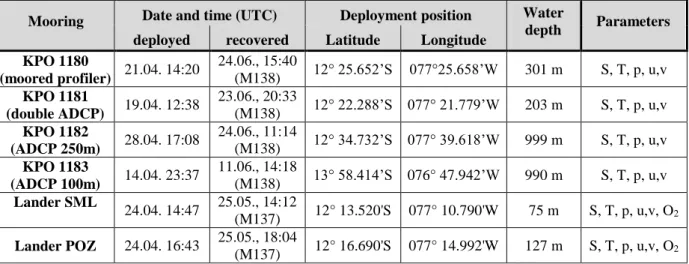
Tab. 5.3 Mooring and landers deployed during M136. A backfall of 8% of the total mooring length was taken into account for determining the mooring position.
Mooring Date and time (UTC) Deployment position Water
depth Parameters deployed recovered Latitude Longitude
KPO 1180
(moored profiler) 21.04. 14:20 24.06., 15:40
(M138) 12° 25.652’S 077°25.658’W 301 m S, T, p, u,v KPO 1181
(double ADCP) 19.04. 12:38 23.06., 20:33
(M138) 12° 22.288’S 077° 21.779’W 203 m S, T, p, u,v KPO 1182
(ADCP 250m) 28.04. 17:08 24.06., 11:14
(M138) 12° 34.732’S 077° 39.618’W 999 m S, T, p, u,v KPO 1183
(ADCP 100m) 14.04. 23:37 11.06., 14:18
(M138) 13° 58.414’S 076° 47.942’W 990 m S, T, p, u,v Lander SML
24.04. 14:47 25.05., 14:12
(M137) 12° 13.520'S 077° 10.790'W 75 m S, T, p, u,v, O2
Lander POZ 24.04. 16:43 25.05., 18:04
(M137) 12° 16.690'S 077° 14.992'W 127 m S, T, p, u,v, O2
Fig. 5.5: Average currents between 50m and 175m depth (arrows). The data suggest a pronounced anticyclonic eddy north of our transect having a center at about 12°20’S, 78°W.
The landers were equipped with a RDI Workhorse Sentinel 300 kHz acoustic Doppler current profiler, RBR CTD recorder, a high precision pressure sensor (accuracy of 0.015%), and an oxygen optode. All sensors worked well and delivered excellent data sets.
5.3 In situ benthic flux measurements, BIGO-I and BIGO-II
(S. Sommer, A. Beck, D. Clemens, A. Dale, A. Petersen, A. Plass, F. Scholz)
Within the Kiel SFB 754 in situ flux measurements across the benthic boundary layer were conducted during METEOR cruises M77-1/2 at a zonal transect at 11°S and along a depth transect at 12°S during M92. These previous cruises revealed that the shelf and upper slope sediments are important for enhanced nutrient release (phosphate, PO43-, ammonium, NH4+, iron). However, these measurements were exclusively conducted during austral summer.
Furthermore, during the M92 cruise benthic fluxes across the Peruvian margin were measured under conditions of high sulfide release from the shelf sediments and bottom waters that were depleted in nitrate (NO3-) and nitrite (NO2-).
During this and the follow-up cruise M137 our aim was to quantify benthic and pelagic fluxes during the onset of the austral winter period following the seasonal maximum of productivity.
Additionally, our measurements were conducted under conditions after the strong El Niño in 2015/16 and prevailing positive sea surface temperature anomalies close to the coast. Major task was to determine natural in situ fluxes of nitrogen species (dinitrogen (N2), NO3-, NO2-, NH4+) as well as PO43-, Fe and trace metals across the sediment water interface under conditions of different bottom water oxygen (O2), NO3- and NO2- concentrations and organic carbon content of the surface sediments.
Two structurally similar BIGO´s (BIGO I and BIGO II) were deployed as described in detail by Sommer et al. (2009). In brief, each BIGO contained two circular flux chambers (internal diameter 28.8 cm, area 651.4 cm2). A TV-guided launching system allowed smooth placement of the observatories at selected sites on the sea floor. Four hours after the observatories were placed on the sea floor the chambers were slowly driven into the sediment (~ 30 cm h-1). During this initial time period where the bottom of the chambers was not closed by the sediment, the water inside the flux chamber was periodically replaced with ambient bottom water. The water body inside the chamber was once further replaced with ambient bottom water after the chamber has been driven into the sediment to flush out solutes that might have been released from the sediment during chamber insertion. To trace nitrogen fluxes (NO3-, NO2-, NH4+), phosphorous and silicate release as well as total alkalinity 8 sequential water samples were removed with a glass syringe (volume of each syringe ~ 46 ml) by means of glass syringe water samplers. The syringes were connected to the chamber using 1 m long Vygon tubes with a dead volume of 5.2 ml. Prior to deployment these tubes were filled with distilled water. Another 8 water samples were taken from inside of one of the two benthic chambers using an eight-channel peristaltic pump, which slowly filled glass tubes (quartz glass). These samples were used for the gas analyses of N2/Ar (Sommer et al. 2016) as well as DIC (Sommer et al. 2017). A further set of 8 glass tubes were used to take samples for trace metal measurements from the other chamber. To monitor the ambient bottom water geochemistry an additional syringe water sampler was employed and another series of eight glass tubes were used. The positions of the sampling ports were about 30 – 40 cm above the sediment water interface. O2 was measured inside the chambers
and in the ambient seawater using optodes (Aandera) that were calibrated before each lander deployment.
During this cruise the glass tubes connected to chamber 1 were used for dissolved iron analyses and were filtered (filter sizes 0.2 and 5 µm) whilst sampling. In addition to the chambers and ambient bottom water vertical nutrient gradients were sampled using an arm that extended vertically from the lander into to water column allowing to sample water in vertical heights from the seafloor of 0.5, 1, 2, 3, and 4 m.
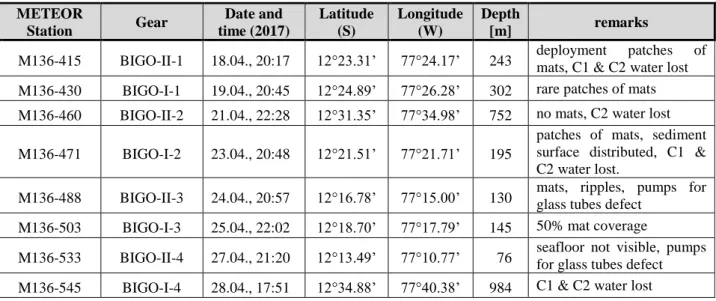
A total of 8 deployments of BIGO I and BIGO II were conducted along the 12°S transect in water depths of 76, 130, 145, 195, 243, 302, 752, and 984 m (Table 5.4). The station at around 400 m water depth was omitted since sampling in this area is difficult due to hard grounds. The samples obtained were used for pore water and solid phase analyses, flux determination of the various solutes mentioned above.
Table 5.4: Station list of BIGO I and BIGO II deployments METEOR
Station Gear Date and
time (2017)
Latitude (S)
Longitude (W)
Depth
[m] remarks
M136-415 BIGO-II-1 18.04., 20:17 12°23.31’ 77°24.17’ 243 deployment patches of mats, C1 & C2 water lost M136-430 BIGO-I-1 19.04., 20:45 12°24.89’ 77°26.28’ 302 rare patches of mats M136-460 BIGO-II-2 21.04., 22:28 12°31.35’ 77°34.98’ 752 no mats, C2 water lost M136-471 BIGO-I-2 23.04., 20:48 12°21.51’ 77°21.71’ 195
patches of mats, sediment surface distributed, C1 &
C2 water lost.
M136-488 BIGO-II-3 24.04., 20:57 12°16.78’ 77°15.00’ 130 mats, ripples, pumps for glass tubes defect
M136-503 BIGO-I-3 25.04., 22:02 12°18.70’ 77°17.79’ 145 50% mat coverage
M136-533 BIGO-II-4 27.04., 21:20 12°13.49’ 77°10.77’ 76 seafloor not visible, pumps for glass tubes defect M136-545 BIGO-I-4 28.04., 17:51 12°34.88’ 77°40.38’ 984 C1 & C2 water lost
Preliminary results benthic fluxes
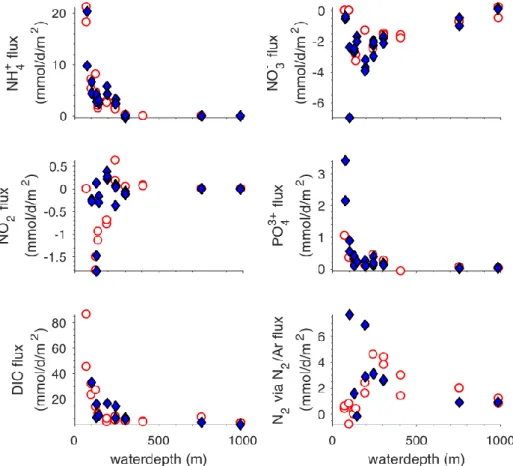
Although the solute concentrations are not finally corrected, first trends of fluxes across the sediment water interface with increasing water depth and distance to the shore line can be detected (Fig. 5.6). Please note that Figure 1 contains data from the subsequent cruise M137 where stations at 74 m (M137-614 BIGO-I-1) and 244 (M137-596 BIGO-II-1) were repeated.
Flux measurements at a station in 100 m water depth (M137-642 BIGO-II-2), which due to time constraints couldn’t be measured during cruise M136 are now included. These fluxes are compared to fluxes determined at the same locations during the previous cruise M92, which was conducted in austral summer (05.01 – 03.02.2013) under conditions of a sulfidic event and oxygen, nitrate and nitrite depleted bottom water on the shallow shelf.
Fig. 5.6: Preliminary in situ fluxes of various solutes across the sediment water interface. Fluxes measured during cruises M136/137 are depicted as blue diamonds in comparison to those of M92 displayed as open red circles.
5.4 Porewater geochemistry
(A. W. Dale, F. Scholtz, A. Plass, B. Domeyer, G. Schüssler, M. Paul, K. Meier) The porewater composition of surface sediments was investigated at nine stations at the 12°S transect and at three stations along the 14°S transect in order to characterize and quantify sediment diagenetic processes below the oxygen-deficient waters offshore Peru. One aim of this cruise was to further our understanding of the benthic-pelagic coupling in oxygen deficient regions of the ocean by examining key geochemical species whose chemical behaviour and distribution are altered via changes in redox potential. Specific emphasis was placed on the biogeochemical cycling of redox sensitive elements such as N, P and Fe, which are preferentially released from sediments under oxygen deficient bottom waters. The magnitude of this recycling flux, the relative importance of key control parameters, and the coupling to the carbon cycle are still poorly understood. In order to overcome this lack of knowledge, we performed geochemical analyses of pore water from surface sediments that were retrieved by multiple-corer (MUC) and benthic lander deployments (BIGO).
Sediment cores (max. ~ 40 cm in length) were retrieved using the multiple-corer (MUC) in addition to smaller push cores recovered with the BIGO landers (max. ~ 15 cm in length). An overview of the sampling stations where porewater was analyzed is given in Table 5.5. After retrieval, all cores were transferred to a cooling lab (12°C, mean bottom water temperature along the transect) and processed within 1-2 hours. Supernatant bottom water of the multiple-cores was
sampled and filtered for subsequent analyses. In general, one main MUC was taken at the same site of BIGO deployments, but not necessarily on the same day. Sediment samples from the cores sectioned in the glove bag were spun in a refrigerated centrifuge at 4000 rpm for 20 min to separate the porewater from the particulates. For all measurements and sub-sampling for redox- sensitive parameters (e.g. Fe, nutrients) from the MUC cores, the sediments were sectioned and porewaters sub-sampled in an argon filled glove bag. The sampling depth resolution increased from 1 cm at the surface to 4 cm at depth. Inside the glove bag, porewater samples were filtered with 0.2 nm cellulose-acetate filters. Porewater extraction yielded 20-50 ml of porewater at each depth interval. BIGO cores from the main (non-experimental) lander deployments were sectioned rapidly under ambient atmosphere, centrifuged, and filtered inside the glove bag.
Sediment samples were also taken for the calculation of sediment density and water content as well as solid phase constituents in the onshore laboratory.
A total of 300 porewater samples were recovered and analyzed (Table 5.5) during the cruise.
Porewater analyses of the following parameters were carried out on board: ferrous iron (Fe2+), nitrate (NO3-), nitrite (NO2-), ammonium (NH4+), phosphate (PO43-), silicate (H4SiO4), total alkalinity (TA) and hydrogen sulphide (H2S). For H2S analysis, an aliquot of pore water was diluted with appropriate amounts of oxygen-free artificial seawater and the sulphide was fixed by immediate addition of zinc acetate gelatine solution immediately after pore-water recovery. NO3-
and NO2- were determined on a Quaatro Autoanalyzer (Seal Analytic) using standard methods (Grasshoff et al., 1999) with detection limits of 30 and 5 nM set by the lowest calibration standards, respectively. NH4+, PO43-, H4SiO4 and H2S nitrate were determined on a Hitachi U- 2001 spectrophotometer with detection limits of 2, 5, 1 and 1 μM (respectively). For the analysis of dissolved Fe2+ concentrations, sub-samples of 1 ml were taken within the glove bag, immediately stabilized with ascorbic acid and later analysed after complexation with 20 μl of Ferrozin. The precision of this assay was <2 %. Samples for TA were analyzed by titration of 0.5-1 ml pore water according to Ivanenkov and Lyakhin (1978). Titration was ended when a stable pink colour appeared. During titration, the sample was degassed by continuously bubbling nitrogen to remove any generated CO2 and H2S. The acid was standardized using an IAPSO seawater solution. The detection limit and precision of the method is 0.05 meq L-1.
Untreated samples were also stored in a refrigerator for onshore analysis of chloride, bromide, and sulphate by ion-chromatography. Acidified sub-samples (3-8 ml with 1% v/v concentrated trace metal grade nitric acid) were prepared for analyses of major ions (K, Li, B, Mg, Ca, Sr, Mn, Br, and I) and trace metals by inductively coupled plasma optical emission spectroscopy (ICP- OES) and inductively coupled plasma mass spectrometry (ICP-MS). Samples for DIC and stable N isotopes (15N, 14N) will also be determined on selected sub-samples in the shore-based laboratories.
Preliminary results porewater geochemistry
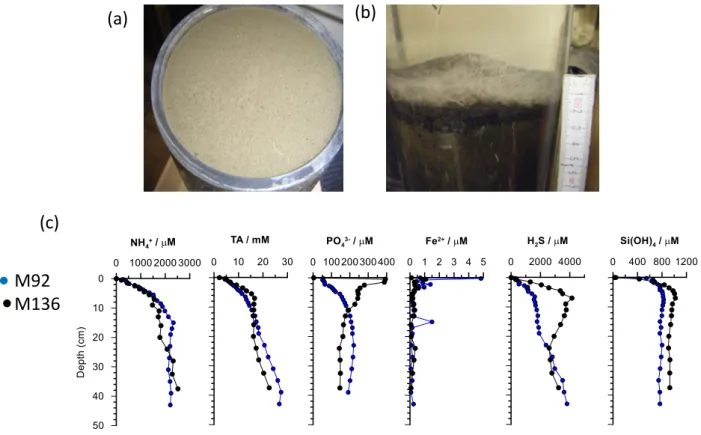
Overall, the porewater data resemble the trends observed at the same stations during cruise M92 in 2013 on board RV METEOR (Dale et al., 2016). A notable exception was found for the shallowest station on the shelf (Fig. 5.7). Whereas in 2013 the surface sediments were covered with thick mats of filamentous sulfide oxidizing bacteria Thioploca spp., during M136 the sediments were devoid of conspicuous surface mats. It is striking that the absence of mats is associated with vastly different concentrations of PO43-, Fe2+ and H2S in the upper 20 cm, which suggests a direct or indirect role of the bacteria in modulating the levels of these solutes in the
porewater. The absence of mats during the present cruise is probably caused by the strong El Niño event in 2015/2016 which is known to ventilate shelf waters and cause a decline in microbial biomass (Gutiérrez et al., 2008). Most likely, a decline in the rate of sulfide oxidation due to the diminished Thioploca community explains the build-up of H2S in the porewater.
These data will be further complemented with solid phase analyses and numerical reaction- transport model simulations to quantify the relative importance of Thioploca and similar organisms to benthic solute exchange at 12°S on the Peruvian margin (e.g. Bohlen et al., 2011).
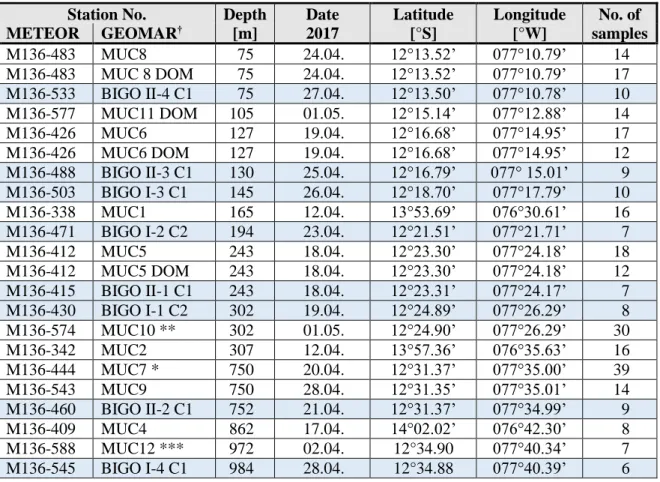
Table 5.5: Stations for geochemical analysis of porewaters from multiple-corer (MUC) and benthic lander (BIGO, chamber 1 (C1) or chamber 2 (C2)) samples listed by water depth. BIGO cores are marked in blue for clarity. Note that sediments from 3 stations (338, 342 and 409) were recovered at 14°S, whereas all other deployments were made at 12°S.
Station No. Depth Date Latitude Longitude No. of
METEOR GEOMAR† [m] 2017 [°S] [°W] samples
M136-483 MUC8 75 24.04. 12°13.52’ 077°10.79’ 14
M136-483 MUC 8 DOM 75 24.04. 12°13.52’ 077°10.79’ 17 M136-533 BIGO II-4 C1 75 27.04. 12°13.50’ 077°10.78’ 10 M136-577 MUC11 DOM 105 01.05. 12°15.14’ 077°12.88’ 14
M136-426 MUC6 127 19.04. 12°16.68’ 077°14.95’ 17
M136-426 MUC6 DOM 127 19.04. 12°16.68’ 077°14.95’ 12 M136-488 BIGO II-3 C1 130 25.04. 12°16.79’ 077° 15.01’ 9 M136-503 BIGO I-3 C1 145 26.04. 12°18.70’ 077°17.79’ 10
M136-338 MUC1 165 12.04. 13°53.69’ 076°30.61’ 16
M136-471 BIGO I-2 C2 194 23.04. 12°21.51’ 077°21.71’ 7
M136-412 MUC5 243 18.04. 12°23.30’ 077°24.18’ 18
M136-412 MUC5 DOM 243 18.04. 12°23.30’ 077°24.18’ 12 M136-415 BIGO II-1 C1 243 18.04. 12°23.31’ 077°24.17’ 7 M136-430 BIGO I-1 C2 302 19.04. 12°24.89’ 077°26.29’ 8 M136-574 MUC10 ** 302 01.05. 12°24.90’ 077°26.29’ 30
M136-342 MUC2 307 12.04. 13°57.36’ 076°35.63’ 16
M136-444 MUC7 * 750 20.04. 12°31.37’ 077°35.00’ 39
M136-543 MUC9 750 28.04. 12°31.35’ 077°35.01’ 14
M136-460 BIGO II-2 C1 752 21.04. 12°31.37’ 077°34.99’ 9
M136-409 MUC4 862 17.04. 14°02.02’ 076°42.30’ 8
M136-588 MUC12 *** 972 02.04. 12°34.90 077°40.34’ 7 M136-545 BIGO I-4 C1 984 28.04. 12°34.88 077°40.39’ 6
† Cores labelled 'DOM' were used for porewater analysis of dissolved organic matter in the onshore laboratory.
* Core for the incubation experiment at 750 m (control core plus 3 replicates).
** Two cores sectioned from this MUC, with and without a thick surface bacterial mat.
*** Two cores sectioned from this MUC deployment.
M92 M136
(a) (b)
(c)
Fig. 5.7: Photographic images of surface sediments at (a) the shelf station (74 m, 483MUC8), and (b) the same station during M92 in 2013. (c) Measured concentration profiles of dissolved NH4+, TA, PO43-, Fe2+, H2S, Si(OH)4 in sediment porewaters sampled by the multi-corer at the shelf station (74 m, 483MUC8) compared to results from the same station during M92 (Dale et al., 2016).
5.5 Surface drifting sediment traps
(F. Le Moigne, C. Cisternas-Novoa, J. Roa)
A crucial biogeochemical mechanism in today’s climate involves the transfer of carbon from the shallow to the deep ocean, the biological carbon pump (BCP). There is currently little consensus on the fate of sinking particles and the efficiency of the BCP in OMZs. Previous particles flux studies have suggested that the BCP is more efficient in suboxic zones relative to well-oxygenated waters. However, incubations performed on sinking material collected in oxic and suboxic environments showed similar remineralization rates in both conditions suggesting that suboxic conditions do not enhance the transfer of sinking organic matter through the mesopelagic zone. Moreover, the export flux of particulate nitrogen is deemed to have a strong influence of the amount of nitrogen lost through microbial processes like annamox and denitrification (Kalvelage et al., 2013). Our work aims at advancing understanding of the biogeochemistry influencing the export of organic matter into the deep ocean in tropical OMZs.
During M136, four surface tethered sediment traps (Engel et al., 2017) were successfully deployed for periods between 72 and 144 hours. Deployments dates, locations, sampling depths and parameters sampled are presented in Fig. 5.8 and Tab. 5.6. The design of the trap devices and the drifting array follows (Knauer et al., 1979), with 12 particle interceptor traps (PITs) mounted on a polyvinyl chloride (PVC) cross frame. The PITs are made of acrylic tubes with an inside diameter of 7 cm, an outside diameter of 7.6 cm and a height of 53 cm. PVC crosses with PITs were attached to a floating line, with a buoy in surface and a weight at the bottom of the