Biodiversity changes and their functional consequences in the pelagic ecosystems of the central Baltic Sea
Cruise No. AL521
April 16
th– May 2
nd2019 Kiel (Germany) – Kiel (Germany)
BALTIC APRIL
Dr. Jan Dierking
GEOMAR Helmholtz Centre for Ocean Research Kiel
2019
Table of Contents
1 Cruise Summary ... 3
1.1 Summary in English ... 3
1.2 Zusammenfassung ... 4
2 Participants ... 5
2.1 Scientific Party ... 5
2.2 Participating Institutions ... 5
3 Research Program ... 6
4 Narrative of the Cruise ... 7
5 Preliminary Results ... 8
5.1 Ichthyo- and zooplankton sampling ... 8
5.2 Fishery ... 9
5.3 Hydrography ... 11
5.4 Food web structure of pelagic systems ... 11
5.5 Fish larvae diet assessed with eDNA ... 11
5.6 Marine microbes and viruses under climate change ... 12
6 Station List ... 13
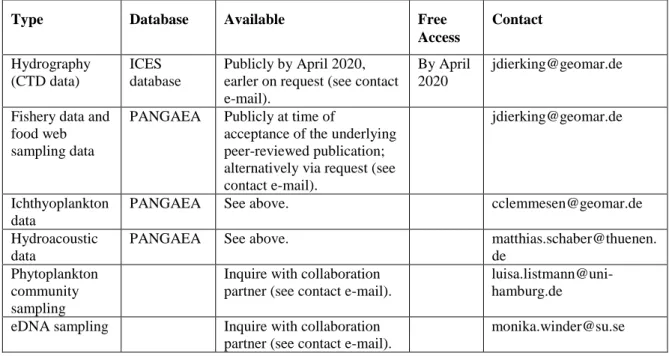
7 Data and Sample Storage and Availability ... 20
8 Acknowledgements ... 20
9 Appendices ... 21
9.1 Selected Pictures of shipboard operations and samples ... 21
1 Cruise Summary 1.1 Summary in English
This multidisciplinary cruise extended a long-term data series on ecosystem composition and functioning of the deeper basins of the Baltic Sea that has been collected in similar form since 1987. The key characteristic of the cruise was the integration of oceanographic and biological information to enhance understanding of environmental, plankton dynamics and fish population fluctuations, and ultimately, evolutionary processes in this system. The spatial focus lay on the Bornholm Basin as most important spawning area of Baltic cod, but also included the Western Baltic Sea, Arkona and Gotland Basin, Gdansk Deep, and Stolpe Trench. All objectives of the cruise were achieved, benefiting from perfect weather conditions and flawless performance of all instruments and gear.
The detailed hydrological survey (oxygen, salinity, temperature) of the entire cruise area showed higher water temperatures and an improvement of the oxygen situation in deep water layers compared to the same time period in 2018. Plankton surveys (zoo- and ichthyplankton including gelatinous plankton, with the goal to determine the composition and the abundance and vertical and horizontal distribution of species, and to take samples for later measurements of nutritional condition) showed a much higher abundance of jellyfish larvae (“ephyrae”) and small adults than in 2018. Regarding fish larvae, sprat and flounder larvae were abundant but very few cod larvae were present throughout the cruise area, both of which was consistent with the
situation in previous years. Pelagic fishery hauls were carried out as planned to determine stock structure and to obtain a range of different samples (gonads, livers, stomachs, tissue samples, otoliths) for cod, whiting, sprat and herring as well as different flatfish species, and are the foundation for a range of different individual-level genetic and ecological analyses to be carried out in the laboratory on land. The abundance and distribution of fishes in the cruise area was also assessed continuously over the duration of the cruise with hydroacoustic methods. As in previous years, cod, herring, sprat and flounder dominated catches. Catches of cod increased compared to 2018, but the absence of large cod individuals in particular in Bornholm Basin was consistent with observations in previous years. Finally, the work for all additional collaborative projects, including in-depth sampling of planktonic food webs for dietary tracer work, sampling and experimental work of photosynthesis and respiration rates of different phytoplankton fractions and finally, pelagic fish stomach and plankton sampling for eDNA assessments was carried out successfully.
The resulting data- and sample sets support ongoing projects in the Research Unit Marine Evolutionary Ecology at GEOMAR, as well as the EU Horizon 2020 project GoJelly and several international collaborations.
1.2 Deutsche Zusammenfassung
Diese multidisziplinäre Ausfahrt erweitert eine seit 1987 in ähnlicher Form laufende Lanzeitdatenreihe zur Ökosystemzusammensetzung und -funktion der Ostsee mit Schwerpunkt auf die tieferen Becken. Alle Ziele der Ausfahrt wurden erreicht, begünstigt von perfekten Wetterbedingungen und fehlerfreien Performance aller Geräte und Instrumente. Ein Schlüsselmerkmal der Ausfahrt war die Integration ozeanografischer und biologischer Daten, um das Verständnis von Schwankungen in Umweltparametern, Planktongemeinschaften und Fischpopulationen und letztendlich der Evolutionsprozesse in diesem System zu verbessern. Die daraus resultierenden Daten- und Probensätze unterstützen laufende Projekte in der Abteilung Marine Evolutionsökologie am GEOMAR sowie das EU-Horizont 2020-Projekt GoJelly und mehrere internationale Kooperationen. Der räumliche Schwerpunkt lag auf dem Bornholmbecken als wichtigstem Laichgebiet des Ostseedorsches, schloss aber auch die westliche Ostsee, das Arkona- und Gotland-Becken, das Danziger Tief sowie die Stolper Rinne ein.
Die detaillierte hydrologische Untersuchung (Sauerstoff, Salzgehalt, Temperatur) des gesamten Fahrtgebiets ergab höhere Wassertemperaturen und eine Verbesserung der Sauerstoffsituation in tiefen Wasserschichten im Vergleich zum gleichen Vorjahreszeitraum.
Planktonuntersuchungen (Zoo- und Ichthyplankton einschließlich gelatinösem Plankton) mit dem Ziel, die Zusammensetzung und Häufigkeit sowie die vertikale und horizontale Verteilung der Arten zu bestimmen und Proben für spätere Messungen des Ernährungszustands zu entnehmen, zeigten ein deutlich höhreres Vorkommen von Quallen-Ephyren als 2018 und ein weit verbreitetes Vorkommen von Sprotten- und Flunderlarven. Die Anzahl der Dorschlarven war wie in den Vorjahren sehr gering. Pelagische Fichereihols zur Bestimmung der Bestandsstruktur, des Reifegrads und der Fruchtbarkeit, sowie der Mageninhalte von Dorsch, Sprotte und Hering, sowie die Entnahme von Organen, Gewebe- und Otolithenproben für genetische und ökologische Analysen des Dorsches wurden wie geplant durchgeführt.
Fischbestände wurden außerdem mit Hilfe von Hydroakustikaufnahmen im gesamten Fahrtgebiet erfasst. Wie in den Vorjahren dominierten Dorsch, Hering, Sprotte und Flunder die Fänge. Die Dorschfänge nahmen im Vergleich zu 2018 zu, auffällig war dabei wie schon in den Vorjahren die Abwesenheit großer Dorschindividuen insbesondere im Bornholmbecken. Die eingehende Analyse der resultierenden Proben- und Datensätze steht noch aus.
Zu guter Letzt konnten alle im Rahmen von externen Kollaborationen geplanten Arbeiten, einschließlich der Detailbeprobung planktonischer Nahrungsnetze für die Untersuchung mit Nahrungsnetztracern, der Probenahme und anschließenden experimentellen Arbeiten an Bord zu Photosynthese und Respiration verschiedener Phytoplanktonfraktionen, und der Beprobung der Mägen der pelagischen Fischarten Hering und Sprotte sowie Planktongemeinschaften für eDNA-Analysen, erfolgreich durchgeführt werden.
2 Participants 2.1 Scientific Party
Name Discipline Institution1
Jan Dierking Marine Evolutionary Ecology (Chief Scientist) GEOMAR
Svend Mees Technician GEOMAR
Felix Mittermayer2 Marine Evolutionary Ecology/Postdoc GEOMAR
Kim Wagner Biological Oceanography/ MSc Student GEOMAR
Alba Filella Lopez de Lamadrid3 Biological Oceanography/MSc Student GEOMAR
Luisa Listmann Marine Evolutionary Ecology/Postdoc UHAM
Peter Hornetz Fisheries Science/MSc Student UHAM
Ina Stoltenberg Marine Ecology/PhD Student SDU
Silvia Kollerova Technician SDU
Christian Pawlitzki Biology/BSc Student CAU
Malgorzata Gosia Dembek Observer NMFRI
Andreas Novotny3 Evolutionary ecology/postdoc SU
Karen Lykkebo2 Evolutionary ecology/PhD Student SU
1Abbreviations explained under Section 2.2.
2First cruise leg Kiel - Kalmar.
3Second cruise leg Kalmar - Kiel.
2.2 Participating Institutions Abbreviation Full name
GEOMAR Helmholtz-Centre for Ocean Research Kiel, Germany CAU Christian-Albrechts-Universität zu Kiel, Germany
UHAM Hamburg University
SDU University of Southern Denmark
SU Stockholm University, Sweden
NMFRI National Marine Fisheries Research Institute, Poland
3 Research Program (including Work Area, Aims and Agenda)
The Baltic Sea is comparatively speaking species poor, yet it provides enormous ecosystems services to the Baltic nations. At the same time, it is one of the systems most affected by the combination of global (including climate) and local anthropogenic changes, and has undergone strong hydrographic and biological shifts in the past decades.
Cruise AL521 extended a 32-year integrative long-term data series of the deep basins of the central Baltic Sea collected since 1987 by the GEOMAR Helmholtz Centre for Ocean
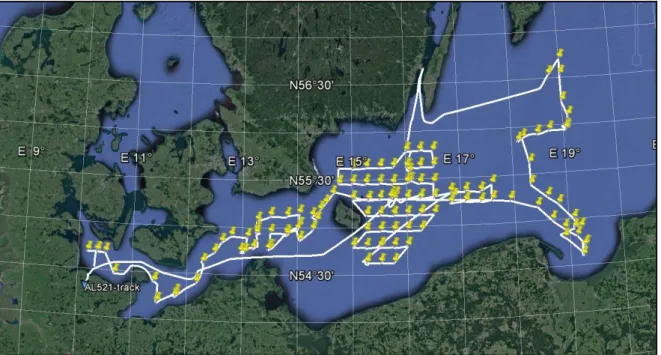
Research and its predecessors IFM-GEOMAR Kiel and IFM Kiel. The specific spatial focus was on the Bornholm Basin as most important spawning area of Baltic cod, but also included the western Baltic Sea, Arkona and Gotland Basin and Gdansk Deep (Figure 3.1), thus covering ICES subdivisions (SD) 22, 24, 25, 26 and 28 (Figure 3.2).
The key characteristic of the cruises contributing to this time series is the integration of oceanographic and biological information, to allow the analysis of Baltic pelagic food webs and (fish) species across the environmental gradients of the Baltic Sea, and under changing
environmental conditions and human exploitation patterns over time. In this context, the datasets and samples obtained during cruise AL521 are essential for a number of projects, including the large-scale international project EU Horizon 2020 GoJelly and collaborations with the Technical University of Denmark, National Institute of Aquatic Resources (DTU Aqua), Stockholm
University, and the University of Hamburg.
Figure 3.1 Cruise track of AL521, with stations indicated by yellow pins (Map produced in Google Earth).
Figure 3.2 ICES subdivisions in the cruise area (Source:
ICES). ICES SD22 corresponds to Kiel Bight = KB, SD24 to Arkona Basin = AB, SD25 to Bornholm Basin = BB and Stolpe Trench = SR, SD26 to Gdansk Deep = GD and Southern Gotland Basin (GB).
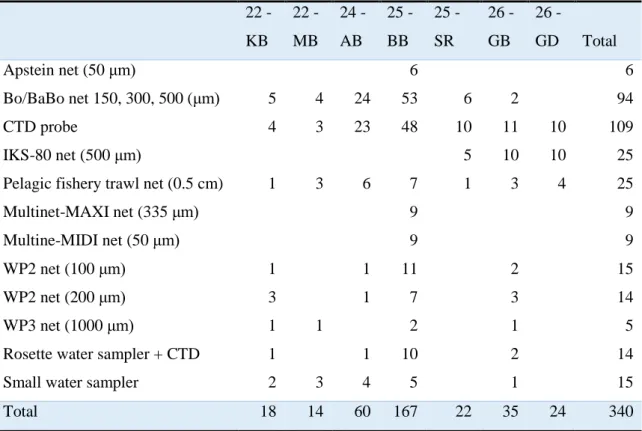
Specific investigations during AL521 included (1) a detailed hydrographic survey (oxygen, salinity, temperature) (109 stations along the cruise track, see Figure 3.1), (2) zoo- and ichthyoplankton surveys to determine the composition, abundance, vertical and horizontal distribution and nutritional status of species as well as patterns of plankton phenology (same 109 stations, Figure 3.1), (3) whole food web sampling including nutrients, seston, phyto-, zoo- (including jellyfish) and ichthyoplankton (4 stations), and (4) pelagic fishery hauls (25 stations).
The latter served firstly to determine size distributions, maturity status, and length – weight relationships of the three dominant fish species in the pelagic system of the Baltic, cod (Gadus morhua), herring (Clupea harengus) and sprat (Sprattus sprattus) as well as flatfishes including flounder (Plathichthys flesus). Secondly, various samples for more detailed analyses back on land were obtained, including cod gonads, livers and otoliths, herring and sprat stomachs and whole samples for dietary analyses, and tissue samples of cod, flounder, whiting, plaice and other species for genetic and stable isotope analysis. In addition, hydroacoustic data were
collected continuously along the cruise track for later analysis of fish abundance and distribution.
Finally, additional work in the context of collaborations with external groups were (5) sampling and experimental work of photosynthesis and respiration rates of different phytoplankton fractions and (6) pelagic fish stomach and plankton sampling for eDNA assessments.
4 Narrative of the Cruise
RV ALKOR was loaded on the days prior to the onset of the cruise. ALKOR then departed from the GEOMAR Westshore pier on April 16 2019 at 08:00 am (all times board time) and headed to the first research area in Kiel Bight (SD22). In the following, all work laid out in the original cruise program was accomplished as planned, benefiting from perfect working conditions on board without any equipment problems. Weather over the duration of the cruise was calm, warm and mostly sunny, in an unusual departure from weather patterns experienced during April cruises in the same working area in previous years.
Over the course of the cruise, pelagic fishery hauls, zooplankton hauls with Bongo/IKS- 80 nets, water sampler, and CTD hauls were carried out following a large-scale spatial sampling design covering Kiel Bight (SD22) on April 16, Mecklenburg Bight (SD22) on April 17, Arkona Basin (SD24) on April 18-19, Bornholm Basin (SD25) on April 20 and again in more detail from April 25 to May 1, Stolpe Trench (SD25) on April 20, Gdansk Deep (SD26) on April 21-22, and Gotland Basin (SD26) on April 23 (Figure 3.1, 3.2). Hydroacoustic data obtained with four different echosounder frequencies (38, 70, 120 and 200 kHz) were continuously recorded over the duration of the cruise.
The scientific work was interrupted by a scheduled harbor stay in Kalmar, Sweden on April 23-25 to disembark two scientists and embark two replacements. The stay was extended by one day due to a passing low pressure system and strong winds in the cruise area on April 24.
In addition to the program above, the central deep station BB23 in Bornholm Basin was intensively sampled on two occasions, early in the cruise on April 20 (including CTD casts, zooplankton sampling with Bongo, Apstein and WP-2 nets, oxygen measurements of water samples obtained with the rosette water sampler with the Winkler method for the calibration of oxygen probe measurements, and phytoplankton sampling) and late in the cruise on April 30 – May 1 (same sampling as on April 18, followed by the detailed vertically and temporally resolved sampling of plankton communities by four towed Multinet MAXI and four vertical Multinet MIDI hauls over a 24 hour period, covering the water column in 5 m and 10 m depth layers, respectively). Moreover, whole food web samples (nutrients, seston, phyto- and
zooplankton including jellyfish and fish larvae) were obtained at 4 stations, using a combination of water sampler, Bongo, WP-2 and WP-3 hauls. Additional sampling was carried out
throughout the cruise area for the special projects on phytoplankton communities (surface water samples at 16 stations) and on eDNA assessments of pelagic fish diets (7 stations). Table 4.1 provides a spatially resolved overview over all gear deployments during AL521.
Table 4.1 Overview of gear deployments during AL521. Mesh sizes of all nets are given in brackets. For location designations (combination of ICES SD and abbreviated name), see Figure 3.2.
22 - KB
22 - MB
24 - AB
25 - BB
25 - SR
26 - GB
26 -
GD Total
Apstein net (50 μm) 6
6
Bo/BaBo net 150, 300, 500 (μm) 5 4 24 53 6 2 94
CTD probe 4 3 23 48 10 11 10 109
IKS-80 net (500 μm) 5 10 10 25
Pelagic fishery trawl net (0.5 cm) 1 3 6 7 1 3 4 25
Multinet-MAXI net (335 μm) 9
9
Multine-MIDI net (50 μm) 9
9
WP2 net (100 μm) 1 1 11 2 15
WP2 net (200 μm) 3 1 7 3 14
WP3 net (1000 μm) 1 1 2 1 5
Rosette water sampler + CTD 1 1 10 2 14
Small water sampler 2 3 4 5 1 15
Total 18 14 60 167 22 35 24 340
5 Preliminary Results
5.1 Ichthyo– and zooplankton sampling
Bongo- and Babybongo hauls covered Kiel Bight (5 hauls), Mecklenburg Bight (4 hauls), Arkona Basin (24 hauls), and Bornholm Basin including the western part of Stolpe Trench (53 hauls) (Table 4.1). Larvae of sprat (Sprattus sprattus; n = 1027), flounder (Plathichthys flesus; n
= 677), sculpin (Myoxocephalus scorpius, n = 2), common seasnail (Liparis liparis; n = 67) and sandeel (Ammodytes tobianus; n = 1) were picked from the 500 µm bongo-samples and 300 µm Multinet samples and conserved at -80 °C for subsequent RNA/DNA, stable isotope and genetic analyses. A low number (n = 6) of cod (Gadus morhua) larvae was found. This compares to a complete lack of cod larvae in catches in 2018, but is generally consistent with low abundances observed on our spring cruises in previous years. It also fits the observation of a long-term, decadal scale shift in the reproductive period and the subsequent occurrence of cod larvae in the Bornholm Basin from spring to summer months.
All of the 500 µm Bongo und the 300 µm Multinet MAXI samples were also checked for the presence of gelatinous zooplankton. Ephyrae (larvae) and small adults of scyphozoan
jellyfish (identified on board as Cyanea capillata, potentially low numbers of Aurelia aurita) were present in much higher abundances than in 2018 (n = 1550 vs. less than 10), whereas the invasive combjelly Mnemiopsis leidyi was present only in low numbers (n = 5). A possible explanation may lie in the much higher water temperatures in 2019 compared to the same period in 2018, and possible effects on the phenology of gelatinous zooplankton. Following these initial on board steps, all Bongo samples were conserved in formol, and are available for the
determination of species composition and abundance of zoo- and ichthyoplankton.
Stations in the eastern part of Stolpe trench and in the Gdansk Deep and Southern
Gotland Basin were sampled with IKS-80 nets instead of Bongo nets to ensure the compatibility
of data with a long-term IKS-80 sampling series maintained by the Latvian Fish Resources Agency (LATFRA; Andrei Makarcuks).
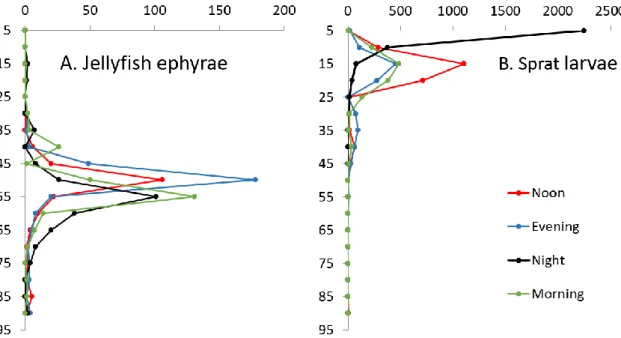
Repeated Multinet MAXI (300 µm, towed, sampling of the water column in 5 m layers) and MIDI (50 µm, vertical, sampling of the water column in 10 m layers) casts were done over a 24 hour period on April 30 – May 1 on the central deep Bornholm Basin station BB23 to assess diurnally resolved vertical distributions of ichthyo- and zooplankton. A notable pattern here was the different depth distribution of jellyfish (centered around the 50-55 m depth line, little diurnal vertical variation) and fish larvae (e.g., sprat: diurnal migration from depths around 20 m during the day to the surface at night) (Figure 5.1.1).
Figure 5.1.1 Depth distribution of A. jellyfish ephyrae (Cyanea capillata) and B. sprat (Sprattus sprattus) larvae observed on the central Bornholm Basin station BB23 over a 24 hour period on April 30 – May 1 2019.
5.2 Fishery
Pelagic fishery hauls were conducted in Kiel Bight (1 haul), Mecklenburg Bight (3 hauls) Arkona Basin (6 hauls), Bornholm Basin (7 hauls), Stolpe Trench (1 haul), Gotland Basin (3 hauls) and Gdansk Deep (4 hauls) (Table 4.1).
Catches of cod in Mecklenburg Bight, which was sampled for the first time in 2019 on one of our April cruises, stood out in being much higher and characterized by on average larger individuals than in our “standard operating areas” in SD24-26. While own prior data for
comparison are lacking, this observation is consistent with findings of collaborators e.g., in March and August in the same area (personal communication Jens-Peter Herrmann, Hamburg University). For SD24-26, catches of cod were higher than for the same time period in 2018.
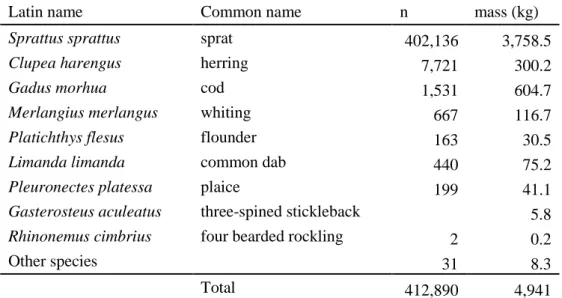
This may in part be explained by improved catchability due to higher oxygen concentrations (see Section 5.3) and resulting higher cod densities near the bottom compared to the more vertically dispersed distribution in 2018. Catches of sprat and flatfishes were higher and of herring somewhat lower than in previous years. It is however important to note that direct quantitative comparisons of catches between years are difficult because the trawls are not standardized. The overall catch composition is shown in Table 5.2.1.
Length (cm)
Frequency
54 48 42 36 30 24 18 12 80 70 60 50 40 30 20 10 0
31.1
Table 5.2.1 Fish catch composition for AL521. Single fish measurement and samples were taken for 900 cod and 219 whiting individuals. For herring and sprat, sub-samples were taken at each station. For flatfishes and all other species, measurements and fin clips of all individuals were taken.
Latin name Common name n mass (kg)
Sprattus sprattus sprat 402,136 3,758.5
Clupea harengus herring 7,721 300.2
Gadus morhua cod 1,531 604.7
Merlangius merlangus whiting 667 116.7
Platichthys flesus flounder 163 30.5
Limanda limanda common dab 440 75.2
Pleuronectes platessa plaice 199 41.1
Gasterosteus aculeatus three-spined stickleback 5.8 Rhinonemus cimbrius four bearded rockling 2 0.2
Other species 31 8.3
Total 412,890 4,941
For cod, single fish data (length, weight, sex and maturity stage) and samples (otoliths, fin clips for genetic analysis, gonads and livers) were obtained for 900 individuals in total (see Figure 5.2.2 for illustration). Length and weight were measured for an additional 631 individuals. In Bornholm Basin, the main spawning area of Baltic cod, the mean size of individuals had declined to 31.1 cm from 32.9 cm in 2018 (Figure 5.2.1), and larger individuals >45 cm, which were frequently observed in past decades, were mostly absent from the population. Both of these observations are consistent with temporal trends over past years, and represent a dramatic
difference from size distributions in the 1980s and 1990s, when much larger individuals were prevalent in the population.
For sprat and herring, stomach samples (sprat: 20 per 1 cm length class; herring: 20 per 2 cm length class) as well as 2 kg frost samples were taken at each station.
Figure 5.2.1 Length frequency distribution of cod sampled in SD25 during AL521 (n = 561). The mean size of individuals, 31.1 cm, is marked on the x-axis, and compares to 32.9 cm in 2018.
Figure 5.2.2 Samples (otoliths, fin clips, gonads, livers) and measures (total length, weight, gutted weight, liver and gonad weight) were taken from 900 out of 1531 cod individuals (illustrated here for a 38 cm female, maturity stage IV, with full stomach, from Bornholm Basin). Photo: S. Nickel
5.3 Hydrography
CTD profiles were obtained with the ADM-CTD (109 stations) and the HYDROBIOS water sampler with attached CTD (14 stations). Two additional vertical oxygen profiles were obtained for calibration purposes at the deep central Bornholm Basin station BB23 and the Gotland Basin station GB79, by determining oxygen concentrations in depth resolved water samples taken with the water sampler using the Winkler method.
Compared to the same time period in 2018, oxygen concentrations in the deeper layers of Bornholm Basin but also Gdansk Deep showed an increase, and the extent of areas with anoxic (0 ml/l) or hypoxic (< 2 ml/l) conditions at depths below of 70 m and down to the bottom declined. Consequently, the reproductive volume for cod increased. Temperatures above the halocline were in the range of ~6°C compared to ~3 °C in the same period in 2018, i.e., clearly higher. In the western Baltic Sea (SD22 - Mecklenburg Bight and the western part of SD24 - Arkona Basin), surface salinities were clearly reduced, around 9 psu vs. 11-15 in previous years, which was likely related to a consistent period of easterly winds that prevailed right up to the start of the cruise, pushing low salinity surface waters from more eastern areas westwards. The combined observations of environmental parameters and the differences compared to the same time period in 2018 once again unscored the strong potential for fluctuations in environmental conditions from year to year on top of any long-term changes that are taking place in the Baltic.
5.4 Food web structure of pelagic systems in the deep basins of the Baltic Sea (Ina Stoltenberg, Jan Dierking, EU Horizon 2020 project GoJelly)
Work during AL521 was a continuation of sampling efforts that took place during the ALKOR cruises AL507 and 509 in April and May 2018 (see the respective cruise reports for details). The project aims to provide better understanding of the role of jellyfish in marine food webs, with a focus on the interactions between jellyfish and commercially important fish species. In GoJelly, the Baltic Sea is as one of several case study areas to address these topics, with other areas including Norwegian Fjords, Madeira in the North Atlantic and the eastern Mediterranean.
During AL521, four stations (KB06 in Kiel Bight, BB15 and 23 in Bornholm Basin, and GB79 in Gotland Basin) were intensively sampled to obtain sample sets for later analyses of fatty acid and stable isotope composition as food web markers. This included jellyfish ephyrae and small medusae, fish adults and larvae, and the main representatives of lower trophic levels (e.g., copepods, cladocerans). Additionally, phytoplankton and water samples were taken for chlorophyll, carbon to nitrogen ratios, bacteria and nutrient measurements. All sampling was carried out as planned, resulting in a total set of 403 samples for food web analysis and
additional analyses back in the laboratory on land. Additionally, tissue samples of 294 jellyfish individuals were taken to support genetic analyses of Norwegian GoJelly partners at NTNU.
5.5 Importance of zooplankton species as prey for fish larvae in the Baltic Sea assessed with eDNA analysis (Andreas Novotny, Karen Petersen, Monika Winder, Stockholm University, in collaboration with the Research Unit Marine Evolutionary Ecology at GEOMAR)
This research project based at Stockholm University aims to study ecosystem-wide species interactions in the Baltic Sea. By applying DNA metabarcoding to field collected specimens we want to increase our understanding of each species ecological niche and trophic positioning, and answer the question “who eats whom?”. The main objective during AL521 was to expand our studies beyond plankton-plankton interactions and include larger consumers such as fish larvae and fish. We collected samples from bacteria and phytoplankton communities, micro- and mesozooplankton, fish larvae (sprat and flounder) and adult fish stomachs from sprat, herring and sticklebacks and preserved them for later DNA analysis. Samples were collected in Kiel
Bight (KB06), Arkona Basin (H22), Gotland Basin (BG79), and the Bornholm basin (BB07, BB15, BB23, and BB35). Given the taxonomic and spatial coverage of the sampling, this cruise turned out successful and the objectives were accomplished. As next steps, the diversity of 16S and 18S rRNA genes associated with the content of fish stomachs and guts will be analysed on an Illumina MiSeq sequencing platform during summer and fall 2019. We are also developing a quantitative PCR assay to be able to estimate the proportions of copepods, rotifers and cladocerans in the diet of planktivorous fish and fish larvae.
Figure 5.5.1 Output of own previous work (in progress) illustrating the proportion of different food items (lower) associated with different consumers (upper - in this case microzooplankton).
5.6 Marine microbes and viruses of the Baltic Sea under climate change (Luisa Listmann, Elisa Schaum, Hamburg University, in collaboration with the Research Unit Marine Evolutionary Ecology at GEOMAR)
As part of this project on the ecological and evolutionary effects of different temperatures and salinities in the Baltic Sea on phytoplankton, we aim to answer the following questions: a) Does the short-term physiological response of picoplankton to temperature and salinity differ between samples from different regions of the Baltic Sea? b) From which regions of the Baltic Sea can we isolate Ostreococcus sp. and its associated viruses?
To help answer these questions, we took surface water samples at 16 stations along the cruise track of AL521. On board, we measured photosynthesis and respiratory activity of two different size fractions (0.2-2 μm and 0.2-37.5 μm) immediately after sampling, and assessed these responses over a gradient of salinity and temperature. Furthermore, water samples of the smaller size fractions were set aside to isolate viruses and picoplankton back in the laboratory at the institute in Hamburg. The 16 stations were divided into Kiel Bay (1 station), Mecklenburg Bay (3 stations), the Arkona Basin (4 stations), the Bornholm Basin (6 stations) and the southern Gotland Basin (1 station).
Preliminary analyses of the temperature curves (see Figure 5.6.1) show that the size fractions differ in their metabolic activity, but also point to differences between different regions along the salinity gradient of the Baltic Sea. In-depth analyses are ongoing, and point toward regional environmental forcing (e.g. comparisons between Bornholm Basin and Kiel Bight) having an impact on par with that of seasonal forcing (e.g. comparisons between spring and summer). Our results suggest that while populations from either region can swiftly adjust their metabolic profiles along gradients of environmental change, the underlying mechanisms differ.
For samples from the Bornholm Basin, rapid species sorting seems to explain most of the responses, whereas samples from Kiel Bight tend to respond to environmental change through sorting within the same species and phenotypic plasticity. In-depth analyses are ongoing.
Further, we have had first lysis successes pointing toward the presence of lytic host-virus pairs across the Baltic Sea Basins.
Figure 5.6.1 Temperature reaction norms based on raw data from size fractioned on-board incubations of Kiel Bight, Arkona, and Bornholm samples across a temperature gradient (3ºC - 20ºC). The left-hand side is for photosynthesis rates in µmol O2 h-1, and the right-hand side, for respiration rates in µmol O2 h-1. Symbols denote different stations, and the colour gradient the assay temperature (warm – red; cold – blue). Fraction and basin both explain most of the variability found within the temperature profiles. These data were normalized for biomass upon arrival in Hamburg, which changes the intercept, but not the shape of the curves.
6 Station List
In total, 340 gear deployments took place during this cruise (see Table 4.1 for an overview, and Table 6.1 for the full station list). The electronic version of the list and additional cruise data are also permanently available via the GEOMAR OSIS data portal under the link:
https://portal.geomar.de/metadata/leg/show/348646 .
Table 6.1 Station list with all 340 gear deployments during of AL521
Gear Gear nr Station nr SD Station Year Date Time Lat. Long. Depth Duration
CTD 1 1 22 KB06 2019 4/16/2019 10:21 544150 102039 27 0:04
WS-klein 1 1 22 KB06 2019 4/16/2019 10:28 544140 102050 27 0:02
JFT 1 1 22 KB06 2019 4/16/2019 10:49 544140 102180 27 0:36
Bo/BaBo 150, 300, 500 1 2 22 KB03 2019 4/16/2019 15:28 544117 101035 20 0:04
CTD 2 2 22 KB03 2019 4/16/2019 15:38 544149 101007 19 0:03
WS-CTD 1 3 22 KB06 2019 4/16/2019 16:19 544151 102037 27 0:10
Bo/BaBo 150, 300, 500 2 3 22 KB06 2019 4/16/2019 16:45 544156 102098 27 0:05 Bo/BaBo 150, 300, 500 3 3 22 KB06 2019 4/16/2019 16:58 544137 102055 25 0:05 Bo/BaBo 150, 300, 500 4 3 22 KB06 2019 4/16/2019 17:09 544141 101990 25 0:04
WP2 200 1 3 22 KB06 2019 4/16/2019 18:01 544151 102043 27 0:03
WP2 200 2 3 22 KB06 2019 4/16/2019 18:08 544151 102044 27 0:03
WP2 200 3 3 22 KB06 2019 4/16/2019 18:13 544150 102043 27 0:04
WP2 100 1 3 22 KB06 2019 4/16/2019 18:20 544147 102044 27 0:03
WP3 1000 1 3 22 KB06 2019 4/16/2019 18:27 544149 102047 27 0:03
Bo/BaBo 150, 300, 500 5 4 22 KB12 2019 4/16/2019 19:05 544092 102939 28 0:04
CTD 3 4 22 KB12 2019 4/16/2019 19:13 544098 102984 28 0:04
CTD 4 5 22 KBLL 2019 4/16/2019 20:48 542806 104050 19 0:01
WS-klein 2 6 22 KBLL 2019 4/16/2019 20:51 542807 104050 19 0:02
CTD 5 7 22 MB3 2019 4/17/2019 5:57 542390 112376 23 0:03
WS-klein 3 7 22 MB3 2019 4/17/2019 6:03 542390 112376 23
Bo/BaBo 150, 300, 500 6 7 22 MB3 2019 4/17/2019 542390 112276 23 0:00
JFT 2 7 22 MB3 2019 4/17/2019 6:38 542355 112618 23
Bo/BaBo 150, 300, 500 7 7 22 MB2 2019 4/17/2019 9:46 541124 112755 24 0:04
WS-klein 4 8 22 MB2 2019 4/17/2019 9:54 541130 112798 24 0:01
CTD 6 8 22 MB2 2019 4/17/2019 10:01 541129 112797 24 0:03
JFT 3 8 22 MB2 2019 4/17/2019 10:30 541105 112781 24 0:30
CTD 7 9 22 MB1 2019 4/17/2019 13:45 541691 114831 25 0:04
Bo/BaBo 150, 300, 500 8 9 22 MB1 2019 4/17/2019 13:53 541692 114832 25 0:04
WS-klein 5 9 22 MB1 2019 4/17/2019 14:02 541699 114843 25
JFT 4 9 22 MB1 2019 4/17/2019 14:22 541731 114910 25 0:30
WP3 1000 2 9 22 MB1 2019 4/17/2019 20:45 544149 114730 25 0:04
Bo/BaBo 150, 300, 500 9 9 22 MB1 2019 4/17/2019 20:54 541497 114735 25 0:03 Bo/BaBo 150, 300, 500 10 10 24 H31 2019 4/17/2019 22:32 542385 120959 21 0:03
CTD 8 10 24 H31 2019 4/17/2019 22:40 542399 120991 22 0:02
CTD 9 12 24 H30 2019 4/18/2019 0:20 543698 121698 20 0:02
Bo/BaBo 150, 300, 500 11 12 24 H30 2019 4/18/2019 0:26 543702 121694 20 0:03 Bo/BaBo 150, 300, 500 12 13 24 H29 2019 4/18/2019 1:29 544326 122901 19 0:02
CTD 10 13 24 H29 2019 4/18/2019 1:35 544337 122910 19 0:02
CTD 11 14 24 H28 2019 4/18/2019 2:26 544998 123694 17 0:02
Bo/BaBo 150, 300, 500 13 14 24 H28 2019 4/18/2019 2:31 545003 123703 17 0:03 Bo/BaBo 150, 300, 500 14 15 24 H27 2019 4/18/2019 3:15 545412 124724 26 0:04
CTD 12 15 24 H27 2019 4/18/2019 3:22 545437 124741 27 0:03
CTD 13 16 24 H23 2019 4/18/2019 4:24 545349 130484 45 0:04
Bo/BaBo 150, 300, 500 15 16 24 H23 2019 4/18/2019 4:30 545353 130495 45 0:06 Bo/BaBo 150, 300, 500 16 17 24 H25 2019 4/18/2019 5:34 544380 130197 23 0:03
CTD 14 17 24 H25 2019 4/18/2019 5:41 544400 130235 24 0:03
WS-klein 6 17 24 H25 2019 4/18/2019 6:06 544418 125739 30 0:01
JFT 5 17 24 H25 2019 4/18/2019 6:23 544570 125836 26 0:30
JFT 6 18 24 H24 2019 4/18/2019 9:20 544697 131225 43 0:35
JFT 7 19 24 H22 2019 4/18/2019 14:05 545600 131624 47 0:30
CTD 15 19 24 H22 2019 4/18/2019 18:52 545754 131499 48 0:04
WS-CTD 2 19 24 H22 2019 4/18/2019 19:07 545707 131507 48 0:13
WP2 100 2 19 24 H22 2019 4/18/2019 19:26 545751 131501 48
WP2 200 4 19 24 H22 2019 4/18/2019 19:36 545750 131501 48
Bo/BaBo 150, 300, 500 17 19 24 H22 2019 4/18/2019 19:46 545760 131502 48 0:07 Bo/BaBo 150, 300, 500 18 19 24 H22 2019 4/18/2019 20:10 545846 131499 48 0:06
CTD 16 20 24 H02 2019 4/18/2019 20:56 550400 131604 45 0:04
WS-klein 7 21 24 H02 2019 4/18/2019 21:03 550401 131605 45 0:02
Bo/BaBo 150, 300, 500 19 21 24 H02 2019 4/18/2019 21:08 550407 131619 44 0:06 Bo/BaBo 150, 300, 500 20 22 24 H04 2019 4/18/2019 22:03 550685 132977 45 0:07
CTD 17 22 24 H04 2019 4/18/2019 22:14 550724 133014 45 0:06
CTD 18 23 24 H05 2019 4/18/2019 23:23 550699 134796 46 0:04
Bo/BaBo 150, 300, 500 21 23 24 H05 2019 4/18/2019 23:30 550707 134800 46 0:07 Bo/BaBo 150, 300, 500 22 24 24 H06 2019 4/19/2019 0:23 550853 140163 46 0:07
CTD 19 24 24 H06 2019 4/19/2019 0:34 550888 140189 46 0:04
CTD 20 25 24 H17 2019 4/19/2019 1:24 550101 140199 49 0:03
Bo/BaBo 150, 300, 500 23 25 24 H17 2019 4/19/2019 1:30 550099 140195 49 0:07 Bo/BaBo 150, 300, 500 24 26 24 H18 2019 4/19/2019 2:28 545626 134759 48 0:07
CTD 21 26 24 H18 2019 4/19/2019 2:39 545644 134703 48 0:03
CTD 22 27 24 H21 2019 4/19/2019 3:37 545648 132999 48 0:03
Bo/BaBo 150, 300, 500 25 27 24 H21 2019 4/19/2019 3:43 545650 132998 48 0:06 Bo/BaBo 150, 300, 500 26 28 24 H20 2019 4/19/2019 4:42 544679 132959 44 0:06
CTD 23 28 24 H20 2019 4/19/2019 4:52 544704 133017 44 0:04
WS-klein 8 29 24 H20 2019 4/19/2019 5:56 544593 132736 43
JFT 8 29 24 H20 2019 4/19/2019 6:20 544640 132907 43 0:30
JFT 9 30 24 H18 2019 4/19/2019 10:27 545548 134856 48 0:30
JFT 10 31 24 H17 2019 4/19/2019 14:39 545922 140004 49
WS-klein 9 31 24 H17 2019 4/19/2019 550101 140199 0:00
Bo/BaBo 150, 300, 500 27 32 24 H16 2019 4/19/2019 19:40 545208 140192 43 0:07
CTD 24 32 24 H16 2019 4/19/2019 19:52 545202 140195 43 0:05
CTD 25 33 24 H15 2019 4/19/2019 20:59 545847 141597 43 0:04
Bo/BaBo 150, 300, 500 28 33 24 H15 2019 4/19/2019 21:05 545852 141602 43 0:06 Bo/BaBo 150, 300, 500 29 34 24 H14 2019 4/19/2019 21:49 550435 142092 47 0:07
CTD 26 34 24 H14 2019 4/19/2019 22:00 550473 142112 47 0:04
CTD 27 35 24 H07 2019 4/19/2019 22:34 550697 141549 49 0:06
Bo/BaBo 150, 300, 500 30 35 24 H07 2019 4/19/2019 22:43 550703 141576 49 0:07 Bo/BaBo 150, 300, 500 31 36 24 H12 2019 4/19/2019 23:29 551083 142430 46 0:06
CTD 28 36 24 H12 2019 4/19/2019 23:39 551117 142429 46 0:04
CTD 29 37 24 H11 2019 4/20/2019 0:14 551501 143002 46 0:04
Bo/BaBo 150, 300, 500 32 37 24 H11 2019 4/20/2019 0:20 551506 143008 46 0:07 Bo/BaBo 150, 300, 500 33 38 24 H10 2019 4/20/2019 1:03 552059 143766 53 0:07
CTD 30 38 24 H10 2019 4/20/2019 1:03 552088 143791 53 0:07
CTD 31 39 25 BB23 2019 4/20/2019 5:59 551750 154498 98 0:09
WS-CTD 3 39 25 BB23 2019 4/20/2019 6:14 551748 154497 98 0:09
WP2 100 3 39 25 BB23 2019 4/20/2019 6:32 551749 154500 98 0:12
WP2 100 4 39 25 BB23 2019 4/20/2019 6:47 551750 154500 98 0:13
WP2 100 5 39 25 BB23 2019 4/20/2019 7:03 551750 154500 98 0:11
WP2 100 6 39 25 BB23 2019 4/20/2019 7:16 551749 154500 98 0:11
Apstein 50 1 39 25 BB23 2019 4/20/2019 7:35 551749 154500 98 0:19
Apstein 50 2 39 25 BB23 2019 4/20/2019 7:56 551749 154500 98 0:19
Apstein 50 3 39 25 BB23 2019 4/20/2019 8:19 551749 154500 98 0:18
WS-CTD 4 39 25 BB23 2019 4/20/2019 8:43 551750 154498 98 0:19
WS-CTD 5 39 25 BB23 2019 4/20/2019 9:32 551749 154498 98 0:11
WP2 200 5 39 25 BB23 2019 4/20/2019 9:50 551749 154506 98 0:12
WP2 200 6 39 25 BB23 2019 4/20/2019 10:11 551751 154501 98 0:11
WP3 1000 3 39 25 BB23 2019 4/20/2019 10:30 551749 154500 98 0:11
Bo/BaBo 150, 300, 500 34 39 25 BB23 2019 4/20/2019 10:48 551756 154484 98 0:15 Bo/BaBo 150, 300, 500 35 39 25 BB23 2019 4/20/2019 11:12 551801 154300 98 0:14 Bo/BaBo 150, 300, 500 36 39 25 BB23 2019 4/20/2019 11:32 551810 154142 98 0:13
MN-maxi 335 1 39 25 BB23 2019 4/20/2019 12:53 551804 154270 98 0:26
MN-midi 50 1 39 25 BB23 2019 4/20/2019 13:49 551747 154498 98 0:11
IKS-80 500 1 40 25 SR49 2019 4/20/2019 19:33 551494 173497 84 0:06
CTD 32 40 25 SR49 2019 4/20/2019 19:43 551493 173502 84 0:06
CTD 33 41 25 SR50 2019 4/20/2019 20:59 551399 175497 64 0:06
IKS-80 500 2 41 25 SR50 2019 4/20/2019 21:07 551401 175498 66 0:05
IKS-80 500 3 41 25 SR50 2019 4/20/2019 21:15 551402 175498 65
IKS-80 500 4 42 26 GD56 2019 4/20/2019 23:05 550899 182504 82
CTD 34 42 26 GD56 2019 4/20/2019 23:11 550897 182502 82 0:06
CTD 35 43 26 GD59a 2019 4/21/2019 0:30 545997 184093 95 0:07
IKS-80 500 5 43 26 GD59a 2019 4/21/2019 0:40 545994 184092 95 0:07
IKS-80 500 6 44 26 GD59 2019 4/21/2019 1:43 545399 185400 90 0:06