Düsternbrooker Weg 20 24105 Kiel
Cruise Report
R.V. ALKOR Cruise No.: AL491
Compiled by: Dr. Jan Dierking Dates of Cruise: 13.04. – 28.04.2017
Areas of Research: Physical, chemical, biological and fishery oceanography Port Calls: Kalmar, Sweden, 21. - 22.04.2017
Institute: GEOMAR, FB3 (Marine Ecology, Evolutionary Ecology of Marine Fishes) Chief Scientist: Dr. Jan Dierking
Number of Scientists: 10 (plus 1 journalist and 1 observer) Projects: EU BONUS BIO-C3
Cruise Report
This cruise report consists of 10 pages including the cover page:
1. Scientific crew………... 2
2. Research program………...…. 3
3. Narrative of cruise with technical details………. 4
4. Scientific report and first results……… 6
4.1 Ichthyo- and zooplankton sampling……… 6
4.2 Fishery……….……… 7
4.3 Hydrography ………...……… 8
4.4 Protist communities……… ……… 9
5. Scientific equipment ………..………..….. ………9
6. Acknowledgements……….. 10 7. Appendix E1: Excel file “Appendix_E1_AL491_station_list.xlsx”
doi:10.3289/CR_AL491
1. Scientific crew
Name Function Institute Leg
Jan Dierking Chief scientist GEOMAR Entire cruise
Svend Mees Technician GEOMAR Entire cruise
Melanie Heckwolf PhD student GEOMAR Entire cruise
Serra Orey MSc student GEOMAR Entire cruise
Jakob Gismann MSc student GEOMAR Entire cruise
Christian Pawlitzki BSc student CAU Entire cruise
Robert Priester BSc student CAU Entire cruise
Maik Jansohn BSc student CAU Entire cruise
Gesine Ramm Intern --- Entire cruise
Marek Sikora Observer OIRM Gdynia, Polen Entire cruise Steffen Kühner PhD student Uni Kaiserslautern Kiel – Kalmar
Alica Ohnesorge MSc student GEOMAR Kiel – Kalmar
Cornelia Jaspers Scientist GEOMAR Kalmar – Kiel
Pia Heinemann Journalist --- Kalmar – Kiel
Total per leg 12/12
Chief scientist:
Dr. Jan Dierking, GEOMAR Helmholtz Centre for Ocean Research Düsternbrooker Weg 20, 24105 Kiel
Phone: 0431 600 4580 Fax: 0431 600 4553 E-Mail: jdierking@geomar.de
3
2. Research program
This multidisciplinary cruise extended a long-term data series on (eco-)system composition and functioning of the Baltic Sea, with a focus on the deeper basins, collected since 1986 by the GEOMAR Helmholtz Centre for Ocean Research and its predecessors IFM-GEOMAR Kiel and IFM Kiel. The key characteristic of this series is the integration of oceanographic and biological information to enhance understanding of environmental and (fish) population fluctuations, and evolutionary processes in this system, in the context of climate change and anthropogenic stressors. The resulting datasets and samples are essential for a number of ongoing projects, including the large-scale international project BONUS BIO-C3 coordinated by GEOMAR. The spatial focus lies on the Bornholm Basin (the most important spawning area of Baltic cod), but also includes the Western Baltic Sea, Arkona and Gotland Basin and Gdansk Deep (Figure 1), thus covering ICES subdivisions 22, 24, 25, 26 and 28 (Figure 2).
Figure 1 Cruise track of AL491. All realized sample stations are depicted by red dots.
Figure 2 ICES subdivisions in the Baltic Sea area (Source: ICES). ICES SD22 corresponds to Kiel Bight = KB, SD24 to Arkona Basin = AB, SD25 to Bornholm Basin = BB and Stolpe Trench = SR, SD26 to Gdansk Deep = GD and Southern Gotland Basin (GB).
Specific investigations included a detailed hydrographic survey (oxygen, salinity,
temperature, light intensity) (Figure 3), plankton surveys (zoo- and ichthyoplankton, with the goal to determine the composition, abundance, vertical and horizontal distribution, and nutritional status of species, and to address questions regarding plankton phenology) (Figure 3), regular water sampler hauls for a study of protist community composition across the salinity gradient of the Baltic Sea (Figure 4), and pelagic fishery hauls (Figure 5). The latter served to determine size distributions, maturity status, and length – weight relationships of the three dominant fish species in the pelagic system of the Baltic, cod (Gadus morhua), herring (Clupea harengus) and sprat (Sprattus sprattus), as well as the flatfish flounder (Plathichthys flesus). Secondly, various different samples were obtained for more detailed analyses,
including gonad samples of cod, stomachs of cod, herring and sprat stomachs and whole samples for dietary analyses, otoliths of cod for aging, and tissue samples of cod, flounder, whiting, plaice and other species for genetic analyses and stable isotope analysis. In addition, along the cruise track, hydroacoustic (echosounder) data were collected continuously for later analysis of fish abundance and distribution.
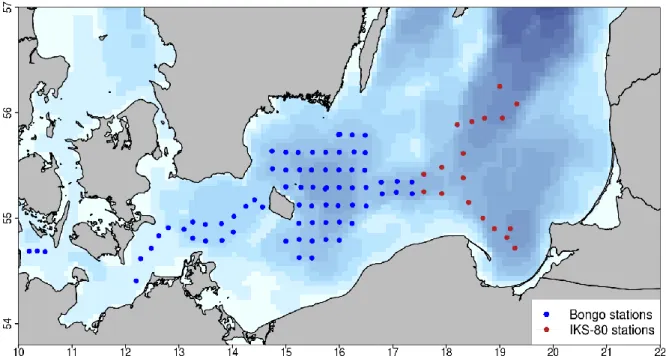
Figure 3 Plankton sampling and hydrographic measurement stations covered by AL491. Blue dots: Bongo net hauls + CTD; red dots: IKS-80 net hauls + CTD.
3. Narrative of cruise with technical details
RV ALKOR departed from GEOMAR pier on April 13 2017 at 08:40 am (all times board time) and headed to the first research area in the Kiel Bight (SD22). Over the course of the cruise, pelagic fishery hauls, zooplankton hauls with Bongo/IKS-80 nets, Multinet MIDI, water sampler, and CTD hauls were then carried following a large-scale spatial sampling design covering Kiel Bight (SD22) on April 13, Arkona Basin (SD24) on April 14-15 and 27, Bornholm Basin (SD25) on April 16-20 and 25-26, Stolpe Trench (SD25) on April 18, Gotland Basin (SD28, SD26) on April 23 and Gdansk Deep (SD26) on April 24 (Figure 3, 5).
In addition, hydroacoustic data obtained with four different echosounder frequencies (38, 70, 120 and 200 kHz) were continuously recorded. The scientific work was interrupted by a harbor stay in Kalmar, Sweden on April 21-22 to disembark two scientists and embark two replacements.
In addition to the program above, the central deep station BB23 in Bornholm Basin
5
was intensively sampled on two occasions, early in the cruise on April 16 12:25-16:40 (including CTD casts, zooplankton sampling with Bongo, Apstein and WP-2 nets, oxygen measurements of water samples obtained with the rosette water sampler using the Winkler method, phytoplankton sampling using the same water samples) and late in the cruise on April 25 08:04 – April 26 09:51 (same sampling as on April 19, followed by a detailed vertically and temporally resolved sampling of plankton communities by four towed Multinet MAXI and four vertical Multinet MIDI hauls over a 24 hour period, covering the water column in 5 m and 10 m depth layers, respectively).
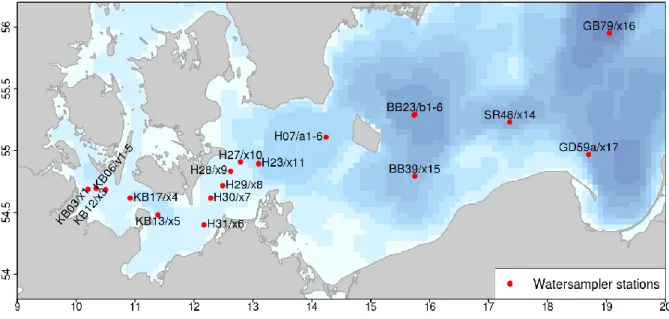
Moreover, protist communities were sampled in 20 water sampler hauls, and
conserved on board for a study of community changes across the salinity gradient covered by the cruise (Figure 4).
Figure 4 Water sampler stations covered by AL491.
Figure 5 Pelagic fishery trawl stations covered by AL491.
Additional detail on gear deployments (Table 1), the station list (Appendix E1), and an overview of first scientific results are provided below.
Table 1 Overview of gear deployment. Mesh sizes are given in brackets. For location designations (combination of ICES SD and abbreviated name), see Figure 2.
Gear
22- KB
24- AB
25- BB
25- SR
26- GD
26-
GB Total
ADM-CTD vertical 5 17 46 10 7 7 92
Watersampler + CTD 5 7 5 1 1 1 20
Hydroacoustic transect (continuous) 1
Bongo, Babybongo (150μ, 335μ, 500μ) 3 17 46 6 1 73
IKS-80 plankton net (500μ) 4 7 7 18
Multinet MAXI horizontal (335μ) 9
9
Multinet MIDI vertical (50μ) 8
8
Apstein (55μ) plankton hauls 6 6
WP-2 (100μ) 1 7 8
Pelagic fishery trawl 4 6 11 4 4 29
Total 18 48 138 21 19 19 264
4. Scientific report and first results
Cruise AL491 accomplished all objectives of the original work program, and thus extended the integrative Baltic long-term data series that directly contributed to the BONUS BIO-C3 project. Specific work lines are described in the following.
4.1 Ichthyo– and zooplankton sampling
Bongo- and Babybongo hauls covered Kiel Bight (3 hauls), Arkona Basin (17 hauls), and Bornholm Basin including the western part of Stolpe Trench (52 hauls) (Figure 3, Table 1).
Larvae of cod (Gadus morhua; n = 2 in total), sprat (Sprattus sprattus; n = 818), flounder (Plathichthys flesus; n = 371), sculpin (Myoxocephalus scorpius, n = 4) and common seasnail (Liparis liparis; n = 39) were picked from the 500 μm bongo-samples and conserved at -80 °C for subsequent RNA/DNA and genetic analyses. All of the 500 μm Bongo samples were also checked for the presence of gelatinous zooplankton. The jellyfish species Aurelia aurita, Cyanea capillata, Obelia spp. and the invasive combjelly Mnemiopsis leidyi were present regularly. Following these initial on board steps, all Bongo samples were conserved in formol, and will be used for the determination of species composition and abundance of zooplankton and ichthyoplankton.
Stations in the eastern part of Stolpe trench and the Gdansk Deep and Southern Gotland Basin were covered with IKS-80 instead of Bongo hauls (Figure 3) to ensure
compatibility of data with a long-term IKS-80 sampling series maintained by the Latvian Fish Resources Agency (LATFRA; Andrei Makarcuks).
Repeated Multinet MAXI (335μ, towed, sampling of the water column in 5 m layers) and MIDI (50μ, vertical, sampling of the water column in 10 m layers) casts were done over a 24 hour period on April 25-26 on the central deep Bornholm Basin station BB23 to reveal the
7
vertical distribution of ichthyo- and zooplankton. In addition, WP-2 (100 μm) and Apstein (55 μm) nets and the rosette water sampler were deployed to obtain additional samples, including nano/micro phytoplankton samples in the context of plankton phenology work within the BONUS BIO-C3 project (Dr. Jörg Dutz, IOW) and the determination of vertical oxygen profiles using Winkler titration.
4.2 Fishery
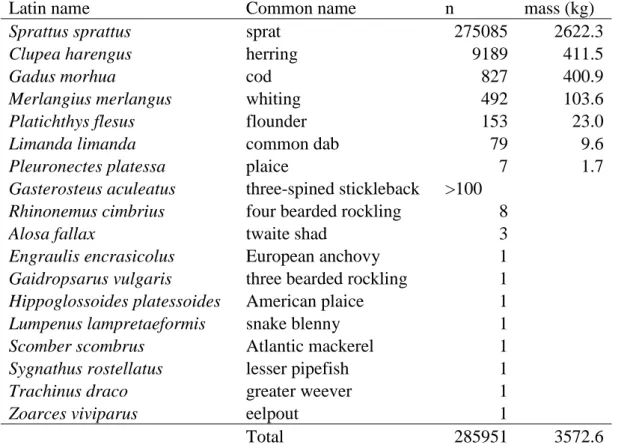
Pelagic fishery was conducted in the Kiel Bight (2 hauls), Arkona Basin (6 hauls), Bornholm Basin (11 hauls), Gotland Basin (4 hauls) and Gdansk Deep (4 hauls) (Figure 5). In parallel to the fishery hauls, hydroacoustic measurements of fish distribution patterns were recorded continuously. The overall catch composition is shown in Table 4.2.1.
Table 4.2.1 Fish catch composition AL491. For cod, the number of individuals for which single fish measurement and samples were taken was 659, for whiting 188.
Latin name Common name n mass (kg)
Sprattus sprattus sprat 275085 2622.3
Clupea harengus herring 9189 411.5
Gadus morhua cod 827 400.9
Merlangius merlangus whiting 492 103.6
Platichthys flesus flounder 153 23.0
Limanda limanda common dab 79 9.6
Pleuronectes platessa plaice 7 1.7
Gasterosteus aculeatus three-spined stickleback >100 Rhinonemus cimbrius four bearded rockling 8
Alosa fallax twaite shad 3
Engraulis encrasicolus European anchovy 1 Gaidropsarus vulgaris three bearded rockling 1 Hippoglossoides platessoides American plaice 1
Lumpenus lampretaeformis snake blenny 1
Scomber scombrus Atlantic mackerel 1
Sygnathus rostellatus lesser pipefish 1
Trachinus draco greater weever 1
Zoarces viviparus eelpout 1
Total 285951 3572.6
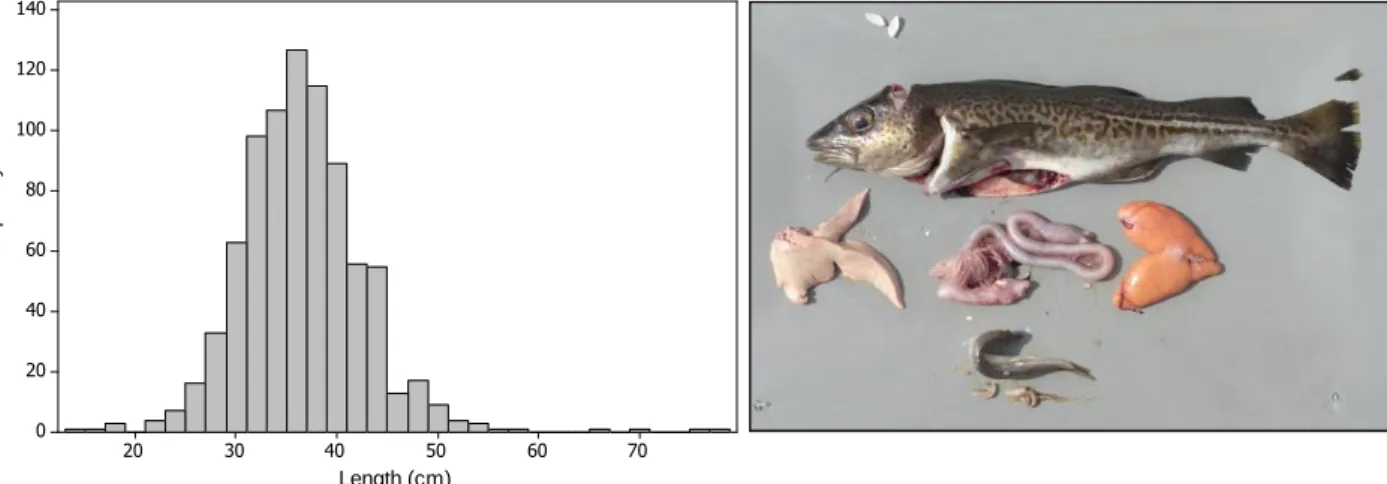
For each haul and the entire catch, catch weight and length frequencies of all species (illustrated in Figure 4.2.1 for cod) were taken. Stomach samples were taken from sprat (10 per 1 cm length class) and herring (10 per 2 cm length class). For cod, single fish data (length, weight, sex and maturity stage) and samples (otoliths, fin clips for genetic analysis, stomachs and gonads) were obtained for 659 individuals (see Figure 4.2.2 for illustration), whereas length and weight were measured for the remaining 168 individuals. All length and weight data together suggests that the caught individuals are representing foremost the lower third of the possible size spectrum in the Baltic Sea.
Length (cm)
Frequency
70 60 50
40 30 20
120 100 80 60 40 20 0
4.3 Hydrography
CTD profiles from 112 stations were obtained with the ADM-CTD and the HYDROBIOS water sampler with attached CTD. Conditions varied depending on the basin and location of the Baltic sampled, and will be analyzed in depth in context of our long-term data series on hydrographic conditions.
Oxygen concentrations at the bottom in the Bornholm Basin were found to be somewhat reduced to the concentration measured in spring 2016. This year, 2017, (< 2 ml/l) hypoxic to anoxic (0 ml/l) conditions prevailed at the bottom of stations with water depths >81m (see Figure 4.3.1). We assume that Major Baltic Inflow event in winter of 2014/15 and the smaller inflow in winter 2015/16 increased the salinity and oxygen conditions below the halocline in the Bornholm Basin substantially, but that oxygen is declining after the absence of an inflow
Figure 4.2.1 Relative length frequency distribution of individual sampled cod during AL491 (n = 827).
Figure 4.2.2 Samples (otoliths, fin clips, stomach contents, gonads) and measures (total length, weight, gutted weight, liver and gonad weight) taken from 659 out of 827 cod individuals during the cruise (illustrated here for a 38 cm female, maturity stage IV, with full stomach, from Bornholm Basin). Photo: Nickel
Figure 4.3.1 CTD profile of station BB23 in the central Bornholm Basin observed on April 16 2017.
9
in winter 2016/2017. This underscores that isolated Major Baltic Inflow event like the one observed for the winter 2014/15 will not change the course of spreading hypoxia and anoxia in the Baltic Sea, i.e., only an overall shift back to more regular inflows would be able to do so. Moreover, other factors like eutrophication and warming are contributing to the spread of anoxic areas.
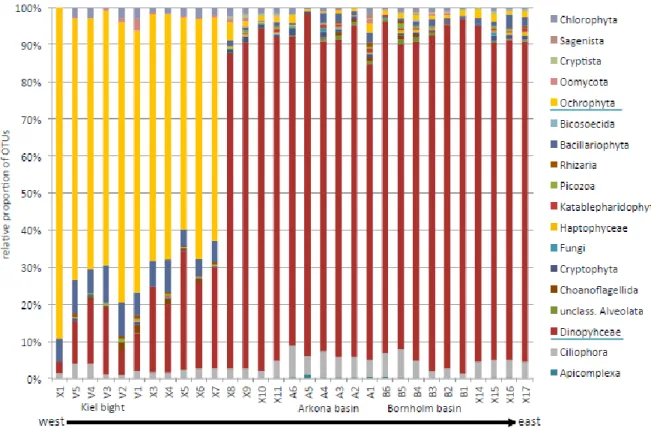
4.4 Protist communities along the salinity gradient of the Baltic Sea (collaboration with Profs. Thorsten Stoeck and Sabine Filker, University of Kaiserslautern, Germany) In this pilot study, protest communities along the salinity gradient covered by the cruise were assessed, based on filtered water samples (Figure 4). The data analysis is currently ongoing, but one clear finding is a major shift in community composition of protists at salinities of around 8-10 (sites x7 and 8 in Figure 4.4.1).
5. Scientific equipment: instruments and gear
Hydrography:
- ADM-CTD with additional O2 sensor
- Hydrobios Water Sampler with CTD and O2 sensor Zooplankton:
- Baby Bongo-Net (150 μm) - Bongo net (335 μm)
Figure 4.4.1 Taxonomic distribution of microeukaryotic phyla detected in the samples (ordered from west to east, and correspondingly, high to low salinities, on the x-axis). Salinities at sites x7 to x8 change from ca. 10-11 to 8-9. Dominant taxon groups are underlined.
- Bongo net (500 μm) - WP-2 net(100 μm) - Apstein net (55 μm) Ichthyoplankton:
- Bongo net (335 μm and 500 μm)
- Hydrobios Multinet MAXI (335 μm horizontal hauls) - Hydrobios Multinet MIDI (50 μm vertical hauls) - IKS-80 (500 μm)
Fish:
- Jungfisch Trawl (pelagic trawl net (0.5 cm mesh size) Hydroacoustics:
- 38, 70, 120 and 200 kHz-echosounder EK60
6. Acknowledgements
Thanks to Captain von Staa and the entire crew of RV ALKOR for their outstanding support throughout the cruise! I also want to thank Burkhard von Dewitz, chief scientist of the subsequent cruise AL493, for the great collaboration on cruise preparations and follow-up work for the Baltic integrative long-term data series cruises in 2017 as well as past years, and to Svend Mees for his support in all technical matters for the cruise. Finally, thank you to the scientific personal and student assistants on AL491 for their enthusiasm and motivation, and to Pia Heinemann for the willingness to participate in all scientific work on board and for the insightful newspaper article on the value of long-term data and our cruise series.
This cruise contributed to the EU BONUS BIO-C3 project and was supported by BONUS (Art 185), funded jointly by the EU and the German BMBF under grant No.
03F0682.
7. Appendix E1: Station list of AL491
Supplied with the report in electronic form as Excel table,
“Appendix_E1_AL491_station_list.xlsx”