1
Geophysical Research LettersSupporting Information for
Improving Climate Model Simulation of Tropical Atlantic Sea Surface
Temperature: The Importance of Enhanced Vertical Atmosphere Model Resolution Jan Harlaß1, Mojib Latif1,2 and Wonsun Park1
1
GEOMAR Helmholtz Centre for Ocean Research Kiel, Kiel, Germany
2
Kiel University, Kiel, Germany
Contents of this file
Table S1Figures S1 to S4
Introduction
This supporting information provides Table S1 and Figure S1 to S4, described and discussed in the result section.
2
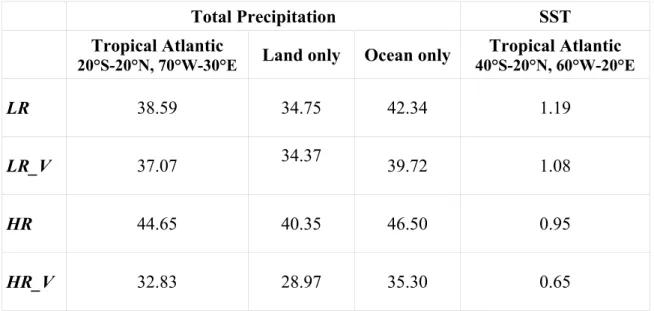
Total Precipitation SST
Tropical Atlantic
20°S-20°N, 70°W-30°E
Land only Ocean only Tropical Atlantic
40°S-20°N, 60°W-20°ELR 38.59 34.75 42.34 1.19
LR_V 37.07 34.37 39.72 1.08
HR 44.65 40.35 46.50 0.95
HR_V 32.83 28.97 35.30 0.65
Table S1. Mean absolute error (MAE) in JAS for total precipitation (mm/month) and sea surface temperature (SST, °C). MAE for total precipitation is calculated over 20°S - 20°N, 70°W - 30°E. LR (T42, L31), LR_V (T42, L62), HR (T159, L31), HR_V (T159, L62).
3
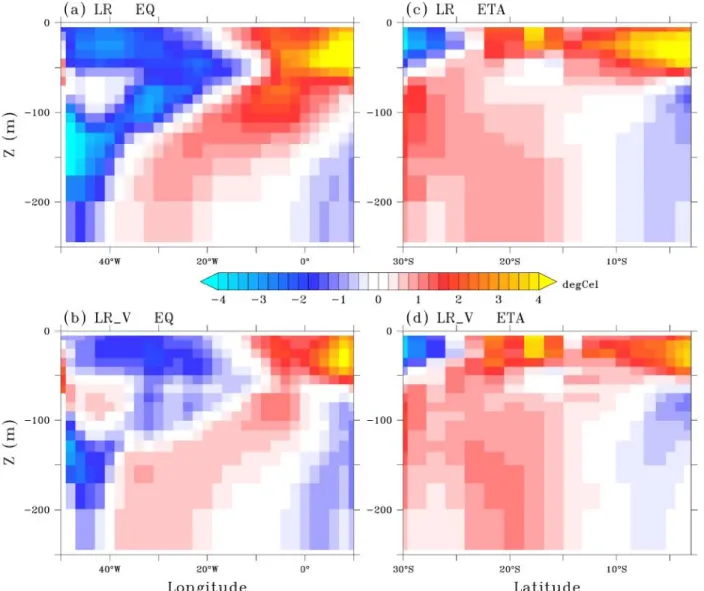
Figure S1. Subsurface temperature bias (°C) in the upper 250m with respect to Levitus 1998 in JAS for the equatorial region (EQ, 3°S - 3°N, left panel) and the Eastern Tropical Atlantic (ETA, 10°E - 20°E , right panel). (a,c) LR (T42, L31) (b,d) LR_V (T42, L62).
4
Figure S2. Sea surface temperature (SST, in °C) anomalies along the equator (3°S-3°N) as a function of calendar month. Black contour lines denote observed SST (HadISST).(a) LR (T42, L31), (b) LR_V (T42, L62), (c) HR (T159, L31), (d) HR_V (T159, L62).
5
Figure S3. Standard deviation of SST anomalies in the ATL3 (3°S - 3°N, 20°W - 0°E) region as function of the calendar month in the four different coupled model simulations with the KCM. Black line denotes observed SST (HadISST), blue: LR (T42, L31), red:LR_V (T42, L62), green: HR (T159, L31) and purple: HR_V (T159, L62).