Appendix A. Supplementary data
Long-term records of hard-bottom communities in the southwestern Baltic Sea reveal the decline of a foundation species
Markus Franz
a,*, Francisco Rafael Barboza
a, Hans-Harald Hinrichsen
a, Andreas Lehmann
a, Marco Scotti
a, Claas Hiebenthal
a, Markus Molis
b, Renate Schütt
a, Martin Wahl
aa
GEOMAR Helmholtz Centre for Ocean Research Kiel
b
Alfred-Wegener Institute, Helmholtz Centre for Polar and Marine Research, Bremerhaven, Bremen, Germany
*
Corresponding author: Research division of Marine Ecology, GEOMAR Helmholtz Centre for Ocean Research Kiel, Düsternbrooker Weg 20, 24105 Kiel, Germany, email address: mfranz@geomar.de
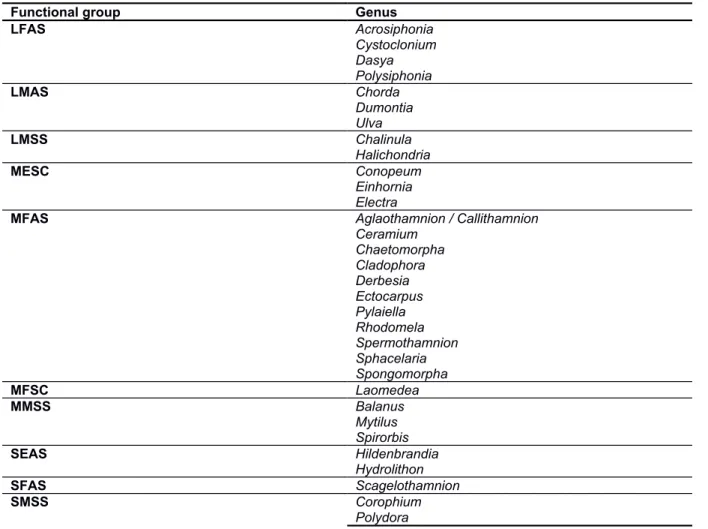
Table S1. Classification of genera recorded into functional groups.
Functional group Genus
LFAS Acrosiphonia
Cystoclonium Dasya Polysiphonia
LMAS Chorda
Dumontia Ulva
LMSS Chalinula
Halichondria
MESC Conopeum
Einhornia Electra
MFAS Aglaothamnion / Callithamnion
Ceramium Chaetomorpha Cladophora Derbesia Ectocarpus Pylaiella Rhodomela Spermothamnion Sphacelaria Spongomorpha
MFSC Laomedea
MMSS Balanus
Mytilus Spirorbis
SEAS Hildenbrandia
Hydrolithon
SFAS Scagelothamnion
SMSS Corophium
Polydora
Table S2. Modelling results of Generalized Linear Mixed Model (GLMM) comparing Mytilus coverage in the years before (2005-2009) and after (2010-2015) the decline and between stations of Kiel (1 - 4) and Lübeck (5 - 7) bights. The GLMM was specified based on a gamma-distribution and log-link function. To adjust the within station variability, the station identity was included as random factor.
Model component Estimate Std. error t-value p-value
Intercept 3.304 0.211 15.645 < 0.001
After -1.359 0.286 -4.752 < 0.001
Lübeck Bight 0.703 0.323 2.179 0.029
After:Lübeck Bight 1.311 0.437 3.002 0.003
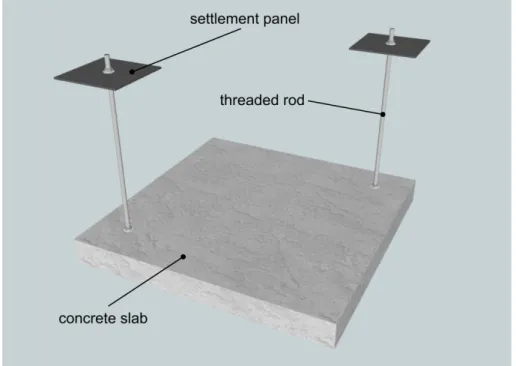
Figure S1. Outline of the deployed settlement panel system.
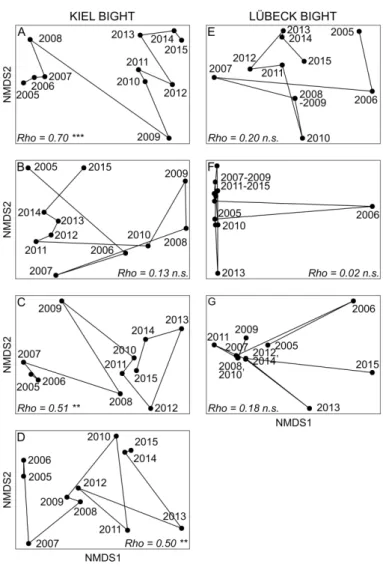
Figure S2. nMDS trajectories based on Bray-Curtis dissimilarities between consecutive years for the functional composition of the communities at the respective monitoring stations. For all plots stress was ≤ 0.08. Correlation coefficient (Rho) and significance levels (*** p < 0.001; ** p < 0.01; * p < 0.05; n.s. = not significant) of the RELATE analysis are given. Charts are ordered from station 1 (A) to 7 (G).
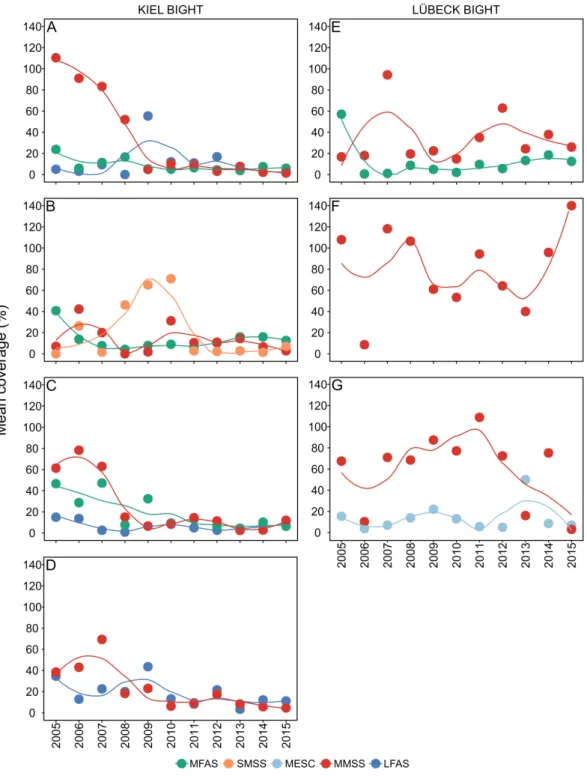
Figure S3. Mean coverage (%) of functional groups (see codes for functional groups in Table 1) that were identified with SIMPER analysis. These groups reach a cumulative contribution in similarity of 75% over the monitoring period 2005-2015. Curves from LOESS smooth functions (span = 0.6) are visualized to highlight temporal dynamics. The panels present results from station 1(A) to station 7 (G).
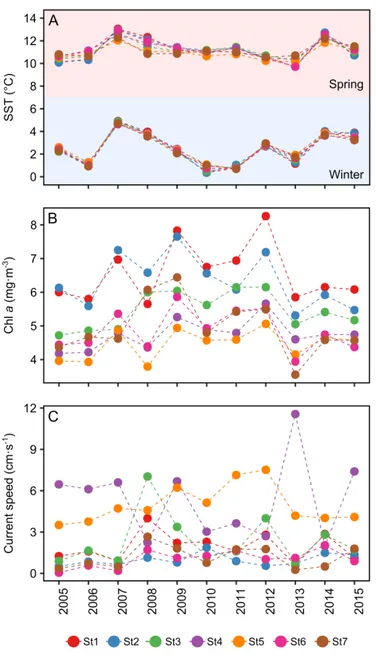
Figure S4. Temporal trends of environmental variables over the entire monitoring period (2005-2015). Mean values of sea surface temperature in spring and winter (SST; A), chlorophyll a concentration (Chl a; B) and current speed (C) in spring are presented. Note that only values recorded for spring were included in the Generalized Additive Mixed Model (GAMM).