Eur J Clin Chem Clin Biochem 1995; 33:343-349
© 1995 Walter de Gruyter & Co.
Berlin · New York
An Improved Method for Determination of Thiocyanate in Plasma and Urine
1)
By Per Lundquist1*2, Bertil K gedal1 and Lennart Nilsson1
1 Department of Clinical Chemistry, University Hospital, Link ping, Sweden
2 SKL — National Laboratory of Forensic Sciences, Link ping, Sweden
(Received September 20, 1994/March 20, 1995)
Summary: An improved spectrophotometric method is described for the determination of thiocyanate in plasma and urine. Thiocyanate is adsorbed on a weak anion-exchange resin with strong affinity for chaotropic ions, and eluted with perchlorate. Thiocyanate is then chlorinated by hypochlorite and quantified according to the K nig (J Prakt Chem 1904; 69:105-37) reaction by use of isonicotinic acid and 1,3-dimethyl-barbituric acid. The method affords a simple, rapid and sensitive assay for thiocyanate and has a detection limit of 0.93 μηιοΐ/ΐ. At thiocyanate concentrations of 107.1 and 167.4 μιηοΐ/ΐ in plasma and urine the within-day CVs were 0.69% and 1.1% respec- tively, and the total imprecision measured for a period of 65 days was 0.98%. Analytical recoveries were quantitative both with urine and plasma samples.
Introduction
Natural exposure of cyanide during evolution has re- sulted in complex mechanisms for its detoxication in man. In the major pathway, cyanide is metabolized to thiocyanate after reacting with a sulfur donor, such as thiosulfate. This reaction is catalyzed by the enzyme rhodanase (EC 2.8.1.1)2). Determination of thiocyanate in serum and urine is therefore of great interest in moni- toring cyanide exposure from tobacco smoke (1), fire smoke (2) and from ingested cyanogenic glucosides (3).
Intake of thiocyanogenic glucosides (glucosinolates) present in cabbage and vegetables of the Brassica family and mustard (4), and intake of thiocyanate-containing food such as milk and cheese elevate the thiocyanate concentration in body fluids.
!) Funding organisations:
The Swedish Medical Research Council (Project No. B95-13X- 11211-01A),
The Swedish Tobacco Company (Svenska Tobaks AB), Project No. 9414,
The Swedish Cancer Society (Project 2357-B94-09XCC), The Swedish Society of Medicine,
The County Council of sterg tland and The Lions Foundation for Medical Research
2) Enzyme:
Rhodanase (thiosulfate sulfurtransferase) (EC 2.8.1.1)
Thiocyanate present in blood is partly bound to plasma albumin (5). When plasma concentration of thiocyanate exceed 250 μιποΐ/ΐ, thiocyanate is excreted into the urine as the reabsorption in the tubules becomes saturated (6, 7). The estimated plasma elimination half-life of thiocy- anate is 2.7 days in healthy subjects (8).
Several methods for determination of thiocyanate have been described based on the colorimetric method devel- oped by K nig in 1904 (9). These methods constitute multi-step reactions where thiocyanate is first haloge- nated to cyanogen chloride or cyanogen bromide. In the K nig method (9) the cyanogen halide then reacts with pyridine yielding glutaconic aldehyde, and this com- pound then reacts with a primary amine producing a dye which is quantified spectrophotometrically. After the first description of the method several modifications have appeared (10—26), but unfortunately all of them involve handling of unpleasant or toxic compounds, e. g.
bromine, arsenite, benzidine, pyridine and l-phenyl-3- methyl-5-pyrazolone.
Isonicotinic acid is unnoxious and releases no unpleas- ant vapour. This reagent was first used in the K nig reac- tion by Ishii et al. (21) in a modification where pyrazo- lone dissolved in dimethylformamide-water was used in-
344 Lundquist et al.: Determination of thiocyanate in plasma and urine
stead of barbituric acid. Nagashima (23) used sodium isonicotinate together with barbiturate and obtained a stable reagent. Earlier 1,3-dimethylbarbituric acid was used in combination with pyridine (24), and recently the combined use of isonicotinic acid and 1,3-dimethylbar- bituric acid was introduced for determination of cyanide and thiocyanate in water by Meeussen et al. (26). This combination was also utilized for analysis of cyanogens in cassava (25). Although this is an attractive reagent combination, it has not earlier been used for analysis of thiocyanate in plasma and urine.
The aim of the present investigation was therefore to optimize the K nig reaction for analysis of thiocyanate in plasma and urine with isonicotinic acid and 1,3-di- methylbarbituric acid as substitutes for pyridine and bar- bituric acid. The reaction mechanism is shown in figure
cr
1. The clean-up and chlorinating of the purified sample with sodium hypochlorite is an updated modification of our earlier method.
Materials and Methods
Materials · f
Ion exchanger
Amberlyst A-21, 20—50 mesh was purchased from Sigma Chemi- cal Co. (St. Louis, MO). The resin was dried in an oven at
^ 100 °C for 24 hours and thereafter ground in a laboratory mill (Cemotec 1090 Sample Mill, Tecator AB, H gan s, Sweden). A particle size of 0.1 -0.3 mm was obtained by sieving the dry resin.
Then the resin was slurried into 2 volumes of de-ionized water and allowed to sediment for 5-10 minutes. The supernatant containing fine particles was decanted to ensure an optimal column flow rate, and the procedure was repeated 3-4 times. The resin was transfer- red to a suitable column, washed with 3 volumes of hydrochloric acid, 1 mol/1, followed by de-ionized water to neutral pH (pH-indi- cator paper). Then the resin was washed with 10 volumes of so- dium hydroxide, 1 mol/1, followed by de-ionized water to neutral pH. The resin could be stored for at least one year at + 4 °C. For preparing 1-ml columns of the resin, 0.7 (i.d.) X 2.5 cm, we used the "Econo-Columns", 0.7 (i.d.), X 4.0 cm, from Bio-Rad Laboratories. Alternatively, the cheaper Poly-Prep Columns, 0.8 X 4.0 cm (Bio-Rad Labs.) could be used.
+ 2H20
O COOH O -l
H-C-CH2-C=CH-C-H + H2CN2
3-Carboxygluiaconic aldehyde
CH3
r Ο COOH Ο II I II H-C-CH2-C=CH-C-H
Ο CH2
N-C CH 0 1,3-Dimethylbarbituric acid
CH3V P O CH3
Λ ?°ΟΗ /CX C=CH-CH2-C=CH-CH=c' VC=O
^ v V NW W
O CH3
Q=C CH3'
2H,O CH,
Ιί
O=C OH
«* ?*" x- . C-CH=CH-C=CH-CH=C C=0 I-C' C-N
>N ^ S O O CH,
1,5-Bis(pyrimidene-1 >,31-dimethyl-2',4',6'-lrione-5'-ylidenc)-3-carboxy-2-pentene
Fig.l
nide Reaction scheme for determination of thiocyanate and cya- After cyanogen chloride has been formed from the reaction be- tween thiocyanate and hypochlorite it reacts with isonicotinic acid to produce 3-carboxyglutaconic aldehyde (intermediate). Conden- sation of the aldehyde with two molecules of 1,3-dimethylbarbi- turic acid finally gives the dye.
Reagents
All reagents were prepared from analytical grade chemicals (unless otherwise specified) and were dissolved in de-ionized water.
Potassium thiocyanate and sodium perchlorate monohydrate were obtained from E. Merck (Darmstadt, Germany). Isonicotinic acid (purum) and 1,3-dimethylbarbituric acid (puriss) were obtained from Fluka Chemie AG, (Buchs, Switzerland). Sodium hypochlo- rite, 0.5 mol/1 dissolved in NaOH 0.1 mol/1 (reagent no. 23039) was obtained from BDH Chemicals (Poole, England) and was di- luted 10-fold to a final concentration of 50 mmol/1. This reagent is stable for at least one month at + 4 °C.
Potassium thiocyanate working standards, 20, 50, 100, 200, and 300 μηιοΐ/ΐ, were prepared daily from a 100.0 mmol/1 stock stan- dard solution. The colour reagent was prepared by dissolving 0.925 g of NaOH in 50 ml water. Then 1.75 g 1,3-dimethylbarbir turic acid and 1.43 g isonicotinic acid were added to the alkaline solution. This reagent is stable for at least 4 months at + 4 °C. As a blank we used de-ionized water.
Apparatus
During the optimization of the method we used a Shimadzu Model UV-2101 PC UV-VIS Scanning spectre-photometer (Shimadzu Cor- poration, Analytical Instruments, Kyoto, Japan). Otherwise, we used a Zeiss PM 2K spectrophotometer.
Procedure
A 0.5-ml aliquot of blank, working standards, plasma or urine was diluted with 5.0 ml of NaOH, 1.0 niol/1, and applied to a 2.5 X 0.7 cm column of Amberlyst A-21. The column was washed three times with 5-ml portions of water, and then thiocyanate was eluted by 8.0 ml of NaClO4, 1 mol/1. To a 4.0-ml aliquot of the eluate we added 0.2 ml of acetic acid, 0.35 mol/1, and mixed on a Vortex mixer. The chlorinating reaction was then performed by adding 0.1 ml ofo sodium hypochlorite, 50 mmol/1, and the sample was again mixed. Then within 2 min, 0.6 ml of the colour reagent was added.
After 10 min the absorbance was read at 607 nm and the amount
of thiocyanate was calculated from a calibration graph. within 10 min after the addition of the colour reagent (fig. 4). Then the colour slowly decreased with time.
Plasma and urine specimens
Venous blood samples from 15 healthy non-smokers and 5 smokers were drawn into 5 ml Vacutainer tubes containing sodium heparin (Becton Dickinson, Rutherford, NJ). Plasma was separated by cen- trifugation at 2500 £ for 10 minutes and stored at —20 °C until analysis. Untimed urinary samples were obtained from 15 healthy non-smokers and 5 smokers. Thiocyanate in plasma and urine sam- ples are stable for at least six months when stored at -20 °C (18).
Results
Clean-up of plasma and urine
In the earlier method (18) urine and plasma samples were diluted with sodium hydroxide, 0.1 mol/1, for dissociation of thiocyanate from albumin (28). With this procedure we occasionally found recoveries of added thiocyanate as low as 83%. With a stronger alkaline so- lution, 1.0 mol/1, we now obtained quantitative recover- ies both with urine and plasma samples.
0.7 0.6 0.5
<Dο
< 0.3- 0.2 0.1
0.0 10
PH
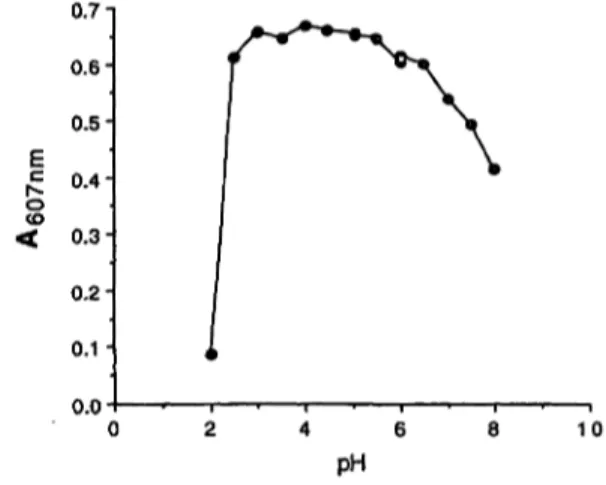
Fig. 2 Effect of pH on the formation of the dye
Tubes containing 4 ml sodium perchlorate, 1.0 mol/1, 0.125 ml ace- tic acid/acetate buffer, 1.0 mol/1 (pH 2-5), citrate/phosphate buffer, 1.0 mol/1 pH 5-6), or phosphate buffer, 1.0 mol/1 (pH 6-8) and 0.25 ml of potassium thiocyanate, 100 μηιοΐ/ΐ, were added, pH was confirmed on a pH-meter. Colour development was performed as described.
Chlorination
Sodium hypochlorite in water solution is in a dynamic equilibrium with chlorine as follows:
cio- + cr + H
2o +-* c\
2+ 2 OH-
The chlorine then reacts with thiocyanate:
4 C12 + SCN" + 4 H2O -> CNC1 + 8 H+
+ 7 cr +
It is advantageous if both the chlorinating reaction, the formation of glutaconic aldehyde derivative, and the col- our development can be performed at the same pH and in sequence.
The chlorination of thiocyanate was therefore investi- gated together with isonicotinic acid arid 1,3-dimethyl- barbituric acid as colour reagents. The pH optimum of the reaction was broad (fig. 2), and the addition of 0.2 ml of 0.35 mol/1 acetic acid to a 4.0-ml effluent gave a pH of 4.0. At this pH the reaction between thiocyanate and hypochlorite was practically instantaneous and the absorbance was constant within the tested range of 10- 120 seconds.
Amount of colour reagent
When we varied the volume of colour reagent in the assay from 0.1 to 1.0 ml the absorbance increased up to the addition of 0.9 ml reagent (fig. 3), but only a slight increase in absorbance was observed after addition of 0.5 ml reagent. Maximum absorbance was obtained
1.2 1.0 0.8
°·
60.4 0.2
0.00.0 0.2 0.4 0.6 0.8
Volume [ml]
1.0 1.2
Fig. 3 Effect of amount of colour reagent on dye development Procedure as described in methods with exception of added water to a constant volume of 1.0 ml for the colour reagent. 50 nmol thiocyanate was added to assay.
1.4
1.2 1.0-
0.8- 0.6 0.4- 0.2-
0.00 5 1 0
Time [min]
Fig. 4 Effect of time on colour development
15
346 Lundquist et al.: Determination of thiocyanate in plasma and urine
The absorption maximum of the dye formed in sodium defined as three times the SD value added to the mean perchlorate was at 607 nm. ^ of ten blank determinations.
Standard curve
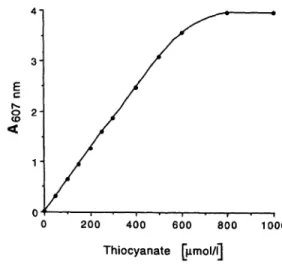
The standard curve was linear up to 500 μιηοΐ/ΐ (fig. 5).
However, a smaller amount of the sample should be taken to the assay if high thiocyanate concentrations are expected.
Recovery, imprecision, and detection limit The absolute recovery of the method was tested by com- paring the absorbance obtained from a standard solution of thiocyanate, 200 μιηοΐ/ΐ, passed through the column with that obtained after direct addition of thiocyanate to sodium perchlorate. In a triplicate experiment the abso- lute recoveries were 101.9, 99.6 and 98.9% respectively.
Analytical recovery of thiocyanate, 50 μιηοΐ/ΐ, added in duplicate experiments to plasma samples with thiocya- nate concentrations of 35.0 and 71.5 μηιοΐ/ΐ respectively, were 96, 99% and 97, 97% respectively. Thiocyanate, 50.0 μηιοΐ/ΐ, added in duplicate to urine samples con- taining 49.0 and 96.3 μιηοΐ/ΐ respectively of thiocyanate gave recoveries of 97, 98% and 102, 104% respectively.
The within-day imprecision of the method was evaluated by analysis often aliquots of a plasma sample and of 10 aliquots of a urine sample. The results obtained (mean and SD) with plasma was 107.1 ±1.17 μπιοΐ/ΐ (CV 1.1%) and with urine 167.4 ±1.15 μιηοΐ/ΐ (CV 0.69).
The long-term imprecision of the method was deter- mined by analysis of aliquots of a urine sample stored at —20 °C on 10 different days for a period of 65 days.
The total mean was 117.9 μηιοΐ/ΐ, SD 1.16 μιηοΐ/ΐ, and CV 0.98%. The detection limit was 0.93 μηιοΐ/ΐ when
3- E
i *
ο 200 400 600 800 1000 Thiocyanate [μιηοΐ/ΐ]
Fig. 5 Standard curve
To the alkaline application solution 25-500 nmol potassium thio- cyanate was added. Regression line from the added standard con- centrations 0-500 μπιοΐ/ΐ was y = 0.030 + O.OOox (r2 = 1.00).
Colour reagent comparison
To further validate the new colour reagent we analyzed 20 plasma and 20 urine samples from healthy non-smok- ers and smokers and compared the obtained values with the pyridine based reagent (18). The results obtained were in satisfactory agreement (fig. 6).
Interference studies
Compounds normally present in body fluids were tested for possible interference at concentrations encountered in urine. The following compounds neither gave any ab- sorbance when added alone to the samples, nor affected the absorbance with thiocyanate, 100 μιηοΐ/ΐ, by more than ± 5%: sodium chloride, ammonium chloride, creat- inine, urea, glycine and cystine. Some commonly pre- scribed drugs such as salicylic acid, 20 mmol/1, ascorbic acid, 10 mmol/1, and thiamine, 1 mmol/1, also did not interfere. Isoniazid did not interfere when added to a concentration of 1 g/1 to a urinary sample.
Sodium nitroprusside had a strong negative interference.
However, this interference could be eliminated by wash- ing the ion-exchange column twice during the clean-up of the sample with 5 ml of ammonium chloride, 4 mol/1, followed by 5 ml of water. This procedure should in- clude the calibrators since the absorbance decreased about 20%.
Cloxacillin, 2 g/1, did not interfere when added to a urine sample. However, a positive interference was obtained when benzylpenicillin, 2 g/1, was added both to water blank and to five different urine samples. An apparent
"thiocyanate" concentration of 25 μπιοΐ/l was observed in water samples and an additional "thiocyanate" con- centration ranging from 13 to 24 μπιοΙ/1 was found in the urine samples. For the urine samples the absorbance of benzylpenicillin was on molar basis only 0.25 — 0.44% of that given by thiocyanate but administration of high doses of the interfering antibiotics may signifi- cantly affect the absorbance. Cephalothin interfered when added to water and urine samples on a molar basis half of that by benzylpenicillin. This interference could be eliminated in the same way as described for sodium nitroprusside.
Cyanide did not separate from thiocyanate in the Chro- matographie step, and it reacts quantitatively in the K nig reaction. The interference from cyanide, however, could be eliminated by washing the column twice with 5 ml'of hydrochloric acid, 1 mol/1, but the cyanide con-
^ 200
Ο 150- Sσ>
φ 100-
&
50- c03
200
Ο 50 100 150 200 Thiocyanate (new reagent) [jimol/l]
ο
^ 150- σ>
(0Φ
,οΕ
Φ ΛC CD
100-
50-
0 50 100 150 200 Thiocyanate (new reagent) [jimol/l]
Fig. 6a Correlation between old and new reagent for determine- Fig. 6b Correlation between old and new reagent for determina- tion of thiocyanate in serum tion of thiocyanate in urine
Regression line; y = 3.792 + 0.917x (r2 = 0.992). Regression line; y = 0.0911 + 1.037x (r2 = 0.995).
centration in plasma and urine is normally < 0.1 μιηοΐ/ΐ and this interference can therefore be neglected.
We recommend the additional column washings when the above mentioned interferences are expected in the samples.
Discussion
Several methods have been described for analysis of thiocyanate by use of K nig reactions (9—26). However only a few of them (14, 18, 19) have been developed for quantitative determinations of thiocyanate in plasma and urine. In the method of Boxer & Richard (14) the samples were deproteinized and thiocyanate was oxi- dized to hydrogen cyanide by acid permanganate. By a stream of nitrogen the hydrogen cyanide was then trans- ferred to a collection tube containing sodium hydroxide and determined by reacting with pyridine and 1-phenyl- 3-methyl-5-pyrazolone. An advantage of this procedure is the elimination of interfering compounds during aera- tion, but the procedure is cumbersome and requires spe- cial glass equipment, which makes the method applic- able only to small series of samples.
In the methods developed earlier in our laboratory (18, 19) the sample was first purified by use of the affinity of selected ion exchangers for thiocyanate. This affinity is probably due to a chaotropic effect rather than an an- ion-exchange mechanism, and the thiocyanate could be eluted by the chaotropic perchlorate ion even at high pH when the resins are uncharged. As discussed in the se- cond communication (19) the Lewatite MP 7080 resin first used in the clean-up (18) had to be replaced because the manufacturers modified the resin resulting in a re- duced affinity for thiocyanate, and it could not be used in our clean-up procedure. Several other ion exchange resins were therefore tested for their ability to selectively
bind thiocyanate, and we found that some weakly basic anion-exchange resins with a polystyrene matrix had strong affinity to thiocyanate (19). Amberlyst A-21 (Rohm & Haas Co., Philadelphia, USA) had a tertiary amine as functional group on a styrene-divinylbenzene copolymer matrix and was as effective as the original Lewatit MP 7080 resin in adsorbing thiocyanate (19).
Unfortunately, Amberlyst A-21 is only available in par- ticle size 0.05-0.1 mm (too small) and 0.3-1.0 mm (too large), and the larger particles therefore have to be ground in a laboratory mill to the size of 0.1-0.3 mm to obtain an optimal flow. Upon request the service of grinding and sieving can be offered from our laboratory.
In separate experiments we also used the unground resin and reduced the flow by the use of a stop-cock. Al- though this procedure is a little trickier it gave the same results as grinding the resin.
The ion exchanger Amberlyst A-21 has a high affinity for the thiocyanate ion and efficient elution was ob- tained with 3.0 ml of sodium perchlorate, 1 mol/1, from a column containing 1.0 ml of Amberlyst A-21, demonstrating a more effective elution compared to Lewatite MP 7080. This made it possible to reduce the sample volume from 0.5 ml to 0.25 ml and the elution volume from 8.0 to 4.0 ml. We analysed two different plasma and urine samples with these reduced volumes and compared the result with the conventional procedure. The results obtained agreed excellently.
Thus with the present ion exchanger we obtain results in accordance with that obtained with the formerly used ion exchanger. Since the earlier method (18) also gave excellent correlation with an oxidation method (14) we conclude that also the present method would give similar results.
Analytical methods should be evaluated by estimation of their precision and accuracy as well as by the costs
348 Lundquist et al.: Determination of thiocyanate in plasma and urine
and practicability of the method. As shown in results the imprecision of this method is quite satisfactory, and the recoveries were quantitative. Although satisfactory re- covery is a requisite for an accurate method this is not enough for evaluation of accuracy. We therefore also investigated possible interference from other com- pounds. Several endogenous and exogenous compounds were tested and positive interferences were found with benzylpenicillin and cephalothin. These interferences are easily eliminated as described.
The present method is useful for detection of low endog- enous concentrations of thiocyanate (detection limit 0.93 μιηοΐ/l) as well as the extremely high levels (up to 4.1 mmol/1) seen in some urine samples from populations in Africa depending on intake of cassava (3, 29). Cassava (manioc, Manihot utilissimd) is a daily staple food for 400 million people (20) and contains the cyanogenic glucoside linamarin, which, if not properly processed before consumption, may cause cyanide intoxication.
The normal human thiocyanate level (18) in serum is 42.5 μιηοΐ/ΐ (SD 17.1 μπιοΐ/l, η = 20) and the urinary excretion of thiocyanate is 43.0 μπκ>1/241ι (SD 22.1 μπκ>1/24 h, n = 20). In an earlier paper we found the mean ± SD serum concentration to be 48.7 ± 30.6 μιηοΐ/ΐ in non-smoking subjects (n = 212), and smoking 1-9 cigarettes per day increased the concentration to 120 ± 56.7 μτηο!71. With higher cigarette consumption (more than 20 cigarettes per day) the mean concentra- tions increased to 150 ± 29.3 μπιοΐ/l (30). Measurement of thiocyanate levels after inhalation of fire smoke indi-
cates exposure to hydrogen cyanide production from combustion of nitrogen containing materials such as plastics. The hypotensive drug sodium nitroprusside contains cyanide (44% of weight) which is metabolised to thiocyanate. Intake of thiocyanate-containing food such as milk, and intake of thiocyanogenic glucosides (cabbage, mustard) or cyanogenic glucosides (kernels, linseed, bamboo spurts) elevate the thiocyanate concen- tration in plasma and urine (31).
The present method affords several advantages over earlier methods (14, 18, 19) for thiocyanate determina- tion in biological materials such as plasma and urine, and we have also found the method suitable in the detei>
mination of saliva thiocyanate. As compared with our earlier method (18, 19) the important improvement with the present method is the replacement of the odorous pyridine with isonicotinic acid. This may be a particular advantage in the tropics in the monitoring of cyanide exposure from cassava. Facilities such as fume chambers may be missing in these developing countries, but the elimination of pyridine is also of great interest in well- equipped laboratories. The solid state of isonicotinic acid also facilitates transport and handling.
Acknowledgements
This work was supported by grants from The Swedish Medical Research Council (Project No. B95-13X-11211-01A), The Swedish Cancer Society (Project 2357-B94-09XCC), the Swedish Society of Medicine (Svenska L kares llskapets Forskningsfonder), The County Council of sterg tland, The Lions Foundation for Medical Research and by grant No. 9414 from Svenska Tobaks AB.
References
1. Pettigrew AR, Logan RW, Willocks J. Smoking in pregnancy
— effects on birth weight and on cyanide and thiocyanate levels in mother and baby. Br J Obstet Gynecol 1977;
84:31-4.
2. Bowes PC. Smoke and toxicity hazards of plastics in fire. Ann Occup Hyg 1974; 17:143-57.
3. Cliff J, Lundquist P, Martensson J, Rosling H, S rbo B. Asso- ciation of high cyanide and low sulphur intake in cassava- induced spastic paraparesis. Lancet II 1985; 1211-3.
4. Langer P, Greer MA. Antithyroid substances and naturally oc- curring goitrogens. Basel: S Karger, 1977:135-7.
5. Pollay M, Stevens A, Davis C. Determinations of plasma-thio- cyanate binding and the Donnan ratio under simulated physio- logical conditions. Anal Biochem 1966; 17:192-200.
6. Funderburk CF, Van Middlesworth L. The effect of thiocyanate concentration on thiocyanate distribution and excretion. Proc Soc Exper Biol Med 1971; 136:1249-52.
7. Lundquist P. Determination of cyanide and thiocyanate in hu- mans [dissertation]. Link ping University Medical Dissert- ations 355, 1992. University Microfilms. Inc Publication A 253534, 49-52.
8. Schulz V. Clinical pharmacokinetics of nitroprusside, cyanide, thiosulphate and thiocyanate. Clin Pharmacokinetics 1984;
9:239-51.
9. K nig W. Untersuchung aus dem organischen Laboratorium der Technischen Hochschule zu Dresden. LXIX. ber eine
neue, vom Pyridin deri vierende Klasse von Farbstoffen. J Prakt Chem 1904; 69:105-37.
10. Aldrige WN. A new method for the estimation of micro quanti- ties of cyanide and thiocyanate. Analyst 1944; 69:262-5.
11. Aldridge WN. The estimation of micro quantities of cyanide and thiocyanate. Analyst 1945; 70:474-6.
12. Epstein J. Estimation of microquantities of cyanide. Anal Chem 1947; 19:272-4.
13. Asmus E, Garschagen H. ber die Verwendung der Barbitur- s ure f r die photometrische Bestimmung von Cyanid und Rhodanid. Zeitschr Analyt Chem 1953; 138:414-22.
14. Boxer GE, Richards JC. Determination of thiocyanate in body fluids. Arch Biochem Biophys 1952; 39:292-300.
15. Somogyi M. A method for the preparation of blood filtrates for the determination of sugar. J Biol Chem 1930;
86:655-63.
16. St a KF. Studies on thiocyanate in serum. In: Second Med- ical Yearbook. Bergen: University of Bergen, Norway.
1957:13-49.
17. Nystr m C, S rbo B. The thiocyanate content in urine and blood from cases of toxemia of pregnancy. Scand J Clin Lab Invest 1957; 9:223-5.
18. Lundquist P, Martensson J, S rbo B, hman S. Method for determining thiocyanate in serum and urine. Clin Chem 1979;
25:678-81.
19. Lundquist P, Märtensson J, Sörbo B, Öhman S. Absorption of thiocyanate by anion exchange resins and its analytical ap- plication. Clin Chem 1983; 29:403.
20. FAO. Roots, tubers, plantains and bananas in human nutrition.
FAO Food and Nutrition Series, No 24. Rome: FAO, 1990.
21. Ishii K, Yamanishi K. The spectrophotometric determination of cyanide ion with isonicotinic acid-pyrazolone. Jpn Anal 1973; 22:448.
22. Watanabe A, Ito I, Hirakoba A. Spectrophotometric determina- tion of cyanide ion with isonicotinic acid-pyrazolone. Jpn Anal
1977; 26:505.
23. Nagashima S. Spectrophotometric determination of cyanide with sodium isonicotinate and sodium barbiturate. Analytica Chimica Acta 1978; 99:197-201.
24. Moderne Analysenmethoden. Darmstadt: Merck, 1983.
25. Essers AJA, Bosveld M, van der Grift, RM, Voragen AGJ.
Studies on the quantification of specific cyanogens in cassava products and introduction of a new chromogen. J Sei Food Agric 1993; 63:287-96.
26. Meeussen JCL, Temminghoff EJM, Keizer MG, Novozamsky I. Spectrophotometric determination of total cyanide, iron — cyanide complexes, free cyanide and thiocyanate in water by a continuous-flow system. Analyst 1989; 114:959-63.
27. Sörbo B, Öhman S. Determination of thiosulphate in urine.
Scand J Clin Lab Invest 1978; 38:521-7.
28. Fände CS, Me Menamy RH. Thiocyanate binding with modi- fied bovine plasma albumins. Arch Biochem Biophys 1970;
136:260-7.
29. Cliff J, Lundquist P, Rosling H, Sörbo B, Wide L. Thyroid function in a cassava-eating population affected by epidemic spastic paraparesis. Acta Endocrinol (Copenh) 1986;
113:523-8.
30. Kagedal B, Märtensson J, Sörbo B, Tibbling L. Serum levels of thiocyanate and thyroid hormones in smoking and non- smoking subjects. Res Comm Subst of Abuse 1981; 2:267-75.
31. Wood JL. Biochemistry. In: Newman AA, editor. Chemistry and biochemistry of thiocyanic acid and its derivatives. Lon- don, New York, San Francisco: Academic Press, 1975:157- 221.
Per Lundquist
SKL — National Laboratory of Forensic Sciences Olaus Magnus vag
S-58194Linköping Sweden