www.ocean-sci.net/11/937/2015/
doi:10.5194/os-11-937-2015
© Author(s) 2015. CC Attribution 3.0 License.
An improved method for the determination of dissolved nitric oxide (NO) in seawater samples
H. E. Lutterbeck and H. W. Bange
Chemical Oceanography, Division of Marine Biogeochemistry, GEOMAR Helmholtz Centre for Ocean Research Kiel, Kiel, Germany
Correspondence to: H. E. Lutterbeck (hlutterbeck@geomar.de)
Received: 13 April 2015 – Published in Ocean Sci. Discuss.: 4 June 2015
Revised: 11 November 2015 – Accepted: 12 November 2015 – Published: 27 November 2015
Abstract. Nitric oxide (NO) is a short-lived intermediate of the oceanic nitrogen cycle; however, due to its high reac- tivity, measurements of dissolved NO in seawater are rare.
Here we present an improved method to determine NO con- centrations in discrete seawater samples. The set-up of our system consisted of a chemiluminescence NO analyser con- nected to a stripping unit. The limit of detection for our method is 5 pmol NO in aqueous solution, which translates into 0.25 nmol L−1when using a 20 mL seawater sample vol- ume. Our method was applied to measure high-resolution depth profiles of dissolved NO during a cruise to the east- ern tropical South Pacific Ocean. It is fast and comparably easy to handle; thus it opens the door for investigating the distribution of NO in the ocean, and it facilitates laboratory studies on NO pathways.
1 Introduction
Nitric oxide (NO) is a short-lived intermediate of various microbial processes of the nitrogen cycle (see e.g. Tham- drup, 2012). Molecular analysis and lab culture experiments have shown that various kinds of bacteria are able to me- tabolize NO, e.g. ammonium-oxidizing bacteria (Lipschultz et al., 1981), nitrite-oxidizing bacteria (Freitag and Bock, 1990), methanotrophic bacteria (Yoshinari, 1985) and den- itrifying bacteria (Firestone et al., 1979). However, it is still unclear which processes are responsible for the occurrence of NO in natural environments. Although ammonium- and nitrite-oxidizing bacteria can produce NO, there is no evi- dence for NO as an intermediate during nitrification. A study which compared mathematical models with the results from a
laboratory-scale waste water sludge reactor showed that den- itrification indeed could be a dominating process of NO re- lease (Kampschreur et al., 2007). The denitrification pathway has been investigated in great detail, and therefore its enzy- matic NO production and the subsequent reduction of NO via the intermediate nitrous oxide (N2O) to nitrogen (N2)are well understood (Zumft, 1997). Another process where NO is involved as an intermediate is anammox (Strous et al., 2006;
Kartal et al., 2011). The latest discovery was the enzymatic dismutation of NO resulting in the microbial production of oxygen (O2)used to oxidize methane under anaerobic con- ditions (Ettwig et al., 2010, 2012). Additionally, NO can be produced in the ocean surface layer by the photochemical re- duction of dissolved nitrite (NO−2)(Zafiriou and True, 1979;
Olasehinde et al., 2010).
In summary, there are various potential microbial NO pro- duction/consumption pathways in the ocean. Unfortunately, our knowledge about the oceanic NO distribution and the major pathways of NO is very poor. There are only a few published NO concentration measurements available (Bange, 2008) because a reliable and easy-to-use method to deter- mine dissolved NO at in situ concentrations in seawater sam- ples is lacking.
Gaseous and dissolved NO is a very reactive and, thus, short-lived molecule because it is a free radical. Its occur- rence is predominantly dependent on the presence of O2
(Lewis and Deen, 1994). Therefore, the determination of dis- solved NO under in situ conditions is challenging. A sum- mary of the existing methods for the determination of NO is given by Hetrick and Schoenfisch (2009). The published methods for measurement of dissolved NO in seawater are listed in Table 1. The detection limits range from 0.0015
Table 1. Overview of published methods for NO detection in sea- water with the respective limit of detection (LOD) for each method.
Method LOD [nmol L−1] Reference
Microelectrode 140 Zhang et al., 2003
Microelectrode 42 Xing et al., 2005
Microelectrode 30 Schreiber et al., 2008 Fluorometric 0.0124∗ Olasehinde et al., 2009 Chemiluminescence 0.0015 Ward and Zafiriou, 1988 Chemiluminescence 0.25 This study
∗LOD for the conversion product from the reaction of NO with the trapping compound
to 140 nmol L−1. (Please note that the fluorometric detec- tion of NO as described by Olasehinde et al., 2009, is suit- able only for formation rates of NO from NO−2). The sen- sor of Schreiber et al. (2008) was developed for sediments but works in seawater samples as well. The chemilumines- cence system of Zafiriou and McFarland (1980) consisted of an NO analyser connected to a stripping unit and is, thus, similar to the set-up described here. The method by Zafiriou and McFarland (1980) is the only one yet to be applied on board to measure NO depth profiles during a cruise (Ward and Zafiriou, 1988). However, the required intensive cleaning of the Niskin bottles prior to the CTD/rosette casts together with the fact that each depth was sampled with a separate cast resulted in a time-consuming and unhandy sampling proce- dure.
Therefore, it was the aim of this study to develop an im- proved (easy to handle) method for the detection of dissolved NO in discrete seawater samples at in situ concentrations in order to decipher its role in the oceanic nitrogen cycle.
2 Material and methods 2.1 Instrumental set-up
The set-up of our system consisted of a NO analyser con- nected via a four-way gas stream selecting valve to a strip- ping unit and to the gas cylinders for reference gas and carrier gas (Fig. 1).
The carrier gas (N2)and the reference gas (1000 ppb NO in N2)were connected to a two-channel mass flow controller with mixing chamber (HTK Hamburg GmbH, Hamburg, Germany) to ensure a constant gas flow rate of 1 L min−1 and to enable the calibration of the detector signal (see Sect. 2.4.1). The mass flow controller, in turn, was connected to the gas stream selecting valve. This four-way valve en- abled us to switch between two modes of gas flow: mode A enabled the direct measurement of the reference gas and car- rier gas, and mode B allowed detection of the gas stream after going through the stripping unit.
The sample and stripping vials were connected to the gas line by needles (diameter 1.2 mm) pushed through the re- spective septa. Two inline filters (Whatman Solvent IFD, 0.2 µm, GE Healthcare UK Limited, Buckinghamshire, Eng-
N2 N2+ water N2+ NO
G
Air
J C F
E A
B
D
H E
Figure 1. Schematic set-up of the developed measurement system consisting of an NO analyser connected to a stripping unit (blue lines). A: N2gas cylinder; B: reference gas cylinder; C: mass flow controller; D: four-way valve (solid lines: mode A; dashed lines:
mode B); E: inline filter; F: needle valve; G: sample vial; H: strip- ping vial filled with water; I: NO analyser with air supply for ozone generator; J: vacuum pump with vent.
land) were installed to remove aerosols from the gas stream.
Between the four-way valve and the NO analyser a needle valve was installed to reduce pressure variations. For a de- tailed description of the measurement procedure see Sect. 2.2 (samples) and 2.4 (standards) below.
For detection, we used a chemiluminescence NO anal- yser (model 42i-TL, Thermo Fisher Scientific Inc, Waltham, MA, USA) with a detection range from 0 to 1000 ppb. In the reaction chamber of the analyser, NO reacts with ozone (O3) generated by an O3 generator and produces NO2 in an excited state (NO∗2). By relaxation to the ground state the NO∗2 emits a photon. The emitted light passes an op- tical filter to remove interferences from other compounds and is detected by a photomultiplier. The signal recording was done with the open-source software PuTTY 0.62 (http:
//filehippo.com/de/download_putty/11216/).
2.2 Sample handling
Sampling took place with a commonly used conductivity temperature depth sensor, equipped with a Niskin bottle rosette (CTD/rosette) as well as with a pump CTD (pCTD) system (Strady et al., 2008) during the Meteor cruise M93 from 6 February to 11 March 2013 to the eastern tropi- cal South Pacific off Peru (Callao, Peru, to Panama City, Panama). Seawater samples were taken bubble free in 20 mL brown glass vials, closed with rubber plugs and crimped with aluminium caps. Immediately after sampling all sam- ples were stored in a cooling box (∼6◦C) until they were measured. From each water depth three to six replicates were taken. From the CTD/rosette all samples were taken as soon as possible, after the CTD was back on the ship’s working
deck, and they were analysed within 1 h. The samples from the pCTD were taken as soon as the target depth was reached and were measured immediately within a few minutes after sampling.
For the measurement, the four-way valve was switched to mode A to enable the connection of the sample vial by the needles. In the next step the four-way valve was switched to mode B to reroute the gas flow through the stripping unit. The water of the sample was pushed with the carrier gas into the stripping vial. The stripping vial had a larger volume (50 mL) than the sample vial to allow purging of the sample. The dis- solved NO was stripped from the sample by N2 and trans- ported with the carrier gas stream into the analyser. The sam- ple stayed connected with the stripping unit (mode B) until the detector signal came back to the baseline. Then the four- way valve was switched to mode A and the next sample was connected.
2.3 Experiments
For sample storage experiments we took 18 samples from the pCTD at two stations from the oxygen minimum zone (OMZ) at depths between 60 and 90 m and stored nine of them at room temperature (∼24◦C) and nine at∼6◦C in the dark. For the time series, triplicates per temperature were measured in various time steps.
For NO−2 addition tests we added 20 µL of a 20 mmol L−1 sodium nitrite (NaNO2)aqueous solution to about 100 sam- ples taken at different stations and depths; this corresponds to a concentration of 20 µmol L−1, in addition to the natural concentration already present in the sample. Samples were stored for different time periods, between some minutes and some hours in warm (∼24◦C) and cold (∼6◦C) environ- ments and then measured like normal samples. Additionally we stored control samples without NO−2 addition under the same conditions.
2.4 Calibration
2.4.1 Detector calibration
To calibrate the detector signal, the carrier gas (N2) was blended with the reference gas (1000 ppb NO in N2)by the mass flow controller (see above). The resulting NO mixing ratios covered the whole detection range of the NO analyser (0 to 1000 ppb).
2.4.2 Gas standard injection
Discrete volumes of reference gas ranging from 0.5 to 10 mL were injected with a gas-tight syringe (series A-2, Valco In- struments Company Inc., Houston, TX, USA) into the empty stripper. Two different reference gases with concentrations of 1000 ppb NO and 10 ppm NO were used.
2.4.3 Aqueous NO standard solutions
For preparation of aqueous NO standard solutions a 20 mL brown glass vial filled with 10 mL Milli-Q water was purged with N2 for 1 h at a flow rate of 100 mL min−1 and then with pure NO or a reference gas (1 % NO in N2), at a flow rate of 5 mL min−1 for 2 h. Assuming a solubility of 1.94±0.03 mmol L−1atm−1at 25◦C for NO (Zacharia and Deen, 2005, and references therein) the final concentrations of the solutions were 1.94 mmol L−1and 19.4 µmol L−1re- spectively. The standards were stored in the dark at room temperature.
For the actual measurements 20 mL Milli-Q water was de- oxygenated with N2for 1 h at a flow rate of 150 mL min−1 in a 50 mL vial. Then the vial was connected to the strip- ping unit, followed by an injection of varying volumes (in the range from 1 to 100 µL) of standard through the septum of the vial.
2.4.4 In situ NO formation from NO−2 reduction This calibration method is based on the in situ formation of NO by chemical reduction of NO−2 with iodide in an acidic aqueous medium (Cox, 1980). The preparation of the NO−2 solution started with a stock solution of 1 mol L−1 NaNO2 in Milli-Q water and was followed by a two-step dilution se- ries (100 µL in 100 mL Milli-Q water) to get two NO−2 stan- dards with concentrations of 1 mmol L−1 and 1 µmol L−1. They were stored in the dark at room temperature.
The reaction solution is made of two solutions: 11 mL glacial acetic acid was added to 100 mL Milli-Q water, yield- ing a 10 % acetic acid (with a concentration of 1.68 mol L−1; Kester et al., 1994), and 3 g KI was dissolved in 100 mL Milli-Q water to get a 3 %w/vKI solution (Garside, 1982).
Prior to a measurement, 1 mL of the KI solution and 1.5 mL 10 % acetic acid were mixed in a 50 mL vial and Milli-Q water was added to a final volume of 20 mL. The vial was purged for 20 min with N2(flow rate 150 mL min−1) to remove the O2 and was then connected to the stripping unit. Then the NO−2 solution was added via the septum as described above.
2.5 Data analysis
The recorded NO signals (i.e. peaks) were integrated manu- ally with Origin (OriginLab, Northampton, MA, USA). With the obtained peak areas from the standard measurements a linear calibration equation was calculated to convert the peak areas of sample measurements into concentrations.
The signal-to-noise ratio (S/N) was calculated by an equation of Stauffer (2008):
S/N=2H /hN. (1)
H stands for the height of the signal and hN is the height of the baseline noise. For the limit of detection (LOD) the
Table 2. Overview of the limit of detection (LOD), the limit of quantification (LOQ), the standard deviation (SD) and the estimated stability time of the applied standards types.
Standard LOD [pmol] LOQ [pmol] SD [%] Stability time
Aqueous NO standard solution 5 20 25 10 months
In situ NO formation from NO−2 reduction 10 40 3 –
Reference gas 15 30 10 1 year
value of S/N was set to 3, and for the limit of quantifica- tion (LOQ) a value of 10 was used. NO signals below the detection limit were set to zero in further calculations (e.g.
averaging of replicates).
3 Results and discussion 3.1 Method evaluation 3.1.1 Standard measurements
To assess the performance of our instrumental set-up, we calculated the LOD, the LOQ and the standard deviation (SD, average from all measurements over the whole detec- tion range) for the different gaseous and aqueous standards.
The results are summarized in Table 2. Please note that the values are given as molar amounts of substance and not as concentrations in order to get volume-independent numbers and thus a better comparability between the different kinds of standards described in Sect. 2.4.2–2.4.4. Concentrations for sample measurements are discussed in Sect. 3.1.2.
For aqueous NO standards (see Sect. 2.4.3) the lowest de- tectable molar amount of NO was 5 pmol with a SD of 25 %.
The SD is relatively high compared to the two other used standards and may be caused by the syringes used in com- bination with the very small injection volumes. The syringes were open at the needle end and could not be locked. Hence during the transfer from the vial containing the standard to the stripping vial the NO concentrations could be changed by external influences (e.g. contamination by diffusion through the needle), and with a smaller volume the effects get bigger.
For nitrite the formation of NO occurs in the closed system, and so the transport from one vial to the other could not affect the measured concentration. The gas standards were injected with a larger volume and gas-tight syringes. We observed that the aqueous NO solutions did not change in 10 months. This indicates that the standard solutions are stable much longer than previously reported (Mesaros et al., 1997; Menon et al., 1991).
For in situ NO formation from NO−2 reduction (see Sect. 2.4.4) the LOD was 10 pmol NO and the SD 3 %. The detection limit is higher than for aqueous NO solutions be- cause NO is formed in situ, which results in broader peaks with lower peak heights. We observed no decrease of the NO−2 concentration in the standards during our measure-
ments and conclude that the NO−2 solutions should be stable when kept in the dark.
Discrete gas standard measurements (see Sect. 2.4.2) had a detection limit of 15 pmol NO. By cleaning the gas-tight syringes after five measurements with 100 % ethanol, the SD could be decreased from 65 to 10 %, whereas cleaning with Milli-Q did not improve the SD. Also a cleaning of the sy- ringe after every measurement resulted in no further decrease of the SD. We observed no influence of the injected volume between 0.5 and 10 mL on the detected NO. The stability of the used reference gases (1 year) was given by the manufac- turer.
3.1.2 Sample measurements
With a water volume of 20 mL the LOD and the LOQ for dissolved NO translate into concentrations of 0.25 and 1 nmol L−1respectively. By enlarging the sample volume the detection limit can be lowered. However, the peaks will get broader with larger volume; thus the detection limit will not decrease in the same amount as the sample volume is in- creased. We observed, for example, that by increasing the sample volume from 20 to 80 mL the detection limit rose to 10 pmol detectable molar amount of NO but the detectable concentration decreased to 0.125 nmol L−1.
3.2 Interferences by other components 3.2.1 Hydrogen sulphide (H2S)
During cruise M93 we faced a sulfidic event close to the coast of Peru. Therefore, some of the samples contained H2S, which resulted in a strong negative detector signal (Fig. 2a).
A visible negative response of the NO analyser (i.e. stronger than the baseline noise of the instrument) was determined down to a concentration of about 80 nmol L−1H2S, but even lower H2S concentrations could have an impact on the NO signal such as neutralization of a positive NO signal.
The reason for the negative peaks is a change of the sig- nal from the continuous background calibration of the NO analyser itself. Parallel to the normal detection in the reac- tion chamber (described at the end of Sect. 2.1) the sam- ple is mixed in a prereactor chamber with a high amount of ozone to remove the NO before the sample is led into the re- action chamber. This leads to a continuous zero calibration of the instrument. H2S seems to affect this background sig-
Figure 2. Detector signal for six seawater samples containing H2S.
(a) Signal passing the prereactor. (b) Prereactor signal.
nal (Fig. 2b). The signal from the prereactor channel induced by H2S is stronger than from the normal channel passing the prereactor, which leads to the negative detector signal.
Tests with addition of ZnCl2(in order to precipitate H2S as ZnS) showed that the negative peaks of H2S did indeed van- ish, but the impact of ZnCl2addition on the NO concentra- tion in the sample is unknown. It might be possible that NO is removed from the sample by chemical reduction. Some pre- liminary lab incubation tests with Paracoccus denitrificans DSM 413 showed that ZnCl2can also increase the NO con- centration (NO concentration without ZnCl2: 12 nmol L−1; NO concentration after addition of 0.5 mL 50 %w/vZnCl2 to a 30 mL culture: 4458 nmol L−1). A reason for that may be that NO could be involved in cell death. For example in diatoms a stress surveillance system based on NO and cal- cium was found which is suggested to be widespread among phytoplankton (Vardi et al., 2006, 2008; Vardi, 2008). More- over, Hawkins et al. (2013) found a pathway including pro- grammed cell death in a model sea anemone–dinoflagellate symbiosis. Both studies detected an increase of NO coming along with cell death. So it may be possible that the addition of ZnCl2, a common method to poison plankton, leads to an increase of NO in seawater samples.
3.2.2 Nitrite (NO−2)
NO can photochemically be produced from dissolved NO−2 (Zafiriou and True, 1979; Olasehinde et al., 2010). As NO−2 can be enhanced in the water column (especially in OMZs) we performed NO−2 addition tests to find out if there is any
light-induced production of NO caused by our sample han- dling.
Our experiments showed no differences in NO concentra- tions between samples with and without NO−2 addition. The addition of 1 mL of a 1 mmol L−1NaNO2solution to 20 mL Milli-Q water resulted only in a very small NO peak. Thus we conclude that a potential in situ production of NO from NO−2 does not affect the measurement method described here.
3.2.3 Organic compounds
It is imaginable that organic compounds could also influence the detected NO concentration. A well-known fact is the re- lease of NO by photolysis from nitroso compounds which have a NO group bound to an organic moiety (e.g. Ignarro et al., 1981; Adeleke and Wan, 1974). These compounds are ubiquitous in cells because they are used for the transport of NO during cell signalling (Ignarro, 1990).
To our knowledge no measurements of nitroso compounds in the ocean exist so far. Therefore, it is not possible to re- alistically estimate how much NO could be generated by these compounds during the sample handling. Further tests are needed to evaluate the strength of the interferences. In- deed, several methods for the detection of nitroso compounds by photolytic (e.g. Alpert et al., 1997) or chemical (e.g.
Samouilov and Zweier, 1998) release of NO from nitrosy- lated compounds and the subsequent detection of NO by chemiluminescence exist already. It should be tested if these methods could be applied to seawater samples.
3.3 Sample handling
Two factors influenced the NO concentrations in the sam- ples: the storage time (i.e. the time between sampling and the actual measurement of the sample) and the ambient O2 concentrations. This is especially important for samples from the OMZ where slight changes in O2are expected to have a significant effect on dissolved NO (Lewis and Deen, 1994).
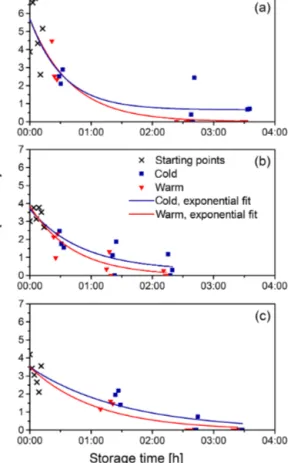
The storage experiments showed a decrease in NO concen- trations over time, with a stronger decline at room tempera- ture compared to storage at∼6◦C (Fig. 3). The decrease of the NO concentrations may be explained by the well-known common effect of bottle consumption caused by pores in the glass vials and in the rubber stoppers. However, a stronger effect on the NO concentration is probably caused by dif- fusion of O2 into the sample. De Brabandere et al. (2012) showed that O2 contamination can be caused by diffusion of O2out of the rubber plugs. At room temperature the dif- fusion of 1 nmol O2 into a water sample takes only a few seconds. Compared to this, the diffusion of NO out of the sample, i.e. the bottle consumption, is negligible. Under the assumption that (i) the diffusion coefficients of NO and O2 are about the same (Zacharia and Deen, 2004; Goldstick and Fatt, 1970), that (ii) both compounds have the same distance
Figure 3. Degradation curves of three sample storage tests. The samples were kept in the dark at room temperature (∼24◦C, red triangles) and at 6◦C (blue squares). The measurements from the regular sampling (black crosses) were used as starting points for the curve fitting of both temperature settings. (a–b) M93 station 399-4 at 12.525◦S, 77.597◦W; sampling depth: 77 and 67 m respectively.
(c) M93 station 391-4 at 12.668◦S, 77.821◦W; sampling depth:
87 m.
to “travel” and that (iii) the target concentration (outside the sample for NO and in the sample for O2)is zero, only the starting concentrations are important for the diffusion speed.
With a starting concentration of 5 nmol L−1 NO, the diffu- sion of NO out of the sample is 208 600 times slower than for O2into the sample in relation to the values given by De Brabandere et al. (2012) for O2.
Even though NO is very O2 sensitive (Lewis and Deen, 1994), oxidation of NO by O2alone cannot explain the de- crease of NO, because it is too slow. With concentrations of 5 nmol L−1 NO and 1 µmol L−1 O2, the half-life period of the reaction is higher than 6000 h, and for lower concentra- tions it is even longer. That means that other reactions have to be responsible for the short lifetime of NO in biological systems (Kharionov et al., 1994; Ignarro et al., 1993). One reason could be that in OMZ waters slight changes in O2 concentrations at nanomolar levels induce strong changes of metabolic rates (Dalsgaard et al., 2014; Tiano et al., 2014;
Figure 4. Comparison of the NO measurements from the CTD/rosette (red) and from the pCTD (blue). (a–b) All NO mea- surements during M93 between 0 and 350 m. (c) M93 station 411- 6 at 12.377◦S, 77.388◦W. (d) M93 station 391-4 at 12.668◦S, 77.821◦W; the bottom depth was 1654 m.
Kalvelage et al., 2011). Overall, it can be assumed that bio- logical processes affected by O2impurities are the main rea- son for decrease of NO in the sample vials.
The potential biological consumption of NO, e.g. by den- itrification and anammox, in the samples from the OMZ can also explain the enhanced decrease at room temperature com- pared to storage at∼6◦C. As the metabolic activity is higher at room temperature compared to∼6◦C, more NO could be used up. Another reason for the temperature effect is that at higher temperatures the diffusion of O2 into the sample is faster and thus the effect on the NO metabolism is stronger.
The choice of the water sampling system had a large im- pact on the NO concentrations in the samples (Niskin bot- tles or pCTD). The scatter plot with our measurements from the Niskin bottles of the CTD/rosette (Fig. 4a) shows that the NO concentrations were mostly near or below the detec- tion limit. Only a few samples showed NO concentrations of up to 2 nmol L−1. Contrasting to this, samples from the pCTD (Fig. 4b) showed a broad range of concentrations up to 10 nmol L−1. This has been confirmed by direct compar- ison of both CTD systems on two stations (Fig. 4c–d). No change in NO concentrations with depth was evident from CTD/rosette casts, whereas from the pCTD plausible shapes of the NO depth profiles were obtained.
One reason for the obvious difference between the two CTD systems is most likely the time effect as found in our sample storage experiments, which might have occurred in the Niskin bottles as well. The seawater stays between 30 min and several hours in the Niskin bottles during the time of a CTD cast until sampling. During this time an O2 contam- ination of 1 µmol L−1 can be induced (Alarcón and Ulloa, 2009). This O2entry into the bottles together with a compa- rably long CTD cast time may result in a strong decrease of NO even before the samples could be taken. For the pCTD system a diffusive O2input to the water while being pumped up of only 20 nmol L−1after 1 h of pumping has been esti- mated (Canfield et al., 2010), resulting in a low O2contami- nation. The short residence time of the seawater in the tubing in combination with a smaller O2contamination might have led to comparable lower NO degradation and thus in turn to higher detectable NO concentrations in the samples taken from the pCTD. However, another point should be taken into account: during the in situ pumping, cells are heavily stressed and could be disrupted, which might result in a release of in- tracellular NO from broken cells and/or an enhanced stress- induced NO production similar to the system found by Vardi et al. (2006).
Overall, NO samples are unstable after sampling so they have to be processed very fast. Thus, it is recommended to use a pCTD as a sampling system, and O2 contamination should be reduced to a minimum (e.g. by using deoxygenated materials). However, it may be possible that NO concentra- tions are rather underestimated due to sampling time and de- layed until measurement.
4 Summary
Here we present an improved method to determine dissolved NO in discrete seawater samples. The set-up of our system consisted of a chemiluminescence NO analyser connected to a stripping unit. The lower limit of detection for our method was 5 pmol NO in aqueous solution, which corresponds to 0.25 nmol L−1when using a 20 mL seawater sample volume.
Our method was applied to measure high-resolution depth profiles of dissolved NO during a cruise to the eastern tropi- cal South Pacific Ocean. One CTD cast (including sampling) can be processed in less than 2 h. However, for the sampling we recommend using a pCTD rather than a conventional CTD/rosette with Niskin bottles. In general, contamination by O2diffusion into the samples should be minimized by us- ing appropriate materials. Dissolved H2S interferes strongly with the NO detection, whereas the in situ production of NO from dissolved NO−2 seems to be negligible.
The in situ formation of NO from NO−2 reduction (with io- dide in acidified aqueous medium) would also allow applying our set-up for the measurements of dissolved NO−2 (and ni- trate) in seawater samples (Garside, 1982) down to very low concentrations.
The method for the determination of dissolved NO as de- scribed here is fast and comparably easy to handle; thus it opens the door for comprehensive measurements of the dis- tribution of oceanic NO, and it facilitates laboratory studies on NO pathways.
Appendix A
Nitrogen (N2, 99.999 %), reference gases (1000±50 ppb NO in N2, 10±0.2 ppm NO in N2, 1±0.02 % NO in N2), and nitric oxide (NO,≥99.5 %) were purchased from Air Liq- uide GmbH (Düsseldorf, Germany). Sodium nitrite (NaNO2,
≥99.0 %, p.a.), zinc chloride (ZnCl2, ≥98.0 %, p.a.) and acetic acide (100 %) were from Merck KGaA (Darmstadt, Germany). And potassium iodide (KI, ≥99.5 %, p.a.) was obtained from Carl Roth GmbH (Karlsruhe, Germany).
All tubings were from stainless steel or PTFE with a diam- eter of 1/4 and 1/8 in. Valves, fittings and needles were also made of stainless steel.
Processing a measurement with our system is fast, easy and takes only a few minutes. Up to 20 measurements can be done within 1 h.
The instrument showed a stable baseline and no drift over time for 2 years. For measurements in solution and at higher concentration ranges, it is important to include breaks and cleaning of the stripping unit between the measurements to prevent a less sensitive detection limit. The higher the NO concentrations are, the more often breaks and cleaning are needed to keep the baseline stable. The same applies for Milli-Q water and reaction solution for aqueous standard measurements. The two liquids can be reused for several measurements. The number of possible measurements done with the same liquid depends on the concentration. With higher concentrations the liquid should be replaced more of- ten to keep the baseline constant.
Acknowledgements. We sincerely thank the chief scientists of cruise M93, Torsten Kanzow und Gaute Lavik, as well as the crew of R/V Meteor for their support at sea. We thank D. Arévalo- Martínez for his help with the sampling during the cruise. The authors thank C. Löscher for her helpful comments on an early draft of the manuscript. The financial support of the DFG-funded (Deutsche Forschungsgemeinschaft) Collaborative Research Cen- ter 754/Sonderforschungsbereich 754 “Climate-Biogeochemistry Interactions in the Tropical Ocean” (www.sfb754.de) is gratefully acknowledged.
The article processing charges for this open-access publication were covered by a Research
Centre of the Helmholtz Association.
Edited by: M. Hoppema
References
Adeleke, B. B. and Wan, J. K. S.: Further ESR evidence of the pri- mary N-N cleavage in the photolysis of dimethylnitrosamine: In- direct spin trapping of the primary radical NO, Mol. Photochem., 6, 329–331, 1974.
Alarcón, G. and Ulloa, O.: Cruise Report, MOOMZ-2, Departa- mento de Oceanografía, Universidad de Concepción, Concep- ción, Chile, 28 pp., 2009.
Alpert, C., Ramdev, N., George, D., and Loscalzo, J.: Detection of S-nitrosothiols and other nitric oxide derivatives by photolysis- chemiluminescence spectrometry, Anal. Biochem., 245, 1–7, 1997.
Bange, H. W.: Gaseous nitrogen compounds (NO, N2O, N2, NH3) in the ocean, in: Nitrogen in the Marine Environment, 2, edited by: Capone, D. G., Bronk, D. A., Mulholland, M. R., and Car- penter, E. J., Elsevier, Amsterdam, the Netherlands, 51–94, 2008 Canfield, D. E., Stewart, F. J., Thamdrup, B., De Brabandere, L., Dalsgaard, T., Delong, E. F., Revsbech, N. P., and Ulloa, O.:
A cryptic sulfur cycle in oxygen-minimum–zone waters off the Chilean coast, Science, 330, 1375–1378, 2010.
Cox, R. D.: Determination of nitrate and nitrite at the parts per billion level by chemiluminescence, Anal. Chem., 52, 332–335, 1980.
Dalsgaard, T., Stewart, F. J., Thamdrup, B., De Brabandere, L., Revsbech, N. P., Ulloa, O., Canfield, D. E., and DeLongg, E.
F.: Oxygen at nanomolar levels reversibly suppresses process rates and gene expression in anammox and denitrification in the oxygen minimum zone off northern Chile, mBio, 5, e01966-14, doi:10.1128/mBio.01966-14, 2014.
De Brabandere, L., Thamdrup, B., Revsbech, N. P., and Foadi, R.: A critical assessment of the occurrence and extend of oxygen con- tamination during anaerobic incubations utilizing commercially available vials, J. Microbiol. Meth., 88, 147–154, 2012.
Ettwig, K. F., Butler, M. K., Le Paslier, D., Pelletier, E., Mangenot, S., Kuypers, M. M. M., Schreiber, F., Dutilh, B. E., Zedelius, J., de Beer, D., Gloerich, J., Wessels, H. J. C. T., van Alen, T., Luesken, F., Wu, M. L., van de Pas-Schoonen, K. T., Op den Camp, H. J. M., Janssen-Megens, E. M., Francoijs, K.-J., Stun- nenberg, H., Weissenbach, J., Jetten, M. S. M., and Strous, M.:
Nitrite-driven anaerobic methane oxidation by oxygenic bacteria, Nature, 464, 543–548, 2010.
Ettwig, K. F., Speth, D. R., Reimann, J., Wu, M. L., Jetten, M. S.
M., and Keltjens, J. T.: Bacterial oxygen production in the dark, Front. Microbiol., 3, 273, 2012.
Firestone, M. K., Firestone, R. B., and Tiedje, J. M.: Nitric oxide as an intermediate in denitrification: Evidence from nitrogen-13 isotope exchange, Biochem. Biophy. Res. Co., 91, 10–16, 1979.
Freitag, A. and Bock, E.: Energy conservation in Nitrobacter, FEMS Microbiol. Lett., 66, 157–162, 1990.
Garside, C.: A chemiluminescent technique for the determination of nanomolar concentrations of nitrate and nitrite in seawater, Mar.
Chem., 11, 159–167, 1982.
Goldstick, T. K. and Fatt, I.: Diffusion of oxygen in solutions of blood proteins, Chem. Eng. Prog. S. Ser., 66, 101–113, 1970.
Hawkins, T. D., Bradley, B. J., and Davy, S. K.: Nitric oxide me- diates coral bleaching through an apoptotic-like cell death path- way: evidence from a model sea anemone-dinoflagellate symbio- sis, FASEB J., 12, 4790–4798, 2013.
Hetrick, E. M. and Schoenfisch, M. H.: Analytical chemistry of ni- tric oxide, Annu. Rev. Anal. Chem., 2, 409–433, 2009.
Ignarro, L. J.: Biosynthesis and metabolism of endothelium-derived nitric oxide, Annu. Rev. Pharmacol., 30, 535–560, 1990.
Ignarro, L. J., Lippton, H., Edwards, J. C., Baricos, W. H., Hyman, A. L., Kadowitz, P. J., and Gruetter, C. A.: Mechanism of vas- cular smooth muscle relaxation by organic nitrates, nitrites, ni- troprusside and nitric oxide: evidence for the involvement of S- nitrosothiols as active intermediates, J. Pharmacol. Exp. Ther., 218, 739–749, 1981.
Ignarro, L. J., Fukuto, J. M., Griscavage, J. M., Rogers, N. E., and Byrns, R. E.: Oxidation of nitric oxide in aqueous solution to ni- trite but not nitrate: comparison with enzymatically formed nitric oxide from L-arginine, P. Natl. Acad. Sci. USA, 90, 8103–8107, 1993.
Kalvelage, T., Jensen, M. M., Contreras, S., Revsbech, N. P., Lam, P., Günter, M., LaRoche, J., Lavik, G., and Kuypers, M.
M. M.: Oxygen sensitivity of anammox and coupled N-cycle processes in oxygen minimum zones, PLoS ONE, 6, e29299, doi:10.1371/journal.pone.0029299, 2011.
Kampschreur, M. J., Picioreanu, C., Tan, N., Kleerebezem, R., Jet- ten, M. S. M., and van Loosdrecht, M. C. M.: Unraveling the source of nitric oxide emission during nitrification, Water Envi- ron. Res., 79, 2499–2509, 2007.
Kartal, B., Maalcke, W. J., de Almeida, N. M., Cirpus, I., Gloerich, J., Geert, W., den Camp, H., Harhangi, H. R., Janssen-Megens, E.
M., Francoijs, K. J., Stunnenberg, H. G., Keltjens, J. T., Jetten, M. S. M., and Strous, M.: Molecular mechanism of anaerobic ammonium oxidation, Nature, 479, 127–130, 2011.
Kester, R. A., Wijlhuizen, A. G., Duyts, H., and Laanbroek, H.
J.: Chemiluminescence analysis of nitric oxide in small-volume samples by a modified injection method, Biol. Fert. Soils, 18, 260–262, 1994.
Kharitonov, V. G., Sundquist, A. R., and Sharma, V. S.: Kinetics of nitric oxide autoxidation in aqueous solution, J. Biol. Chem., 269, 5881–5883, 1994.
Lewis, R. S. and Deen, W. M.: Kinetics of the reaction of nitric oxide with oxygen in aqueous solutions, Chem. Res. Toxicol., 7, 568–574, 1994.
Lipschultz, F., Zafiriou, O. C., Wofsy, S. C., McElroy, M. B., Valois, F. W., and Watson, S. W.: Production of NO and N2O by soil nitrifying bacteria, Nature, 294, 641–643, 1981.
Menon, N. K., Pataricza, J., Binder, T., and Bing, R. J.: Reduction of biological effluents in purge and trap micro reaction vessels and detection of endothelium-derived nitric oxide (edno) by chemi- luminescence, J. Mol. Cell. Cardiol., 123, 389–393, 1991.
Mesaros, S., Grunfeld, S., Mesarosova, A., Bustin, D., and Malin- ski, T.: Determination of nitric oxide saturated (stock) solution by chronoamperometry on a porphyrine microelectrode, Anal.
Chim. Acta, 339, 265–270, 1997.
Olasehinde, E. F., Takeda, K., and Sakugawa, H.: Development of an analytical method for nitric oxide radical determination in nat- ural waters, Anal. Chem., 81, 6843–6850, 2009.
Olasehinde, E. F., Takeda, K., and Sakugawa, H.: Photochemical production and consumption mechanisms of nitric oxide in sea- water, Environ. Sci. Technol., 44, 8403–8408, 2010.
Samouilov, A. and Zweier, J. L.: Development of chemiluminescence-based methods for specific quantitation of nitrosylated thiols, Anal. Biochem., 258, 322–330, 1998.
Schreiber, F., Polerecky, L., and de Beer, D.: Nitric Oxide Microsen- sor for high spatial resolution measurements in biofilms and sed- iments, Anal. Chem., 80, 1152–1158, 2008.
Stauffer, D.: Das Chromatogramm, in: Chromatogramme richtig in- tegrieren und bewerten: Ein Praxishandbuch für die HPLC und GC, edited by: Kromidas, S. and Kuss, H., Wiley-VCH, Wein- heim, Germany, 2008.
Strady, E., Pohl, C., Yakushev, E. V., Krüger, S., and Hennings, U.:
PUMP–CTD-System for trace metal sampling with a high verti- cal resolution. A test in the Gotland Basin, Baltic Sea, Chemo- sphere, 70, 1309–1319, 2008.
Strous, M., Pelletier, E., Mangenot, S., Rattei, T., Lehner, A., Tay- lor, M. W., Horn, M., Daims, H., Bartol-Mavel, D., Wincker, P., Barbe, V., Fonknechten, N., Vallenet, D., Segurens, B., Schenowitz-Truong, C., Médigue, C., Collingro, A., Snel, B., Dutilh, B. E., Op den Camp, H. J. M., van der Drift, C., Cirpus, I., van de Pas-Schoonen, K. T., Harhangi, H. R., van Niftrik, L., Schmid, M., Keltjens, J., van de Vossenberg, J., Kartal, B., Meier, H., Frishman, D., Huynen, M. A., Mewes, H.-W., Weissenbach, J., Jetten, M. S. M., Wagner, M., and Le Paslier, D.: Deciphering the evolution and metabolism of an anammox bacterium from a community genome, Nature, 440, 790–794, 2006.
Thamdrup, B.: New pathways and processes in the global nitrogen cycle, Annu. Rev. Ecol. Evol. S., 43, 407–428, 2012.
Tiano, L., Garcia-Robledo, E., Dalsgaard, T., Devol, A. H., Ward, B. B., Ulloa, O., Canfield, D. E., and Revsbech N. P.: Oxygen distribution and aerobic respiration in the north and south eastern tropical Pacific oxygen minimum zones, Deep-Sea Res. Pt. I, 94, 173–183, 2014.
Vardi, A.: Cell signaling in marine diatoms, Commun. Integr. Biol., 1, 134–136, 2008.
Vardi, A., Formiggini, F., Casotti, R., De Martino, A., Ribalet, F., Miralto, A., and Bowler, C.: A stress surveillance system based on calcium and nitric oxide in marine diatoms, PLoS Biol., 4, e60, 2006.
Vardi, A., Bidle, K. D., Kwityn, C., Hirsh, D. J., Thompson, S. M., Callow, J. A., Falkowski, P., and Bowler, C.: A diatom gene regu- lating nitric-oxide signaling and susceptibility to diatom-derived aldehydes, Curr. Biol., 18, 895–899, 2008.
Ward, B. B. and Zafiriou, O. C.: Nitrification and nitric oxide in the oxygen minimum of the eastern tropical North Pacific, Deep-Sea Res., 35, 1127–1142, 1988.
Xing, L., Zhang, Z., Liu, C., Wu, Z., and Lin, C.: Amperometric detection of nitric oxide with microsensor in the medium of sea- water and its applications, Sensors, 5, 537–545, 2005.
Yoshinari, T.: Nitrite and nitrous oxide production by Methylosinus trichosporium, Can. J. Microbiol., 31, 139–144, 1985.
Zacharia, I. G. and Deen, W. M.: Diffusivity and solubility of ni- tric oxide in water and saline, Ann. Biomed. Eng., 33, 214–222, 2005.
Zafiriou, O. C. and McFarland, M.: Determination of trace levels of nitric oxide in aqueous solution, Anal. Chem., 52, 1662–1667, 1980.
Zafiriou, O. C. and True, M. B.: Nitrite photolysis in seawater by sunlight, Mar. Chem., 8, 9–32, 1979.
Zhang, Z., Xing, L., Jiang, L., Wang, Y., Ren, C., and Cai, W.: The electrochemical detremination of nitric oxide in seawater media with microelectrodes, Sensors, 3, 304–313, 2003.
Zumft, W. G.: Cell biology and molecular basis of denitrification, Microbiol. Mol. Biol. R., 61, 533–616, 1997.