KüJpmann et al.: Comparison of reference method values with method dependent assigned values 865 J. Clin. Chem. Clin. Biochem.
Vol. 23, 1985, pp. 865-874
A Comparison of Reference Method Values for Sodium, Potassium and Chloride with Method-Dependent Assigned Values 1 )
By W. R. Külpmann, J. Lagemann, R. Sander and P. Maibaum
Institut für Klinische Chemie I (Geschäftsf. Direktor: Prof. Dr. Dr. J. Büttner) Medizinische Hochschule Hannover
(Received March 18/October 11, 1985)
In honour of Prof. Dr. A. Delbrück on t he occasion ofhis sixtieth birthday
Summary: The concentrations of sodium, potassium, and Chloride in various control sera were determined
by reference methods. The reference method values were comparöd with the corresponding method-dependent assigned values.
Sodium: Measurements by flame photometry and ion selective electrodes differed on the whole by less than 1% from the reference method value; determinations by photometry differed, however, by —4.7%.
Potassium: The mean bias was —1.2% with flame photometry and —0.4% with ion selective electrodes, whereas nephelometric procedures differed by — 1.9 or —4.8%.
Chloride: Satisfactory agreement was obtained with values given for ion selective electrodes (—0.3%), for some coülometric procedures (—0.7 and —0.4%), and photometric determinations using mercury rhodanide (—0.5 and + 0.7%). Values for mercurimetric titration and for photometric determinations using mercury 2,4,6-tri-(2-pyridyl)-s-triazine differed by + 2.5 and + 1.8%.
Propösals concerning the allowable deviation from reference method values are discussed.
Referenzmethodenwerte für Natrium, Kalium und Chlorid im Vergleich mit methodenabhängigen Sollwerten
Zusammenfassung: Mittels Referenzmethoden wurde die Konzentration von Natrium, Kalium und Chloridin zahlreichen Kontröllseren bestimmt. Die Referenzmethodenwerte wurden mit den entsprechenden metho- denabhängigen Sollwerten verglichen.
Natrium: Die Abweichungen betrugen bei Bestimmungen mittels Flammenphotometrie bzw. ionenselektiver Elektroden im Mittel weniger als 1%, bei photometrischen Verfahren jedoch —4,7%.
Kalium: Die Unterschiede beliefen sich bezüglich Flammenphotometrie auf durchschnittlich —1,2%, bezüg- lich ionenselektiver Elektroden auf -0,4%, bei nephelometrischen Verfahren auf -1,9 bzw. -4,8%.
Chlorid: Befriedigende Übereinstimmung fand sich mit den Angaben für ionenselektive Elektroden (—0,3%), für die Bestimmungen mittels Quecksilberrhodanid (zwischen -0,5 und + 0,7%) und bestimmten coulometri- schen Verfahren (—0,7 bzw. —0.4%). Größere Abweichungen ergaben sich für die mercurimetrische Titration (- 2,5%) und die Bestimmung mittels Quecksilber-2,4,6-tri-(2-pyridyl)-s-triazin (4- 1,8%).
Verschiedene Vorschläge für die Festlegung der zulässigen Abweichung des Meßwertes vom Referenzmetho- denwert'werden diskutiert.
*) Partly presented at the Joint Meeting of the European Committees for Standardüzation, München, lOth April 1984.
J. Clin. Chem. Clin. Biochem. / Vol. 23,1985 / No. 12
866
Külpmann cl al.: Comparison of rcfcrence method valucs with method dependent assigned valuesIntroduction
For many years one of the most important means of accuracy control in clinical chemistry has been the comparison of the invidual result obtained from the analysis of a control serum and the corresponding method-dependent assigned value. This design has only been partially successful for' the following reasons. For the determination of the same analyte many different methods are used. These methods are more or less modified when adapted to mechanized Systems. For each of these procedures a target value has to be established. The target values for the same analyte can differ widely and it is not known which value approaches most reliably the true value. For some time method-dependent assigned values have not been available for new methods. On the other hand target values have to be established for less reliable methods that are in widespread use. The replacement of these procedures by better and new techniques is not promoted by the actual design of accuracy control·. The new design is based upon the comparison of the individual results with the refer- ence method value. The reference method value is considered to be a reliable and most practicable ap- proach to the true value (1). The new design is equally applicable for all methods, even quite new ones, and their various modifications. The difference between the obtained result and the reference method value ought to be a reliable estimate of the bias between the routine and true values. It should lead to better interlaboratory comparability and more uniform ref- erence intervals. The extent to which method-depen- dent assigned values for sodium, potassium, and chloride differ from the reference method value was evaluated in this study. Proposals concerning the acceptable bias of determinations obtained by routine methods from those obtained by the reference method value are discussed.
Materials and Methods 1. Sodium
1.1. Control sera that were analysed by the reference method Fluinorm-N lot no. 621606 (Behringwerke, Marburg/Lahn), Kontrollogen-L lot no. 623119 (Behringwerke, Marburg/Lahn), Kontrollogen-L lot no. 623206 (Behringwerke, Marburg/Lahn), Labtroi E lot no. 58 I (AHSD, München), Monitrol I lot no.
178 (AHSD, München), Monitrol II E lot no. 68 (AHSD, München), Q-Pak I lot no. N 22 (Travenoi, München), Pa- thonorm L lot no. 16 (Nyegaard, Oslo, Norway), Pathotrol E lot no. 151 (AHSD, München), Serodos lot no. 4529 (Boehringer Ingelheim, Garching), Validate-A lot no. 2657051 (Gödecke, Berlin). Standard Reference Material SRM 909 (National Bureau of Standards, Washington, D. C., supplied by Winopal, Hannover), definitive value 134.1 mmol/1, and Seronorm lot no. 156 (Nyegaard, Oslo, Norway), definitive value 140.0 mmol/1 were used for accuracy control of the reference method.
l .2. Reference method values were established by flame pho- tometry according to 1. c. (2) which is described below in the extract from the detailed protocol. In addition to the following procedure a semiautomated pipetting alternative was evaluated with similar results by the laboratories that participated in the NBS-study. In both procedures, however, every Step of the method must be performed äs described. Otherwise the reliabil- ity of the reference method is no longer güafanteed.
1.2.1. Reagents ··
The distilled and/or deionized water used should exhibit a specific resistance of at least 0.01 · m at 23 ± 5 °C. Sodium Standard solution is obtained from Standard Reference Mate- rial SRM 919 (National Bureau of Standards (NBS), Washing- ton, D. C. supplied by Winopal, Hannover). Other reagents that are used for the determination must meet American Chemical Society (ACS) specifications (3).
1.2.2. Glassware
All Volumetrie glassware should be of borosilicate material and meet National Bureau of Standards (NBS) Class A (4) specifications.
1.2.3. Manual pipetting
Stock Solutions are diluted by employing only one 5 ml pipette with a washout technique, after 3 cycles of Operation for cpndi- tioning.
1.2.4. Instruments
In this study KLiNa (Beickman, München), an internal Standard Instrument, was used for flame photornetry. The protocol is not restricted to internal Standard Instruments. Non interrial Instruments raay be used äs well, if they meet the specifications.
Air and propane are needed äs oxidant and fuel, respectively.
Stability and repeatability of the Instrument have to be checked before each series of determinations, to ensure that they meet the requirements of the protocol.
1.2.5. Calibration curve
The calibration curve is constructed from the readings of the various sodium Standards after subtraction of the blank value using a least squares fit. Standard deviation of fit should be 1% orless.
1.2.6. Sample measürements
Sample measürements are perforraeo^ by the bracketing tech- nique. 5 valid sets of readings must be obtained to complete one measurernent. A set is considered valid if the emission intensities for the sample and the two Standards do not differ by more than 2 percent from any of the corresponding väiües in the previous Valid set. The concentration of an assay is calculated by mathematical Interpolation. The reference method value is the niean of four assays that are performed separately from four aliquots of the control serum. For the determination of one reference method valtie about 50 ml serum is needed.
1.3. Routine methods
Method-dependent assigned values refer to the following routine methods:
1. Flame photometry
2. Potentiometry by ion selective electrodes 3. Photoraetry (magnesium-uranylacetate)
2. Potassium
2.1. Control sera that were analysed by the reference method Fhiinorm N lot no. 621604 (ßehringwerke, Marburg/Lahn), Fluinorm P lot no. 1701 (Behringwerk&, Marburg/Lahn), Koii- trollogen-L lot no. 623110 (Behringwerke, Marburg/Lahn), Kontrollogen-LP lot no. 623204 (Behringwerke, Marburg/
Lahn), Labtroi E lot no. 58-8-30 (AHSD, München), Monitrol I E lot no. 164 (AHSD, München), Monitrol H E lot no. 64 (AHSD, München), Nörmosic lot np. 416-A-H (Asid, ün- J. Ciin. Chem. Clin. Biochem. / Vol. 23,1985 / Np. 12
Külpmann et al.: Comparison of reference method values with method dependent assigned values
867
terschleißheim), Pathotrol E lot no. 76 (AHSD, München), Precinorm U lot no. 1-562/2-562/3-562/4-562 (Travenol, München), RKP lot no. 406 A-H (Asid, Unterschleißheim), Validate-N lol no. 1000098 (Gödecke, Berlin). For accuracy control of the reference method the following were used: Stan- dard Reference Material SRM 909 (National Bureau of Stan- dards, Washington, D. C., supplied by Winopal, Hannover), definitive value 3.52 mmol/1, and Seronorm lot no. 156 (Nye- gaard, Oslo, Norway), definitive value 4.40 mmol/1.
2.2. The reference method for the determination of potassium in serum is based on flame photometry, and was performed äs described (1. c. (5)). For a better understanding an extract of the detailed protocol is given below. Besides the manual pipetting procedure that was used in this study a semiautomated pipetting alternative was evaluated with comparable results by the lab- oratories participating in the NBS-study. In every case both protocols have to be followed strictly to obtain the reliability äs declared.
2.2.1. Reagents Water: s. sodhim 1.2.1.
Potassium Standard Solutions are set up from Standard Refer- ence Material SRM 918 (National Bureau of Standards, Wash- ington, D. C., supplied by Winopal, Hannover). Other reagents must meet the specifications of the ACS (3).
2.2.2. Glassware s. sodiura 1.2.2.
2.2.3. Manual pipetting s. sodium 1.2.3.
2.2.4. Instruments s. sodium 1.2.4.
2.2.5. Calibrating curve s. sodium 1.2.5.
2.2.6. Sample measurements s. sodium 1.2.6.
2.3. Routine methods
Method-dependent assigned values were given for the following field methods äs declared in the package inserts of the control sera:
1. Flame photometry
2. Potentiometry by ion selective electrodes 3. Nephelometry (tetraphenylborate)
3. Chloride
3.1. The chloride concentration of the following control sera was determined by the reference method:
Duotrol lot no. 7280 (Bioined, München), Fluinonn-N lot no.
621606 (Behringwerke, Märburg/Lahn), Kontrollogen-L lot no.
623119 (Behringwerke, Marburg/Lahn), Kontrollogen-LP lot no. 623206 (Behringwerke, Marburg/Lahn), Labtrol lot no.
58 I (AHSD, München), Monitrol I E lot no. 169 (AHSD, München), Monitrol E lot no. 68 (AHSD, München), Pa- thonorm L lot no. 16 (Nyegaard, Oslo, Norway), Precilip lot no. 2^371 (Bpehringer Mannheim, tyiannheim), Precinorm U lot no. 09-561 (Bpehringer Mannheim, Mannheim), Q-Pak I lot no. N 22 (Travenol, München), Q-Pak II lot no. P 31 (Travenol, München), RKP lot no. 406 C (Asid, Unterschleißheim), RKS lot no. 41OC (Asid, Ünterschleißheim), Serodos lot no. 5530 (Boehringer Ingelheim, Garehing), Validate-A lot no. 2657051 (Gödecke, Berlin), Validate^N lot no. 2604051 (Gödecke, Ber- lin).
In every series of detefminations two control sera were used for the accuracy control of the reference method:
Standard Reference material 909 (NBS, Washington, D. C., supplied by Winopal, Hannover) definitive value 108.22 mmol/1 and Seronorm lot no. 150 (Nyegaard, Oslo, Norway), definitive value 107.7 mniol/L
3.2. Reference method values were established by coulometry according to 1. c. (6). The method is briefly described below in an extract from the detailed protocol. Besides the micropipet- ting procedure that was used in our study, a macropipetting alternative was evaluated by the laboratories that participated in the NBS-study with similar results. In both procedures, however, the protocol must be followed exactly. Otherwise the reference method values may be outside the specified limits.
3.2.1. Reagents Water: s. sodium 1.2.1.
Chloride Standard solution is set up from Standard Reference Material SRM 919 (NBS, Washington, D. C., supplied by Win- opal, Hannover). Other reagents that are used have to confirm to ACS specifications (3).
3.2.2. Glassware s. sodium 1.2.2.
3.2.3. Micropipetting
All micropipettes are admitted that meet the specifications.
They have to be used with a washout technique.
3.2.4. Instruments
For the determination of the chloride concentration in serum by the reference method a Chloride Meter EEL 920 (Corning, Halstead, Great Britain) was used by us. Other Instruments that confirm to the specifications of the protocol may be em- ployed äs well. Precision and accuracy of the measuring device is evaluated according to the specifications of the protocol.
3.2.5. Calibration curve
The calibration curve is obtained from the readings of the various chloride Standard Solutions using a least squares fit.
The Standard deviation of fit must not exceed l .3 mmol/1 in our study.
3.2.6. Sample measurements
For sample measurement the bracketing technique is used äs described in 1.2.6. (sodium). Instead of 5, only 3 valid sets are required. The chloride concentration of an assay is obtained by mathematical Interpolation. The reference method value is the mean of 4 assays of 4 different aliquots of the sample. For the determination of one reference method value about 25 ml serum is needed.
3.2.7. Routine methods
Method-dependent assigned values refer to field methods äs named by manufacturers of the control sera:
1. Coulometry
2. Potentiometry by ion selective electrodes 3. Mercuric thiocyanate-Fe3+
4. Mercurimetric titration/diphenylcarbazone 5. Mercury-TPTZ (Hg-2,4,6-tri-(2-pyridyl)-s-triazine)
4. Sodium, potassium, and chloride determinations in control sera and patients' samples by field methods in the same run were compared with the corresponding reference method values. In this study the following control sera were used: Control Serum N lot no. P 1039 (Hoffmann-La Röche, Grenzach-Wyhlen), Control Serum P lot no. P 2439 (Hoffmann-La Röche, Grenzach-Wyhlen), Monitrol I E lot no.
LTD 178 (AHSD, München), Seronorm lot no. 156 (Nyegaard, Oslo, Norway), Standard Reference Material (SRM) 909 (National Bureau of Standards, Washington, D. C., USA), Ref.
I: Technicon SMAC Reference I lot no. B 3 D 486 (Technicon, Tarrytown, USA), Ref. II: Technicon SMAC Reference I lot no. B 2 M 452 (Technicon, Tarrytown, USA), Calib. 1: Techn- icon TQC Chemistry Calibrator 2 lot no. B 3 F 497 (Technicon, Tarrytown, USA), Calib. 2: Technicon TQC Chemistry Calibra- tor 2 lot no. B 3 A 493 (Technicon, Tarrytown, USA), Validate A lot no. 3528074 (Gödecke, Berlin).
J. Clin. Chem. Clin. Biochem. / Vol. 23,1985 / No. 12
868
K lpmann et al.: Comparison of refcrencc method values with method dcpendent assigned values ResultsSodium
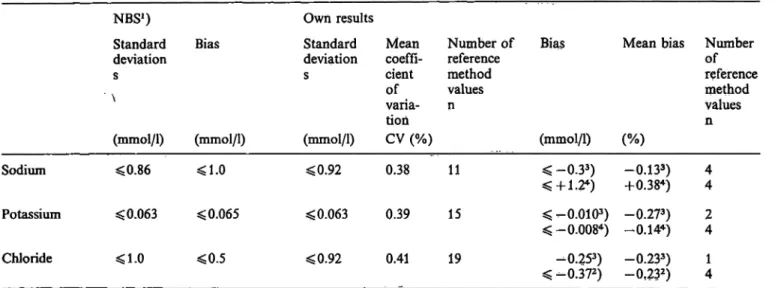
Precision and accuracy ofthe reference method Precision was calculated by use of the 4 results, from which the reference method value is derived. In the mean of the 11 control sera that were investigated the coefficient of Variation was 0.38% (tab. 1). The results of one control serum were excluded, because its concentration was beyond the measuring r nge of the reference method. The mean bias between refer- ence method value and definitive value was —0.13%
(SRM 909) and 0.38% (Seronorm lot no. 156) respec- tively.
Comparison of reference method value and method- dependent assigned value
The sodium concentration of 12 control sera was determined by the reference method. The correspond- ing method-dependent assigned values were lower by —0.89% in the case of flame
ratomic emission spectroscopy (flg. 1). Without predilution, the target values of the samples differed by + 0.98% for ioii selective electrodes. With predilution, the difference was + 0.34% (fig. 2). The assigned values for photo- metric determinations had a mean bias of —4.69%.
The difference was most prono nced in the upper concentration r nge (fig. 3).
Tab. 1. Precision and accuracy ofthe reference methods for the determination of sodium, potassium, and chloride in serum.
NBS1) Own results
Standard Bias Standard Mean Number of Bias deviation deviation coeffi- reference
s s cient method of values varia- n tion
(mmol/1) (mmol/1) (mmol/1) CV (%) (mmol/1) Sodium <0.86 <1.0 <0.92 0.38
Potassium *£ 0.063 < 0.065 < 0.063 0.39 Chloride ^1.0 <0.5 <0.92 0.41
l) Re
2) Co
3) Co
4) Co
1-
^S Π-
α CD
-3- Fig.l
r^-.
C.O
σ
^1-
15 ^-O.OIO3
^-0.0084
19 -0.253)
Mean bias Number referenceof method Values n (%)
-0.133) 4 +0.384) 4 ) -0.273) 2 ) -0.144) 4 -0.233) 1 -0¥232) 4 sults obtained by the participants of the National Bureau of Standards study (1. c. (2, 5, 6))
ntrol serum: Seronorm lot no. 150
ntrol serum: Standard Reference Material SRJM 909 ntrol serum: Seronorm lot no. 156
Sodium [mmol/l]
Sodium [mmol/ll ' n1 1 0 117 . 124 ™ _ 138 145 152 161Reference 110 117 124 1-
n=2 n=1 n =2 . Sodium: Flame p
Mean deviation value from the re
n=1 n=2 r-r-
1 138 U5 152 161 Reference _ , _ method value
-2- n=4 n=1 n=1 n=1 S -4- .2 ς-c hotometry § "
of the method-dependent assigned Jj"6~ iference method value in %. ° -7_ -8-
n=1 - g_
1
^ * * Reference ' method value
117 124 131 138 145 152 161 Fig. 3.
Sodium [mmol/l]
n = 1 n=1 n=2 n=1 n=1 -* , .
117 124 1
Fig. 2.
j 1 · Reference 1 [^ | | | method value 31 138 145 152- 161
n=1 n=1 n=2 n=2 n=1 Sodium: Photometry Mean deviation of the nu value from the reference met
method value
n=1 η=.Ί
ithod-dependent assigned hod value in %.
Sodium: Ion selective electrode a) without predilution of the sample b) with predilution of the sample
Mean deviation f the method-dependent assigned value from the reference method value in %.
Sodium [mmol/l] * no data J
J. Clin. Chem. Clin. Biochem. / Vol. 23,1985 / No. 12
Külpmann et al.: Coraparison of reference method values with method dependent assigned vahies
869 Potassium
Precision and accuracy of the reference method The mean coefficient of Variation of the 4 results that yield the reference method value was 0.39% (n = 15) (tab. 1). The mean bias of the reference method from the definitive value was -0.27% (n = 2; SRM 909) and -0.14% (n = 4; Seronorm 156).
Comparison of reference method value and method- dependent assigned value
The potassium concentration of 13 control sera was determined by the reference method. The target va- lues for routine flame photometry were —1.24%
lower than the reference method values (fig. 4). The mean bias of values assigned to ion selective electro- des without predilution of the sample was —0.4%
(fig. 5). In the case of ion selective electrodes with predilution of the sample the differences were —0.4,
— 0.7, and —6.6% (fig. 5). Nephelometric determina- tions differed by —1.9 and —4.8%, respectively. The bias was most pronounced in the upper measuring ränge (fig. 6).
3.2 3.8
Potassium [mmol/l]
4.4 5.0 5.6
method value
-4- n=2 n=2 n=2 n=2 n=2 n=2 n=1 Fig. 4. Potassium: Flame photometry
Mean deviatiöri of the method-dependent assigned value from the reference method value in %.
-4-
-6- -7-
3.2 3.8
Potassium i mmol/l]
4.4 5.0 516 6.2 6;£ Reference method value
n=1 n:=1 n =<1 n=2 n=1 Fig. 5. Potassium: Ion selective electrode
Mean deviation of the method-dependent assigned value from the reference method value in %.
open columns: with predilution of the sample closed cohimns: without predilution of the sample
* no data
Chloride
Precision and accuracy of the reference method Precision was derived from the 4 values that consti- tute the reference method value. The mean coefficient of Variation was 0.41% (n = 19). The reference method value differed by -0.23% from the definitive value äs declared for SRM 909 (n = 1) and Seronorm
150 (n = 4).
Comparison of reference method value and method- dependent assigned value
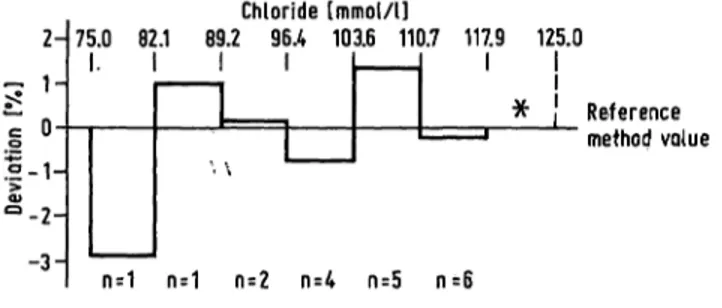
The Chloride concentration of 18 control sera was determined by the reference method. Compared with the reference method value the target values for routine coulometric determinations were 2.3% lower in the mean (fig. 7); in the case of special Instruments the bias was less: -0.7% (EEL 920: Corning, Halstead, Great Britain), -0.4% (Astra: Beckman, München). Target values for ion selective electrodes differed by —0.3%. Photometric determinations by mercury thiocyanate/Fe
3+had a bias of —0.5%
(ACA: Du Pont de Nemours, Bad Nauheim), -0.3%
(AAII: Technicon, Bad Vilbel), -0.2% (SMA:
Technicon, Bad Vilbel), and + 0.7% (SMAC: Techni- con, Bad Vilbel) that was not concentration-depen- dent (fig. 8). Greater discrepancies were observed with values assigned for mercurimetric titration ( + 2.5%) (fig. 9). In the case of determinations by mer- cury 2,4,6-tri-(2-pyridyl)-s-triazine, results have to be expected that are 1.8% higher than the reference method value.
Potassium [mmol/l]
-1- -2- g-3- 1-4-
-6- -7- -8-
3.2 3.8 4.4 5.
_ t
0 5 6 6
-. «* _. ·»
2 6.
« ·»
} 7;4 Reference l method volue
*!
«. ·>
Fig. 6. Potassium: Nephelometry
Mean deviation of the method-dependent assigned value from the reference method value in %.
* no data
J. Clin. Chcm, Clin. Biochem. / Vol. 23,1985 / No. 12
870
Külpmann et al.: Comparison of reference method values with method dependent assigned valuesChloride [mmo!/l]
-1-
-5- -6-
f "
n=2 n=1 n--6 n=4 n=A
*" ' , Reference method value
* !
Fig. 7. Chloride: Coulometry
Mean deviation of the method-dependent assigned value from the reference method value in %.
* no data
Chloride [mmol/l]
2- -7 1-
«£
*"" n .2. -1-
0)
«t
75.0 2.1 89.2 96.4 103.6 110.7 117.9 125.0
| |
1 1
··, \
| (
1
#· | Reference
* ' method value
n=1 n=1 n=2 n=4 n=5 n=6
Fig. 8. Chloride: Mercury thiocyanate-Fe3+ (SMA/SMAC+) Mean deviation of the method-dependent assigned value from the reference method value in %.
* no data
+ SMA/SMAC: Technicon, Bad Vilbel
7-
.s
3 -
n=1 n=2 n=6 n=1 n=4
# * ,
1! Reference Chloride [mmol/l]
Fig. 9. Mercurimetric titration
Mean deviation of the method-dependent assigned value from the reference method vaiue in %.
* no data
Allowable ränge of deviation
The allowable ränge of deviation appreciates the ob- served bias with respect to the analytical precision or the clinical implications. Hence there are different possibilities for the calculation of the allowable ränge of deviation:
1. Analytical precision
1.1. It is well known from the evaluation of external quality assessment schemes how precisely an analyte can be determined by routine methods. Coefficients of Variation have beeil piiblished that are used for the scores of the National External Quality Assessment Scheme (Wolfson Research Lab., Bihningham, Great Britain). Allowable raiiges of deviation may be derived from these data. This desigri disregards special properties of ä control serum that have an impact on precision.
1.2. Every lot of a control serum is analysed by an especially reliable routine method (selected method) to obtain the imprecision between days. It may be used for the calculation pf the acceptable ränge of deviation for all routine methods and takes iiitö ac- coünt to a certain degree special properties of a control serum.
2. Clinical implications
Clinical implications are dependent on the biological variance (s
b). Analytical variance (s
a) must be small compared with the biological variance (e. g.— ^2),
s
aso that a clinically important change of an analyte concentration becomes apparent äs soon äs possible.
In the case of unknown biological variance the Stan- dard deviation between days (s^) corresponds to the equation (1. c. (1))
reference interval
Proposals ön how to confine the allowable ränge of deviation are presented in figures 10 — 12: The mean deviation of all target values of a routine method from the reference method value is related to a hypo- thetical reference method value. The confidence ränge of the control sera äs declared by the manufactürers is adopted to the calculated method-dependent assigned values. The confidence ränge of the reference method values is taken from the Statements of the NBS- protocols (I.e. (2, 5, 6)) and iiicludes: reference method value + 2 · s (s: maximum Standard deviation when performing the reference method). In internal quality assessment an allowable ränge of deviation for routine analyses may be: reference method value + 2 - Standard deviation (Standard deviation accord- ing to l. or 2.). For external quality assessment one may propose: reference method value ± 3 · Standard deviation (Standard deviation according to 1. or 2.).
Actually a bias of 10% with regard to the method- dependent assigned value is allowable äccprding tö the guidelines of the German authorities (Bimdesärz- tekammer).
J. Clin. Chem. Clin. Biochem. / Vol. 23,1985 / No. 12
K lpmann et al: Comparison of .reference method values with method dependent assigned values 871
J ι ι
120 125 130 1·
1
hH
u
l 5 1/
WΙ ι
»0 1
,Γ3
45 150 Ι
Sodium [mmol/l] 155
Fig. 10. Sodium: Reference method value, method-dependent assigned value and their 95% confidence ranges.
h-Q—l reference method value and 95% confidence r nge according to 1. c. (2)
|—X—| calculated method-dependent assigned value and 95% confidence r nge s declared by the manufac- turers
Δ to Δ: possible deviation of the reference method value froni the definitive value according to 1. c. (2).
Γ! to TJ: reference method value ± 10%
r2 to r2: reference method value ± 2sa;
sa- is deduced from the coefficient of Variation (CV) of the UK External Quality Assessment Scheme (CV = 1.6%) (I.e. (11))
r3 to r3: reference method value ± 2sm; reference interval
S- = 8 1. Flame photometry 2. Ion selective electrode
3. Photometry (Mg-Uranylacetate)
Sodium: Only a small bias was observed between the values assigned for routine flame photometry, ion selective electrodes and the reference method value.
The confidence ranges scarcely exceed the allowable r nge. In "photometry", however, a great bias was observed, together with unsatisfactory precision.
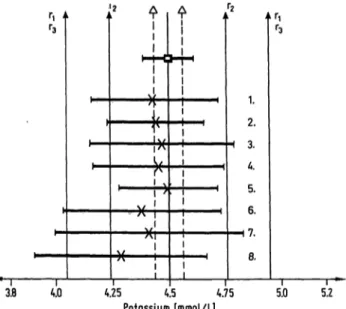
Potassium: The allowable ranges of deviation are strongly violated by the values for nephelometry. The unfavQurable result for "SMAC" is due to one out of three target values.
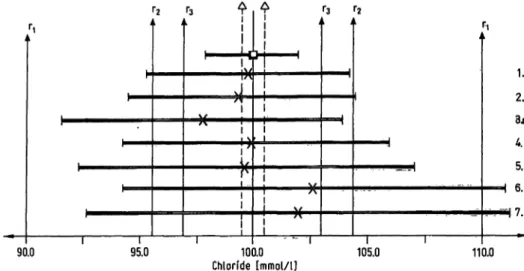
Chloride: The normalized confidence r nge for deter- minations by ion selective electrodes, SMA-SMAC and some coulpmetric procedures agreed well with the allowable r nge of deviation. Values assigned for mercurimetric titration and mercury 2,4,6-tri-(2- pyridyl)-s-triazme greatly exceeded the limits.
Patients' sarnples
Results were investigated to see whether serum from patients showed the saine bias s control sera in relation to the reference method value. Control sera
ΓΙ
1
Γ3
.
|
2 ΐ
Ht-C
] !
Ι .
Ν/ 'ι
|
Λι i
|
ι ι
h t
Λ
ΓΙ
Γ3
3.Θ
Fig. 11.
4.0 4.25 4.5 4.75
Potassium [mmol/l] 5.0 5.2 Potassium: Reference method value, method-depen- dent assigned value and their 95% confidence ranges.
| — D — | reference method value and 95% confidence r nge according to 1. c. (5)
| — X — | calculated method-dependent assigned value and 95% confidence r nge s declared by the manufac- turers
Δ %to Δ: possible deviation of the reference method value from the definitive value according to 1. c. (5) Γ! to rr: reference method value ±10%
r2 to r2: reference method value ± 2sa;
sa is deduced from the coefficient of Variation (CV) of the UK External Quality Assessment Scheme (CV = 2.9%) (I.e. (11))
r3 to r3: reference method value ± 2sm; reference interval
1. Flame photpmetry (internal Standard: Li) 2. Flame photometry
3. Flame photometry (Eppendorf, Hamburg) (internal Standard: Li)
4. Flame photometry (Autoanalyzer II, Technicon, Bad Vilbel; etc)
5. Ion selective electrode (NOVA Biomedical, Darrn- stadt; etc)
6. Ion selective electrode (SMAC, Technicon, Bad Vil- bel)
* 7. Nephelometry (tetraphenylborate Ingotest, Boehringer Ingelheim, Garching)
8. Nephelometry (tetraphenylborate)
and samples of pooled sera from patients were ana- lysed by routine methods in the same series. The results were compared with the corresponding refer- ence method values (tab. 2). The bias between the reference method value and the results obtained by routine methods was similar for control sera and native serum. The values for sodium and potassium in samples from patients showed a greater difference, while the values for Chloride showed less difference, when compared with the control sera. It was con- cluded that reference method values of control sera for sodium, potassium, and Chloride are adequate for accuracy control of these analytes in samples from patients.
J. Clin. Chem. Clin. Biochern. / Vol. 23,1985 / No. 12
872
K lpmann et al.: Comparison of reference melhod valucs with method dopenden t assigned valuesr2 r3 $ $ r3 r.
ΓΙ ' Ι
Η
ιΙ
Ι ' J
v j
ι
!
!
Γ
\ι ιΙ
ι ι ι
ιΙ '
_Μ 1
Π '
ι ι
ι " * Ι Ι Ι
,
11.
2.
a»
5
90.0 95.0 100.0 105.0 110.0 Chloride [mmol/l]
Fig. 12. Chloride: Reference method value, method-dependent assigned value and their 95% confidence ranges.
l—C—| reference method value and 95% confidenee r nge according to 1. c. (6)
l—X—( calculated method-dependent assigned value and 95% confidenee r nge s declared by the manufacturers Δ to Δ: possible deviation of the reference method value from the definitive value according to 1. c. (6)
TJ to rt: reference method value + 10%
r2 to r2: reference method value + 2sa; sa is deduced from the coefficient of Variation (CV) of the UK External Quality Assessment Scheme (CV = 2.2%) (1. c. (11))
r , , . , _ reference interval r3 to r3: reference method value ± 2sm; sm =
1. Ion selective electrode 8
2. Coulometry: EEL 920 (Corning, Halstead, Great Britain), Astra (Beckman, M nchen) 3. Coulometry
4. Mercuric thiocyanate-Fe3+: SMA/SMAC (Technicon, Bad Vilbel)
5. Mercdric thiocyanate-Fe3+: ACA (Du Pont, Bad Nauheim), Autoanalyzer II (Technicon, Bad Vilbel) 6. Mercurimetric titration
7. Mercury 2,4,6-tri-(2-pyridyl)-s-triazine
'ab. 2. A comparison of the results from fieid methods and reference methods applied to control sera and native sera of patients. Mean deviation from the reference method value.
Seronorm7) Control S. Control S. Ref. I7) Calib. l7) Pat. pool l Pat. p ol 2 Pat. pool 3
N7) P7)
JMA-C2) U?M 505l3) CliNa4)
+ 1.4(3;
+ 1.1 (5;
-0.9 (5;
0.0)0.6) 0.3) + 1
+ 1.8 (20; 0.4)
.0 (7; 0.4) -0.1 (10;
-0.8 (10;
Sodium
+ 1.01) +0.81) 0.2)0.4)
+ 1.2 + 1.9 -0.3
(5; (3;
(3;
0.0)0.6) 0.3)
+ 1.3 (3; 0.4) + 2.5 (5; 0.3) +0.7 (3; 0.6)
+ 1.8 (3; 0.4) + 3.1 (5; 0.1) + 1.2 (3; 0.3)
SMA-C2)
\FM 505l3) KLiNa4)
-0.6 (3; 1.3)
-2.6(5:0.7) 4-0.8 (20; 0.6)
-2.6 (5; 0.7) -0.4 (7; 0.4) + 1.1 (10; 0.3) -1.1 (10; 0.5)
Potassiwn
-1.01) -O.l1) -1.1 (3; 0.0) -0.2 (3; 0.0) -0.8 (3; 0.0) -^-2.4 (5; 0.2) -2.9 (5; 0.5) -2.6 (5; 0.2) -1.1 (3; 0.3) -0.7 (3; 0.6) +0.4 (3; 0,8)
SMA-C2) EEL 9205) Cl-meter 661 06)
SRM 9097) + 2.2 (5; 0.4) H- 1.5 (5; 0.6) + 0.6 (5; 0.2)
Monitrol IE7) + 3.4 + 3.0 + 0.4
(5; 0.4) (5; 0.7) (5; 0.2)
Validate-A7) + 1.9 + 2.3 + 0.3
(5; 0.5) (5; 0.6) (5; 0.2)
Chloride Ref. II7) -O.l1) + 1.3(5;
+ 1.3(5;0.5) 0.1)
Calib. 27) + 0.71) + 1.7(5; 1.0) + 1.3 (5; 0.2)
Pat. pool 1 + 1.5 (5; 0.8) +0.2 (5; 0.5) +0.8 (5; 0.2)
Pat. pool 2 +0.9 (5; 0.4) +0.8 (5; 1.4) +0.1 (5; 0.2)
Pat. pool 3 + 1.4 (5; 0.4) + 1.8 (5; 0.4) +0.7 (5; 0.2) In 0: l· Number of determinations, 2. Coefficient of Variation (precision in the contributing series)
J) Deviation related to the calibration value used
2) SMA-C (Technicon, Bad Vilbel)
3) Flame photometer AFM 5051 (Eppendorf, Hamburg)
4) Flame photometer KLiNa (Beckman, M nchen)
5) Chloride meter EEL 920 (Corning, Halstead, Great Britain)
6) Chloride meter 6610 (Eppendorf, Hamburg)
7) s. Materials and Methods
J. Clin. Chem, Clin, Biochem. / Vol. 23,1985 / No. 12
Külpmann et al.: Comparison of reference method values with mcthod dependent assigncd valucs
873
Discussion
The reference methods for the determination of so- dium, potassium, and Chloride are easily established, although they are rather tedious and time consuming.
The bracketing technique for the computation of the concentration of an unknown sample is unpractical when the concentration of the sample is very similar to the adjacent calibrator concentration, especially if it is the lowest or highest. Intervial variability has to be looked for thoroughly. In the case of the electroly- tes it may be minimized by control of the weight of the freeze-dried serum. On the other hand one may claim an adequate agreement between the 4 single values from which the reference method value is calculated. On the whole there was a satisfactory agreement between the reference method value and the target values for the most widely used routine methods. As compared to the method-dependent as- signed value, the reference method value has the following advantages: According to the hierarchy of methods the reference method value is more reliable.
Reliability is achieved by the use of calibration mate- rial of highest purity, a very detailed method protocol that encompasses especially precise methods of pipet- ting and measuring techniques, and validation of the result by several criteria that control analytical Steps and the whole analysis. Therefore the reference method value appears to be somewhat less dependent on the actual reliability of the used method than the method-dependent assigned value. The reference method value pennits evaluation of methods with objectivity (7). It will improve the accuracy (8) of routine methods and thus the interlaboratory com- parability. This aim is achieved without any restric- tion of further developinent or obligatory use of standardized methods of unknown accuracy. Some disadvantages of the new design of accuracy control, however, have to be taken into consideration:
1. Reference method values have to be established additionally to routine workload by rather time con- suining methods.
2. Reference methods are confmed to a measuring raftge that is usually smaller than the ränge of field
methods (e. g. sodium: 110—160 mmol/1, potassium:
1.3-7.3 mmol/1, chloride: 79-117 mmol/1).
3. Reference methods are published only for a limited number of analytes. The methods are restricted to serum analyses, and urine is excluded.
4. Allowable limits of deviation have to be estab- lished by additional analyses, if they are not otherwise defined.
Our results agree well with a study of Gilben (9), who compared values obtained by routine methods with definitive values. One may conclude that the reference method value is a reliable substitute for the definitive value. The determinations by definitive methods, however, require special Instruments (e. g.
mass spectrometer) that are available only to a very limited extent, whereas reference methods are per- formed by Instruments common to the routine clinical chemistry laboratory.
The control sera are of special importance in accuracy control. Their characteristics must be very similar to patients' samples in order to guarantee that results obtained by analysis of control sera are equally valid for native materials. In the case of the electrolytes, sodium, potassium and chloride, the bias was similar and independent of the source of the analysed mate- rial. Differences were obtained with respect to other analytes (10). If the bias is restricted to individual control sera, it may be due to differing specificity of the methods. The reference method, too, may be susceptible to interference (e. g. bromide interferes with the reference method for the determination of chloride).
The acceptable ränge of deviation may be defined independently of analytical precision according to clinical implications e. g. by use of the biological variance. In this case analytical reliability is directly orientated to its actual purpose. Routine methods must be improved to meet the clinical requirements, and methods that do not meet these requirements become self-evident. If the acceptable ränge of devia- tion is deduced from the presently available analytical precision, methods may be further used that are not suitable äs a reliable means of patients' care.
References
1. Stamm, D. (1982) J. Clin. Chem. Clin. Biochem. 20, 817-824.
2. Velapoldi, R. A., Paule, R. C, Schaffer, R., Mandel, J. &
Moody, J. R. (1978) NBS Special Publication 260-60.
3. Anonymous: R,eagent Chemicals, American Chemical Society specifications ACS publications, Washington, D. C.
(1968).
4. Hughesi J. C. (1959) NBS Circular 602.
5. Velapoldi, R. A., Paule, R. C., Schaffer, R., Mandel, J., Machlan, J. L. & Grämlich, J. W. (1979) NBS Special Pub- lications 260-63.
6. Velapoldi, R. A., Paule, R. C., Schaffer, R., Mandel, J., Murphy, T. J. & Grämlich, J. W. (1979) NBS Special Public- ation 260-67.
J. Clin. Chem. Clin. Biochem. / Vol. 23,1985 / No. 12
874 Külpmann et al.: Comparison of reference method values with method dependent assigned vahies 7. Tietz, N. W. (1979) Clin. Chem. 25, 833-839. 10. Van Helden, W. C. H., Visser, R. W. J., Van den Bergh, 8. Büttner, J., Borth, R., Boutwell, J. H., Broughton, F. A.J.-T. M. & Souverijn, J. H. M. (1979) Clin. Chim.
P. M. G. & Bowyer, R. C. (1980) J. Clin. Chem. Clin. Bio- Acta 93, 335-347.
ehem. 18, 69-77. 11. U. K. External Quality Assessment Scheme, Wolfson Re- 9. Gilbert, R. K. (1978) Am. J. Clin. Pathol. 70, 450-470 search Labs., Queen Elizabeth Medical Centre, Birmingr
(Suppl.). harn. Distribution No. 280 (31.12. 84).
Prof. Dr. W. R. Külpmann Institut für Klinische Cheiriii I Medizinische Hochschule Hannover Konstanty-Gutschow-Straße 8 D-3000 Hannover 61
J. Clin. Chem. Clin. Biochem. / Vol. 23,1985 / No. 12