J. Clin. Chem. Clin. Biochem.
Vol. 28, 1990, pp. 817-824
© 1990 Walter de Gruyter & Co.
Berlin · New York
A Candidate Reference Method for Coupled Sodium-Water Determination in Human Serum
By J. D. E. van Suijlen, C. A. Berrevoets and B. Leijnse
Department of Clinical Chemistry, Academic Hospital Dijkzigt, Rotterdam, The Netherlands (Received February 26/July 6, 1990)
Summary: A candidate reference method is described for coupled sodium-water determination based on ion-
exchange sodium separation from the serum matrix followed by gravimetry as Na
2SO
4, and serum water determination by means of microwave evaporation. For sera with normal sodium and water contents, the mean relative standard deviation is 0.6% (0.8mmol/l). Mean inaccuracy for the coupled sodium-water determination is —0.3% (0.4 mmol/1). The candidate reference method can be considered a reference method because the reference method value did not differ significantly from the definitive value, there is no known source for interferences or bias, and misinterpretation due to abnormal protein or lipid levels is excluded because serum sodium is determined on a plasma water basis. Sodium concentrations determined by the candidate reference method are used for comparing field methods with the candidate reference method. If the resulting regression equation is used in the calibration procedure, good correlation between all (in)direct field methods and the candidate reference method is ensured, and accurate results are produced. Results of proficiency testing show a good correlation between (in)direct field methods and the candidate reference method, because sera with approximately normal water contents are used.
Introduction
In clinical chemistry, the sodium concentration in serum is determined by flame atomic emission spec- trometry (FAES) or (in)direct ion-selective electrode analysers (ISEs). In direct ISE methods the activity of free sodium ions in serum water is determined, whereas in traditional FAES methodology and indi- rect ISE measurement the total sodium concentration in serum after dilution of the sample is measured (1).
In all but direct ISE measurement, assay values are sensitive to the serum volume occupied by proteins and lipids. This sensitivity may lead to misinterpre- tation of electrolyte status (pseudohyponatraemia) (2, 3) if serum samples with abnormal protein and/or lipid concentrations are determined. Hence it is stated that the interpretation of sample data should be based on measurement of sodium activity (direct ISE) which is insensitive to the serum volume diplaced by dis- persed or dissolved solids (1,4). Experience with direct
ISE analysers has shown that the results obtained on one sample may differ significantly from one instru- ment to another (5, 6). These differences caused by broad variation in instrument design and calibration solutions make comparison of data very difficult, so that direct ISE is not suitable as an accuracy base (reference method) for sodium measurement. Since confusion also exists concerning the quantity to be reported by direct ISEs (activity or concentration), the European Working Group on ISEs (EWGISE) of the IFCC Expert Panel on pH, Blood Gases and Electrolytes, has proposed that all instruments should report results of sodium measurement as concentra- tions (mmol/1 plasma) that agree with those obtained by FAES measurement in normal plasma samples (7).
To date, instrument manufacturers produce direct ISE
analysers which mathematically convert sodium ac-
tivity into sodium concentration with theoretically the
same numerical value as that obtained by FAES meas-
urement, for the analysis of normal serum (4).
However, flame photometers (even if internal stan- dard instruments are used) are subject to inherent bias from e. g. flame temperature, viscosity, surface tension and matrix effects. In order to exclude possible mis- interpretation, data should also be expressed on a plasma-water basis (8).
We describe the development of a candidate reference method for coupled sodium-water determination based on ion-exchange sodium separation from the serum matrix followed by gravimetry as Na
2SO
4, and serum water determination by means of microwave evaporation. The procedure is based on a modifica- tion of the The National Institute of Standards and Technology (NIST, formerly NBS) definitive method for the determination of sodium in serum (9) and an improved version of a new water determination de- veloped in our laboratory (10).
Finally, we used this method to evaluate the accuracy of field methods in use in our clinical chemistry lab- oratory and to study the accuracy of consensus values in proficiency testing.
No. 92 A/B;
No. 93 A/B;
No. 94 A/B;
No. 95 A/B;
No. 96 A/B;
No. 97 A/B;
No. 98 A/B;
No. 99 A/B;
05-04-88: Boehringer Mannheim Precinorm/path, 06-06-88: Seronorm 179/Pathonorm H-22, 15-09-88: Autonorm 2362/2361,
10-10-88: Technicon Testpoint 1/2, 05-12-88: Fisher Serachem,
30-01-89: Seronorm (human)/Lyotrol N-X, 03-04-89: Precinorm/Precipath and 29-05-89: R. I. V. M. (human).
1.5 Ion-exchange resin and Chromatographie columns
AG 50W-X8, 100-200 mesh, a strongly acidic cation exchange resin, and econo-columns, 1.0 χ 30.0 cm, were obtained from Βίο-Rad Laboratories, Richmond/CA, USA.
1.6 Routine sodium analysers
Flame atomic emission spectrometry: IL 943, Instrumentation Laboratory (Benelux), Ysselstein, the Netherlands.
Indirect ion-selective electrode analysers: RA1000 and CHEM 1, Technicon, Tarrytown/NY, USA.
Direct potentiometric electrode analysers: ACA III, Dupont de Nemours, Wilmington/DE, USA and Corning 614, Ciba Corn- ing Diagnostics, Halstead/Essex, U. K.
All instruments were calibrated and used according to the manufacturers' instructions.
Materials and Methods 1. Materials
1.1 Water
Twice distilled water with a specific resistance > 10 kQ-m at 25 °C was used.
1.2 Reagents
Sodium, potassium, lithium standard solutions: standard so- lutions were prepared from Standard Reference Materials So- dium Chloride (SRM 919), Potassium Chloride (SRM 918) and Lithium Carbonate (SRM 924), National Institute of Standards and Technology (NIST), Washington, D. C., USA. The SRMs were dried by heating at 110 °C for four hours and stored in a desiccator for 1 hour before use.
Hydrochloric acid 8.2 mol/1, "suprapur", max. 0.5 parts per million (mg/kg) sodium, sulphuric acid 9.8 mol/1, "suprapur", max. 0.1 mg/kg sodium, nitric acid 10.3 mol/1, "suprapur", max. 0.1 mg/kg sodium, and boric acid "suprapur" were ob- tained from Merck, Darmstadt, FRG.
All other reagents were of analytical grade.
1.3 Accuracy assessment
Standard Reference Material 909 (SRM 909), human serum, was obtained from the National Institute of Standards and Technology, Washington, D. C., USA.
Lyophilysed horse serum for clinical chemical use (RIVM high component concentrations), was obtained from the Dutch Na- tional Institute for Public Health (RIVM), Bilthoven, the Neth- erlands.
1.4 Control sera from the Dutch Quality Assessment Foundation (SKZL), Nijmegen, the Netherlands
No. 90 A/B; 14-12-87: Nycomed Autonorm 2244/2280, No. 91 A/B; 01-02-88: Biotrol,
1.7 Microwave oven
Philips AVM. Cooktronic 706/PH, 1.3 kw, 2450 MHz, Philips, the Netherlands.
1.8 Containers
All volumetric glassware was of borosilicate material, conform- ing to class A specifications. Teflon beakers used were from TPX Azlon, Labplex, U. K. (50 and 250 ml beakers were used).
1.9 Balance
Sartorius 2462 analytical balance (d = 0.1 mg), G ttingen, FRG.
2. Methods
2.1 Cleaning of the containers
All containers were soaked for 60 min in 0.75 mol/1 nitric acid and afterwards rinsed 5 times with twice distilled water. The containers were dried at room temperature and used immedi- ately after drying.
2.2 Sampling
To minimize sampling errors, standard and serum samples were weighed. Aliquots were converted from weight to volume, using the density of each standard or serum sample, measured with a pycnometer (5.00 ml).
2.3 Weighing procedure
All standards and samples were weighed until constant weight:
maximal allowed weight difference between two subsequent weighings 0.0005 g. Usually two subsequent weighings were sufficient to achieve constant weight.
2A Sodium determination a) Ion-exchange separation
— Approximately 8 ml of sample is weighed into a teflon beaker (50 ml) and diluted with distilled water to about 25ml.
— The sample is loaded onto the column using a peristaltic pump and teflon tubing. For complete transfer, the teflon beaker is washed with 25 ml distilled water, the washing solution is completely transferred onto the column. This washing procedure is repeated twice, so that 100 ml distilled water is used for complete transfer and for washing non- ionogenic matter from each column.
— Elution is started with 0.4 mol/1 HC1, flow 60 ml/h. Fraction collection is started after detection of the first acidic effluent.
— Fractions 0 — 75 ml (fraction A) and 75 — 255 ml (fraction B) are collected in 250 ml teflon beakers.
— The resin is regenerated with 100 ml 5 mol/1 HC1 and washed with 75 ml distilled water.
— Fractions A and B are evaporated on a hot plate to about 10 ml (8-12 hours at 100 °C).
— Fraction A is examined by FAES to determine the presence of sodium. If present, the determination is rejected.
b) Gravimetric determination
— A platinum crucible (with cover) is heated for 15 min at 700 °C and weighed after 15 min cooling in a desiccator.
This procedure is repeated until constant weight is achieved.
— The concentrated fraction B is transferred quantitatively to the previously weighed crucible.
— 1 ml sulphuric acid (1 mol/1) is added (via the crucible wall) and the sample is evaporated on a hot plate. After cooling for 15 min in a desiccator, this procedure is repeated twice;
the last time the crucible is partly covered with the platinum lid.
— The crucible (covered with lid) is slowly heated from 400 — 700 °C, and held at 700 °C for 15 min.
— After cooling for 15 min in a desiccator, 1 ml ammonium carbonate (15.8%) is added (via crucible wall) and slowly evaporated to dryness on a hot plate.
— The sample is again heated for 15 min at 700 °C, cooled 15 min in a desiccator and weighed.
— The last 2 steps are repeated until constant weight is achieved.
Calculation:
Na [mmol/1] = yield Na2SO4 [mg] · 2 · density [g/1]
Mr (Na2SO4) [g/mol] · sample weight [g]
Remarks
All samples are analysed in duplicate. The maximal allowed difference between duplicate measurements is 0.9 mmol/1. If this limit is exceeded, an additional measurement must be performed.
In sera with extremely elevated lithium levels (> 1.5 mmol/1) separation of lithium and sodium may not be complete (see results). For this reason the precipitate is dissolved in 10.00 ml distilled water, analysed for lithium with the NIST reference method (11), and corrected if necessary. So far, this has never been necessary in our determinations.
Before use, the ion-exchange column must be regenerated until constant column height (28 + 0.5 cm) is achieved. This step is performed twice.
Normally two working days are needed for the determination of one reference method value, and four columns can be han- dled efficiently by one technician.
2.5 Water determination
— All samples are analysed in duplicate, the maximal allowable difference between duplicate measurements being 0.0010 kg/1. If this limit is exceeded, an additional measurement must be performed.
— A glass petri dish (with cover) is irradiated for 3 min, (2 min at 175 W, l min at 575 W), cooled 30 min in a desiccator (containing calcium sulphate as desiccant) and weighed.
— This procedure is repeated until constant weight is achieved (Ml).
— Approximately 1 ml of sample is weighed into the glass petri dish and immediately hereafter it is weighed again (M2).
— 0.5 ml ethanol is added and after gently swirling the petri dish, the dish is placed (uncovered) into the microwave oven.
— The petri dish is again irradiated for 3 min, cooled 30 min in a desiccator and weighed.
— This procedure is repated until constant weight is achieved (M3).
Calculation:
The accuracy of the water determination was investigated ac- cording to the following procedure:
— 4 vials of control serum are stored overnight in a desiccator.
— The vials are weighed (Wl), 5.00 ml of distilled water is added and the vials are weighed again (W2).
— After determination of density and water content (see 2.5;
four determinations per vial) the vials are washed with distilled water, dried, stored overnight in a desiccator and weighed again (W3).
Calculation of water content:
2.6 Interference study
The possible interference of lithium and potassium was studied by determination of the sodium content in standard solutions containing different amounts of lithium (0.5 — 2.5 mmol/1) and potassium (5 — 50 mmol/1) but the same (weighed in) sodium concentration. In combination with these measurements, the influence of sodium-bicarbonate complex formation and so- dium-protein binding on the assay results was investigated.
Three solutions were prepared:
Solution A: 0.9368 g sodium chloride in distilled water, Solution B: 0.9380 g sodium chloride in 0.05 mol/1 LiOH/
H3B03,
Solution C: 1.3506 g sodium bicarbonate in 0.05 mol/1 LiOH/
H3B03.
The sodium concentration in A was determined according to the protocol in 2.4 after incubation (2 hours at room temper- ature) with 75 g/1 purified human albumin. Reference method values are corrected for sodium present in the albumin fraction.
The sodium concentration in B and C was measured by FAES (8) after separation on the ion-exchange column using 1 mol/1 LiCl in LiOH boric acid buffer (pH = 8.2). All samples are measured in duplicate on two consecutive days.
2.7 Expression of the sodium concentration in serum
The sodium concentration measured by the candidate reference method is divided by the measured water content and expressed as molality or substance concentration in the water phase (mmol/kg serum water).
If this value is multiplied by the normal serum water value (kg/1) (12), the reported value is thus corrected for abnormal water content and is called the standard sodium concentration (mmol/1 serum).
2.8 Statistical analysis
Inter-assay comparison was made by regression analysis ac- cording to Passing & Bablok (13). Significance between means of series of assay determinations was calculated with the Stu- dent's paired t-test (significant difference if p < 0.05).
Results
Precision
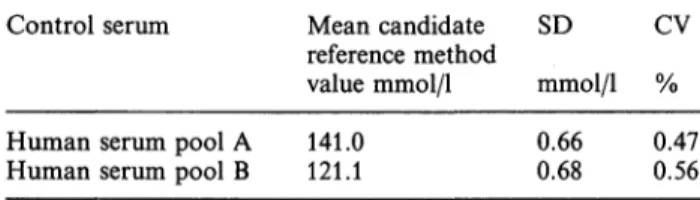
The imprecision of the sodium determination was calculated after twelve measurements on each of two human serum pools. The mean relative standard de- viation of the candidate reference method value was 0.52% at the 120-140 mmol/1 level (tab. 1). For calculation of the precision of the water determina- tion, twenty measurements on two human serum pools were used. The mean relative standard deviation was 0.09% (tab. 2). These results indicate a mean imprecision of the coupled sodium water determina- tion of approximately 0.6% (0.8 mmol/1) for sera with normal sodium and water contents.
Tab. 1. Precision of the sodium determination.
Control serum Mean candidate SD
reference method
value mmol/1 mmol/1 % CV
Human serum pool A 141.0
Human serum pool B 121.1 0.66
0.68 0.47 0.56
Tab. 2. Precision of the water determination.
Control serum Mean candidate SD CV
reference method
value kg/1 kg/1 % Human serum pool C 0.9401
Human serum pool D 0.9288 0.0007
0.0009 0.08 0.10
Accuracy
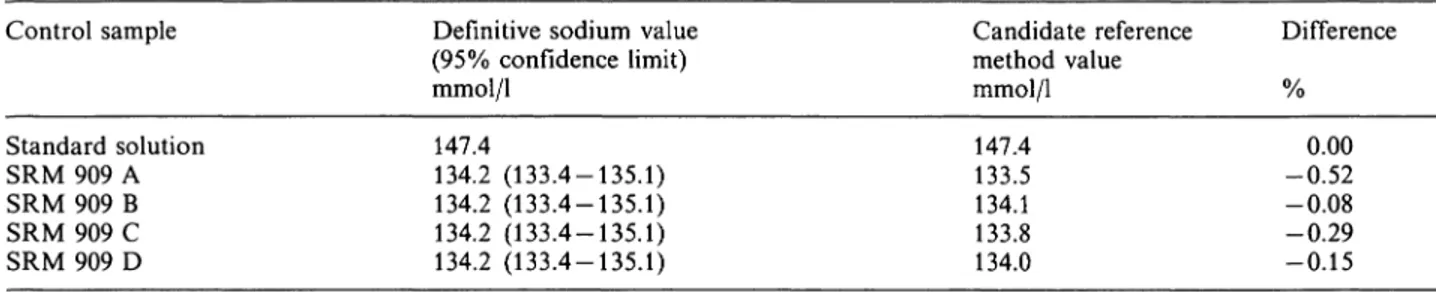
The accuracy of the sodium determination was inves- tigated with twelve measurements on a standard so- lution and four measurements on NBS SRM 909. The mean candidate reference method value for the stan- dard solutions is 147.4 mmol/1 (range 146.8 — 148.7 mmol/1), which equals the weighed-in value. The mean candidate reference method value for SRM 909 dif- fered by —0.3% from the definitive value, and all four values were within the confidence limits of the definitive value given by NIST (tab. 3).
The accuracy of the water determination was inves- tigated according to the procedure mentioned in the methods section. The mean measured water content differed by -0.01% (range -0.03-0.04%) from the calculated value (tab. 4). Mean inaccuracy for the coupled sodium water determination therefore is ap- proximately -0.3% (0.4 mmol/1) with the SRM 909.
Interference study
Sodium measurement is not influenced by potassium concentrations up to 50 mmol/1 and lithium concen- trations up to 1.5 mmol/1 (results not shown). If the lithium concentration in a serum sample exceeds 1.5 mmol/1, separation between lithium and sodium is not complete and reference method values are biased by lithium sulphate precipitation.
Binding of sodium to protein and bicarbonate at physiological pH has been reported in the literature (14, 15), and this would be expected to increase with increasing pH. Because there is no significant decrease in measured sodium value after incubation with hu- man serum albumin under the reaction conditions (solution A) and at pH = 8.2 (solution B) (tab. 5), the candidate reference method can be considered to determine both bound and unbound sodium in human serum. At pH = 8.2 approximately 5% of the sodium present is bound to bicarbonate. Our results (tab. 5, solution C) indicate, as expected, that all bicarbonate- bound sodium is also determined with the candidate reference method, because no significant difference between measured and calculated sodium concentra- tion can be detected.
Comparison with routine procedures
Each day, during a period of eighteen days, we ana-
lysed two patient samples in duplicate with the can-
didate reference method and the routine procedures
used in our department. The samples (n = 36) were
selected on the basis of routine measurement and
encompassed sodium concentrations between 125 and
Tab. 3. Accuracy of the sodium determination.
Control sample
Standard solution SRM 909 A SRM 909 B SRM 909 C SRM 909 D
Definitive sodium value (95% confidence limit) mmol/1
147.4
134.2 (133.4-135.1) 134.2 (133.4-135.1) 134.2 (133.4-135.1) 134.2 (133.4-135.1)
Candidate reference method value mmol/1 147.4 133.5 134.1 133.8 134.0
Difference
-0.520.00 -0.08 -0.29 -0.15
Tab. 4. Accuracy of the water determination.
Control serum Vial 1 Vial 2 Vial 3 Vial 4
H2O calculated kg/1 0.9374 0.9366 0.9357 0.9452
H20 measured kg/1 0.9371 0.9368 0.9357 0.9456
Difference
% -0.03
0.02 0.000.04
Tab. 5. Influence of sodium protein binding and bicarbonate complex formation on candidate reference method val- ues.
Solution A Β C
Na calculated mmol/1 160.3 160.5 160.8
Na measured mmol/1 160.9 159.8 160.2 161.0 161.0 160.4
Binding
% -0.320.37 -0.19 0.31 0.12 -0.25
160 mmol/1 and protein concentrations between 57 and 80 g/1. Mean water content was 0.9369 kg/1 (range 0.9221-0.9436 kg/1). Table 6 presents the regression data of comparison between candidate reference method sodium molality and routine method values (sodium molarity). A comparison of free molal con- centration (by direct ISE; ACA III and Corning 614) and total molal concentration (by the proposed can- didate reference method) is presented in table 7. Fi- nally, candidate reference method standard sodium concentrations (molarity) are compared with the cor- responding routine method values.
Proficiency testing
Using the data base of the Dutch external quality control program (SKZL) we studied the accuracy of the consensus value of sixteen external quality control sera in three selected methods. Consensus values for FAES, direct ISE and indirect ISE were compared with the candidate reference method values. Consen- sus values agreed well with the candidate reference
Tab. 6. Method comparison (y = ax + b) between candidate reference method sodium molality (x) and routine method value
(y).
Method B 95% confidence limit Mean y Mean χ
IL943 CHEM 1 RA 1000 ACA III CORNING 614
0.9400 0.9199 0.9916 0.9091 0.9091
-1.60.7 -7.73.3 2.9
A
0.8696-1.0127 0.8511-1.0127 0.8871-1.0938 0.8411-0.9870 0.8421-0.9998
Β
-12.2- 9.3 -12.9-11.3 -23.2- 8.2 - 8.8-13.5 -10.9-13.0
mmol/1 141.2 140.5 142.7 140.9 140.7
mmol/kg 151.5 151.5 151.5 151.5 151.5
Tab. 7. Method comparison (y = ax + b) between candidate reference method total sodium molality (x) and free sodium molality measured by direct ISE.
Method
ACA III CORNING 614
A
0.9734 0.9804
B
2.12.1
95% confidence limit A B
0.8934-1.0422 -6.2-11.8 0.9004-1.0641 -9.9-10.4
Mean y mmol/1 150.8 151.2
Mean x mmol/kg
151.5 151.5
ρ value
0.218 0.175
Tab. 8. Method comparison (y = ax + b) between candidate reference method standard sodium concentration (x) and routine method value (y).
Method B 95% confidence limit Mean y Mean χ ρ value
IL943 CHEM 1 RA1000 ACA III CORNING 614
1.0066 0.9890 1.0682 0.9813 0.9819
-1.20.7 -8.12.5 2.2
A
0.9346-1.0909 0.9160-1.0909 0.9524-1.1732 0.9028-1.0599 0.9036-1.0753
Β
-12.7- 9.3 -13.4-11.1 -22.9- 8.2 - 8.7-13.6 -11.0-13.0
mmol/1 141.2 140.5 142.7 140.9 140.7
mmol/1 141.0 141.0 141.0 141.0 141.0
0.520 0.100 0.001 0.593 0.284
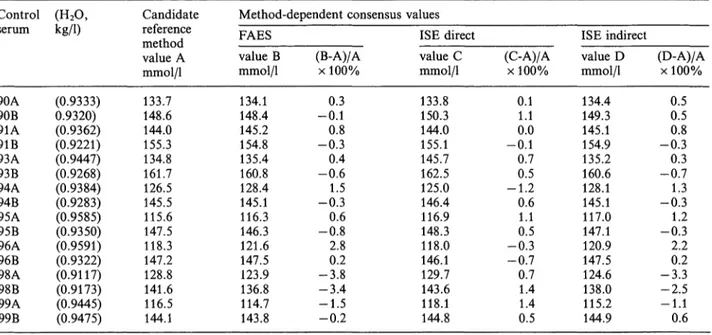
method values (tab. 8). The mean bias of FAES was -0.3% (range -3.8-2.8%), and of indirect ISE -0.1% (range -3.3-2.2%). A negative bias was found when the water content was low (samples 98A and B), and a positive bias when the water content was high (sample 96A). Consensus values from direct ISE differed on average by —0.4% (range — 1.2 — 1.4%) from the candidate reference method value.
Discussion
Good agreement between direct (ISE) and indirect (ISE and FAES) determinations is found in samples in which protein and lipid, and therefore, serum water concentrations are normal. The expected differences are found with samples which contain abnormally low or high levels of protein and lipids (and therefore an abnormal water concentration). In these samples, indirect methods give results which are susceptible to clinical misinterpretation.
Approaches which seek to correct flame photometric and indirect ISE sodium determinations by measure- ment of total protein and/or lipids in serum (8) or by measuring serum water (10) gain ready acceptance in clinical chemistry laboratories (16). These methods vary in performance and generally exhibit a bias ver- sus each other, thus indicating the need for all sodium measurements (both direct and indirect) to be per- formed on a serum-water concentration basis. Our method provides the necessary accuracy base, i. e. a candidate reference method for coupled sodium-water determination. This candidate reference method can be considered a reference method for the following reasons.
— The candidate reference method sodium value did not differ significantly from the definitive value given by NIST, and mean imprecision and inac- curacy for the coupled sodium water determination are below the limits set by the Expert Commission on Electrolytes (1 SD imprecision limit of 1.5 mmol/1 and a maximum difference from the defin- itive value of 2.0 mmol/1 for serum sodium at the 140 mmol/1 level) (9),
— There is no known source of interferences or sys- tematic errors (bias), mainly because the sodium ion is separated from the matrix,
— It produces results which approximate to the "true value" (total sodium value) within narrow limits because all sodium in serum (free ions as well as bound to protein or bicarbonate) is determined.
— Misinterpretation due to abnormal protein or lipid levels is excluded because reported values are ex- pressed as sodium molality or as sodium molarity after correction for abnormal water content.
Reference method values should be the basis of qual- ity assessment in clinical chemistry (17). This new concept was evaluated by using the candidate refer- ence method to establish the accuracy of field methods for sodium by comparative testing and the accuracy of method-dependent consensus values in a Dutch external quality control programme.
Our results (tab. 6) show that if analytically preferable results (sodium molality) are considered in the method comparison, there is a significant difference between the mean values of the sera used for comparison (p < 0.001, paired t-test) in all methods. Both direct ISE methods (ACA III and Corning 614) also show significant differences in the slope of the regression equation. The direct ISE methods were, however, calibrated to read similar values to a flame photo- meter. We therefore reset all correlation factors and compared free sodium molality (assuming normal wa- ter contents and activity coefficient) to total sodium molality (by the proposed candidate reference method). The results presented in table 7 show no significant difference in slope and (or) intercept.
It is argued that it would be physiologically desirable
to measure sodium activity instead of molality. Al-
though there is an analytical and statistical difference
between activity and molality, clinically these differ-
ences are not significant (4). The major advantage of
sodium molality measurement is that it provides for
an accuracy base (the described candidate reference
method) which is absent in (direct ISE) sodium activ-
ity measurement. A disadvantage of presentation of sample data as sodium molality is that high capacity instruments are needed to determine the water content if indirect field methods are used. Because these in- struments are not available and reference ranges would be significantly different from those currently used, the most practical solution is to correct the candidate reference method sodium concentration for possible abnormal water contents.
The sodium concentration measured by the candidate reference method is divided by the measured water content and multiplied by the normal serum water value (kg/1). The reported value is therefore the so- dium concentration that would be measured if the serum water concentrations were normal, and it is called the standard sodium concentration. Because this "water correction" is used, current reference ranges can still be used and misinterpretation due to abnormal protein or lipid levels is still impossible.
These standard sodium concentrations are used for the method comparison presented in tab. 8. The re- sults show that in fact only the RA 1000 produces inaccurate results, and therefore is not properly cali- brated. Using the regression equation resulting from method comparison, the RA 1000 was programmed to set slope to 1.0 with an intercept of 0 against the candidate reference method. After this calibration procedure (18), results were in good correlation with standard candidate reference method values (
y= 0.9914x + 0.3, p = 0.234).
Calibrating (in)direct field methods in the way de- scribed ensures that field method values are similar
to the candidate reference method values, if samples with normal protein and lipid levels are used. Because inter-method comparability is increased and more ac- curate assay results are produced, this method com- parison procedure should be used in all field methods in addition to the calibration procedure mentioned by the manufacturers.
As mentioned, the candidate reference method is also used to establish the accuracy of method-dependent consensus values in a Dutch external quality control programme. The expected differences are found in samples which contain abnormally low (96A) or high (98A and B) protein and or lipid levels.
According to the new German Guidelines based on reference method values and medical requirements (19), sodium determinations may differ maximally by 6% from the reference method value. Since the max- imal difference from the candidate reference method value is only 3.8% and mean differences are less than 0.5% (tab. 9), all methods are considered valid for sodium measurement according to the German Guidelines. It has to be mentioned, however, that individual measurements may differ by more than 6%
from the candidate reference method value, especially if abnormal protein and or lipid levels are present.
The candidate reference method might be used to determine the urgently needed reference method val- ues of sodium in serum on a plasma water basis. If the regression equation of comparison against the candidate reference method is used for calibration of field methods, all samples which contain abnormally high levels of protein and or lipids will still, if indirect
Tab. 9. Comparison of candidate reference method standard sodium concentration with method-dependent consensus values.
Control (H2O, serum
90A90B 91A91B 93A93B 94A94B 95A95B 96B96A 98A98B 99A99B
Kg/1)
(0.9333) 0.9320) (0.9362) (0.9221) (0.9447) (0.9268) (0.9384) (0.9283) (0.9585) (0.9350) (0.9591) (0.9322) (0.9117) (0.9173) (0.9445) (0.9475)
Candidate reference method value A mmol/1 133.7 148.6 144.0 155.3 134.8 161.7 126.5 145.5 115.6 147.5 118.3 147.2 128.8 141.6 116.5 144.1
Method-dependent consensus values FAES
value B mmol/1 134.1 148.4 145.2 154.8 135.4 160.8 128.4 145.1 116.3 146.3 121.6 147.5 123.9 136.8 114.7 143.8
(B-A)/A χ 100%
-0.10.3 -0.30.8 0.4 -0.61.5 -0.30.6 -0.82.8 -3.80.2 -3.4 -1.5-0.2
ISE direct value C mmol/1 133.8 150.3 144.0 155.1 145.7 162.5 125.0 146.4 116.9 148.3 118.0 146.1 129.7 143.6 118.1 144.8
ISE indirect (C-A)/A
χ 100%
0.11.1 -0.10.0
0.70.5 -1.20.6 1.10.5 -0.3 -0.70.7
1.41.4 0.5
value D mmol/1 134.4 149.3 145.1 154.9 135.2 160.6 128.1 145.1 117.0 147.1 120.9 147.5 124.6 138.0 115.2 144.9
(D-A)/A χ 100%
0.50.5 -0.30.8 -0.70.3 -0.31.3 1.2 -0.32.2 -3.30.2 -2.5-1.1 0.6
measured, give results which are susceptible to clinical misinterpretation. Both indirect and direct measure- ments are suitable for use in patient management, provided the indirect measurements are corrected for abnormal water content. The development of high capacity instruments for water determination in hu- man serum is therefore desirable. Meanwhile, it must be kept in mind that for most patient samples indirect
and direct measurement correlate well, and clinically important differences are found in only a few cases.
Acknowledgement
The authors wish to thank Dr. B. G. Blijenberg for critical reading of the manuscript and Dr. H. Baadenhuijsen for sup- plying control sera from the Dutch Quality Assessment Foun- dation.
References
1. Maas, A. H. J., Siggaard-Andersen, O., Weisberg, H. F. &
Zijlstra, W. G. (1985) Ion-selective electrodes for sodium and potassium: A new problem of what is measured and what should be reported. Clin. Chem. 31, 482-485.
2. Ladenson, J. H., Apple, F. S., Aguanno, J. J. & Koch, D.
D. (1982) Sodium measurements in multiple myeloma: two techniques compared. Clin. Chem. 28, 2383-2386.
3. Albrink, M. J., Hald, P. M., Man, E. B. & Peters, J. P.
(1955) The displacement of serum water by the lipids of hyperlipemic serum. A new method for the rapid determi- nation of serum water. J. Clin. Invest. 34, 1482 — 1488.
4. Worth, H. G. J. (1985) A comparison of the measurement of sodium and potassium by flame photometry and ion- selective electrode. Ann. Clin. Biochem. 22, 343-350.
5. Oesch, U., Ammann, D. & Simon, W. (1986) Ion-selective membrane electrodes for clinical use. Clin. Chem. 32, 1448-1459.
6. Burnett, D., Ayers, G. J., Rumjen, S. C. & Woods, T. F.
(1988) Sodium measurements in the presence of parapro- teins by four direct IS E methods and flame photometry compared. Ann. Clin. Biochem. 25, 102-109.
7. Boink, A. B. T J., Buckley, B. M., Christiansen, T. F., Covington, A. K., Maas, A. H. J., Mueller-Plathe, O., Sachs, Ch. & Siggaard-Andersen, O. (1986) Ion-selective electrode measurements of sodium and potassium in un- diluted serum, plasma or whole blood: recommendations for expression of results in clinical practice. In: Proceedings of the 4th Meeting of the European Working Group on Ion Selective Electrodes, pp. 237 — 238, Radiometer, Copenha- 8. Waugh, W. H. (1969) Utility of expressing serum sodiumgen.
per unit of water in assessing hyponatremia. Metabolism 18, 706-712.
9. Velapoldi, R. A., Paule, R. C., Schaffer, R., Mandel, J. &
Moddy, J. R. (1978) Standard reference materials: A ref- erence method for the determination of sodium in serum.
N.V.S. Special Publication 260-269.
10. van Kreel, B. K., Wulkan, R. W. & Leijnse, B. L. (1988) Serum water determination by means of microwave evap- oration. J. Clin. Chem. Clin. Biochem. 26, 579-581.
11. Velapoldi, R. A., Paule, R. C., Schaffer, R., Mandel, J., Machlan, L. A., Garner, E. L. & Rains, T C. (1980) Standard reference materials: A reference method for the determination of lithium in serum. N. B. S. Special Publi- cation 260-269.
12. Broughton, P. M. G., Smith, S. C. H. & Buckley, B. M.
(1985) Calibration of direct ion-selective electrodes for plasma Na+ to allow for the influence of protein concen- tration. Clin. Chem. 31, 806.
13. Passing, H. & Bablok, W. (1983) A new biomedical pro- cedure for testing the equality of measurements from two different analytical methods. J. Clin. Chem. Clin. Biochem.
21, 709-720.
14. Carr, C. W. (1956) Studies on the binding of small ions in protein solutions with the use of membrane electrodes. VI.
The binding of sodium and potassium ions in solutions of various proteins. Arch. Biochem. Biophys. 62, 476 — 484.
15. Coleman, R. L. & Young, C. C. (1981) Evidence for for- mation of bicarbonate complexes with Na and K under physiological conditions. Clin. Chem. 27, 1938-1939.
16. Faye, S. & Payne, R. B. (1986) Rapid measurement of serum water to assess pseudohyponatremia. Clin. Chem.
32,983-986.
17. Stamm, D. (1982) A new concept for quality control of clinical laboratory investigations in the light of clinical requirements and based on reference method values. J. Clin.
Chem. Clin. Biochem. 20, 817-824.
18. Rüssel, L. J., Smith, S. C. H. & Buckley, B. M. (1988) Plasma sodium and potasium measurements: minimising ISE-flame differences using specimens from patients. Ann.
Clin. Biochem. 25, 96-101.
19. Anonymous (1988) Qualitätssicherung der quantitativen Bestimmungen im Laboratorium. Neue Richtlinien der Bundesärztekammer. Dt. Ärztebl. 85, B517-B531.
Drs. J. D. E. van Suijlen Academic Hospital Dijkzigt Department of Clinical Chemistry Dr. Molewaterplein 40
NL-3015 GD Rotterdam