Kock et al.r A candidate reference method for the determination of uric acid 157 J. Clin. Chem. Clin. Biochem.
Vol. 27, 1989, pp. 157-162
© 1989 Walter de Gruyter & Co.
Berlin · New York
A Candidate Reference Method for the Determination of Uric Acid in Serum Based on High Performance Liquid Chromatography, Compared with an
Isotope Dilution-Gas Chromatography-Mass Spectrometer Method
! By R. Kock, B. Delvoux, U. Tillmanns and H. Greiling
i
Institut für Klinische Chemie und Päthobiochemie der Medizinischen Fakultät der RWTH Aachen, Aachen(Received June 20/October 14/December 14, 1988)
Summary: A method based on isocratic high performance liquid chromatography (HPLC) with UV detection at 292 nm is proposed äs a candidate reference method for the determination of uric acid. Data obtained by this method are compared with those from an isotope dilution-gas chromatography-mass spectrometric method (ID-GC-MS), using [l,3-
15N
2]uric acid äs internal Standard and selected mass detection at m/z = 456 and m/z = 458.
The inaccuracy of the ID-GC-MS method is maximally 0.4% for NBS-SRM-909 control sera with a concentration of 483 /l. The coefficient of Variation between days is 0.26%-0.80% and 0.37 — 0.90%
for 14 control sera from other suppliers.
The maximum bias of the HPLC method is 0.6%, and the coefficient of Variation between days is 0.31% — 0.65% for NBS-SRM-909 control sera. The coefficient of Variation between days for the other 14 control sera tested is 0.35%—0.66%.
Comparison of the HPLC method with the reference ID-GC-MS method resulted in a coefficient of correlation of r = 0.9998 (n = 14). The concentration of uric acid in the tested control sera ranged from 160 to 624 / .
The aim of this study was to establish an HPLC- During the last ten yeafs several procedures for the method with high precision and accuracy to serve äs determination of uric acid in different body fluids candidate reference method for the determination of häve been published. They employ the method of uric acid. The use of guard columns eliminated the reversed-phase HPLC with electrocheniical or spec^ requirernent for complex sample preparation tech- trophotometric detection, for samples qf serum, ürine niques, which reduce both the simplicity of the (1 — 19),· amniotic fluid (20) äs well äs cerebrospinäl method and reliability of the analytical results.
fluid (21). The described methods suffer mainly from
lack of the precision required for a reference method, To test the accuracy of the presented method, its and the fact that no internatioiially accepted Standard analytical results were compared with those obtained
| material was used for the control of accuracy. The by an isotope dilution-gas chromatographic-mass
! first HPLC-based candidate reference method was spectrometric (ID-GC-MS) method. From the well
; based on isotope dilution-high performance liquid established methods (23—24), the method of Siek-
• chromatography with radioactive uric acid äs internal mann was chosen, which uses [l,3-
15NJuric acid äs Standard (22). internal Standard.
J. Clin. Chem. Clin. Biochem. / Vol. 27,1989 / No. 3
Materials and Methods Chemicals
Uric acid (purity 99.7% ± 0.1%) used for preparation of the Standard Solutions was a Standard Reference Material (SRM 913, National Bureau of Standards, Washington, D.C. 20234);
[l,3-15N2]uric acid (99% 1,3-15N2- isotopic enrichment) was ob- tained from Amersham International (Amersham, UK); uricase (EC 1.7.3.3) was purchased from Boehringer Mannheim (Mannheim, FRG); N-methyl-N-trimethylsilyl trifluoroacetic amide was supplied by Macherey & Nagel (D ren, FRG). All other chemicals used were of analytical grade and purchased from Merck (Darmstadt, FRG), SIGMA (Munich, FRG) and Aldrich (Steinheim, FRG). The pyridine used was stored over molecular sieve 4μπι, purchased from Merck (Darmstadt, FRG). Demineralized water was prepared with a Milli-Q ap- paratus from Millipore GmbH (Eschborn, FRG). The anion exchange resin AG 1x2, acetate form, was supplied by BioRad (Munich, FRG).
The eluent was 0.05 moi/1 potassium dihydrogenphosphate buffer, pH 4.90. Flow rate was set to l ml/min, corresponding to a pressure of 120 bar.
Glassware
Volumetrie flasks (10 ml and 100 ml) were calibrated by filiing with water at 20 °C and weighing the Contents. The 25, 50 and 100 μΐ gas tight syringes, equipped with repeatiiig adapter (Hamilton Boriaduz AG; Bonaduz, Switzerland) were cali- brated by weighing procedures before use.
Samples for HPLC- and GC-MS measurements were prepared in piastic reaction vials (3 ml) (Sarstedt; N mbrecht, FRG).
For the GCrMS procedure, the final evapor tioh of methanolic ammonia and the derivatisation procedure were perf rmed in Micro-Vials (Wheaton; Miliville, NJ, USA).
A 5 μΐ syringe was used for injection into the GC. A 25 μΐ syringe with a Rheodyne-tip was used for injection into the HPLC.
Samples
Human serum for determination of accuray of the methods was a Standard Reference Material (SRM 909, National Bureau of Standards, Washington, D.C. 20234). All other control sera were given by Prof. Dr. Dr. D. Stamm (Deutsche Gesellschaft f r Klinische Chemie e. V., Zentrale Referenzinstitution, Max- Planck-Institut f r Psychiatrie, Abteilung Klinische Chemie, Kraepelinstr. 10, D-8000 M nchen 40).
Instruments and settings
Isotope dilution — gas chromatography — mass spectroscopy A Finnigan ΜΑΤ 1020 combined gas-chromatograph quadru- pole-mass-spectrometer with Perkin Eimer Sigma-3 gas-chro- matograph, equipped with an FS-SE 30/CB 25 m χ 0.32 mm capillary column (Macherey & Nagel, D ren, FRG) was used.
GC-conditions: The carrier gas was Helium at 100 kPa inlet pressure, the split-exit was set at 10 ml/min, the split-ratio was set to a value about 1:10, the injector temperature was 230 °C, the oven temperature was isothermal 210 °C, the transfer line was heated to 230 °C.
MS-conditions: selected mass detection at m/z = 456 ± 0.25 and m/z = 458 ± 0.25, 0.28 seconds per scan, the resolution was set to approximately 10% valley by manual tuning.
High performance liquid chromatography
HPLC was performed on a Bruker Model 31 Chromatograph with Rheodyne injection valve (20 μΐ injection-loop), 20 χ 4 mm RP-18 guard column, 250 χ 4 mm RP-18 analytical col- umn, both filled with LiChrosorb (Merck; Darmstadt, FRG) RP-18, 5μιη material. The guard-column has to be replaced every 40—60 injections due to contamination with serum com- ponents. The analytical column must be replaced every month for the same reason.
For UV-detection a Bruker-Knauer filter photometer No.
97.00, equipped with a 292 nm interference filter, set to 0.08 absorbance units f ll scale, was used. Integration of area was carried out on a Hewlett-Packard Integrator.
The multiwavelength chromatograms were obtained with a Waters 990 Photo-Diode-Array-UV-Vis Detector with the fol- lowing settings: wavelength r nge 210 nm-330 nm, resolution 4 nm, l scan per second, 23 ms sampling time; 10 sampling times were averaged per scan; sensitivity was set to high (7 points).
Procedures and measurements Weighing procedures
The uric acid certified reference material and the isotopically labelled uric acid were weighed on a micro balance (Mikro- waage 708501, Fa. Sartorius, G ttingen, FRG). AU other weighing procedures, including the calibration of Volumetrie flasks and the Hamilton syringes, were done on a semimicr balance (Halbmikrowaage 2004 MP4 Fa. S rtorius, G ttingen, FRG).
Serum reconstitution
Serum samples (Standard Reference Material) and control sera were reconstituted by the following procedure. The label was torn off completely, and residual paper and adhesive were rernoved by wiping the vials with an acetone-moistened tissue;
a number was scratched on each vial for specimen identification.
After removal of the metal closure, serum particles adherent to the stopper were dislodged by repeatedly tapping the bottom of the vial. The stopper was then dislodged to equalize air pressure, and the viai plus stopper was weighed with a precision of 0.1 mg. The amount of water (19-22°C) specified for the reconstitution of the serum specimen, was pipetted into the vial.
The control sera were pooled by pipetting 5 ml from each of 5 reconstituted vials, using an officially calibrated pipette and mixing carefully.
After reconstitution, the empty vials were cleaned and dried, then weighed to determine the previous content of lyophilisate of each vial.
Four pools were prepared and measufed in the same manner to obtain the mean concentration for each given control serum.
Preparation of Standards
For ID-GC-MS, the internal Standard was prepared by dis- solving 2mg of isotopicaily enriched [l,3-I5N2]uric acid in 10 ml 0.013 mol/1 ammonia under sonification. The internal Stand- ard was frozen in portions of l ml at —71 °C. The uric acid Standard solution was prepared by dissolving 2 mg uric acid (SRM 913) in 100 ml 0.013 mol/1 ammonia under sonification.
For HPLC analysis, the Standard solution was prepared by dissolving 6mg uric acid (SRM 913) in 100 ml 0.013 mol/1 ammonia under sonification.
For ID-GC-MS measurements s well s for HPLC measure- ments,, two Standards were prepared freshly each d y.
J. Clin. Chem. Clin. Biochem! / Vol. 27,1989 / No. 3
Kock et al.: A candidate reference method for the determination of uric acid 159 HPLC measuremenls
Standards and serum samples were diluted with HPLC eluent buffer to give concentrations of 20 to 40 μπιοΐ/ΐ. The required amount of diluent was weighed and the amount of Standard or serum pipetted with a 50 μΐ calibrated syringe. Then the diluted samples were fillered through.a membrane filtration device with a pore diameter of 0.45 μπι (Sartorius GmbH; G ttingen, FRG) and 20 μΐ were injected for HPLC analysis.
Low Standard, serum sample and high Standard were consec- utively injected in triplicate. The concentrations of uric acid in the serum samples were obtained by Integration of peak areas using linear Interpolation between the bracketing Standards.
GC-MS measuremenls
Standard samples were prepared by pipetting 20 μΐ of internal Standard into 150 μΐ, 200 μΐ or 250 μΐ of Standard solution in Micro-Vials. The solvent was evaporated at 60 °C under a nitrogen-stream and the residue was finally incubated with 50 μΐ derivatisation mixture (N-methyl-N-trimethylsilyl trifluor- acetic amide/pyridine l + 2) at 60 °C overnight.
Serum samples were prepared by pipetting 20 μΐ internal Stand- ard, 50 μΐ serum and 500 μΐ demineralized water into a vial.
The solution was gently mixed up and equilibrated for 30 min.
Then the samples were transferred to Pasteur pipettes (2.5 cm length, 0.5 cm inner diameter) filled with l ml anion exchange resin. After washing with 2 ml demineralized water and 500 μΐ 12 mol/1 acetic acid, the samples were evaporated under a nitrogen-stream at 80 °C. The residue was dissolved in 500 μΐ ammonia in methanol (50 ml 25% NH3 solution H- 950 ml methanol). After centrifugation in an Eppendorf centrifuge 5414 for 5 min, the supernatant was transferred into Micro- Viais and treated s described above.
For GC-MS measurements 1.5 μΐ were injected, and areas were calculated with the Finnigan-MAT Integration Software. Sub- sequent calculations were performed, using the computational procedure described by Siekmann (25).
Results
Specificity
The chromatograms (fig. 1) of Standard mixtures of uric acid, creatinine, hypoxanthine, xanthine, uridine, thymine, inosine-S'-phosphate, orotic acid, allopuri- nol and oxipurinol, each at a concentration of 45 μιηοΐ/ΐ clearly demonstrate that all substances tested are well separated firom uric acid. Relative retention times with respect to uric acid are given in table l.
Nevertheless, uricase degradations of the control sera were performed prior to quantitative analysis, to en- sure the homogeneity of the uric acid peak. Interfering substances were never observed at the retention time of uric acid; the same was true for pooled patient sera.
Precisioii
Precision between days was tested with appropriate pool sera; aliquots were stored seperately at — 70 °C and were thawed and equilibrated at room tempera- ture prior to sample processing.
0.04
^0.02S
0 0.04
^0.02S
0 0.04
^0.02
i
10 t [min] 20 30
Fig. 1. Multiwavelength chromatograms performed at 220 nm, 254 nm and 292 nm with concentrations of 45 μηιοΐ/ΐ of each substance; peak Identification:
1. allantoin, 2. orotic acid, 3. creatinine,
4. inosine-5'-phosphate, 5. uric acid,
6. hypoxanthine, 7. uridine, 8. xanthine, 9. thymine, 10. oxipurinol, 11. allopurinol
Tab. 1. Relative retention times of probably interfering sub- stances
Substance Relative retention time Allantoin 0.330
Orotic acid 0.439 Creatinine 0.498 Inosine^S'-phosphate 0.932 Uric acid 1.000 Hypoxanthine 1.297 Uridine 1.485 Xanthine 1.556 Thymine 1.732 Oxipurinol 1.991 Allopurinol 2.362
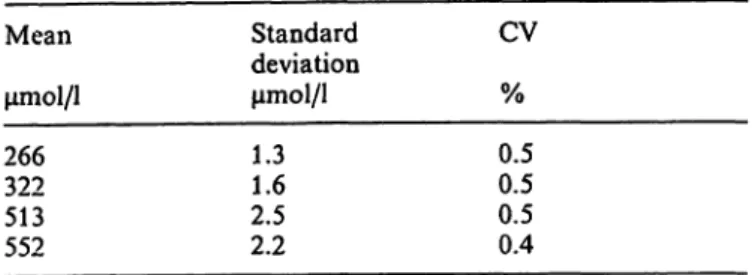
The coefficient of Variation (CV) within run (n = 20) is less than 0.5% for analysis of sera (data shown in table 2); the CV between days (n = 20) is less then 0.8% for analysis of sera (data shown in table 3).
J. Clin. Chem. Clin. Biochem. / Vol. 27,1989 / No. 3
Tab. 2. Within-run precision of the HPLC method for the de- termination of uric acid in serum (n = 20)
Mean Standard CV deviation
μηιοΐ/l μηιοΐ/ΐ % 266 1.3 0.5 322 1.6 0.5 513 2.5 0.5 552 2.2 0.4
Tab. 3. Day to day precision of the HPLC method for the determination of uric acid in serum (n = 20)
Mean Standard CV deviation
μιηοΐ/l μιηοΐ/ΐ % 245 1.7 0.7 357 2.9 0.8 511 2.5 0.5 592 4.7 0.8
Accuracy
For SRM 909 the maximum deviation from the cer- tified value was 0.6% in HPLC, which is only slightly higher than the bias obtained from the ID-GC-MS measurements (see table 4).
The results for the concentration of uric acid in 14 control sera, s obtained with both HPLC and ID- GC-MS, are shown in table 5 and figure 2.
The standardized main component analysis yielded the following relationship:
Curie acid (HPLC) =
1.00595 χ c
uric add (oc-MS) - 3.834 μηιοΐ/ΐ The coefficient of correlation was r = 0.9998 (p < 0.0005).
Practicability
The number of'analyses per day is dependent on the required precision. The weighing procedure for the diluent buffer is the most time consuming Step in sample preparation. The time required for prepara- tion of the Standards is about 15 min. Precluding the analysis of 5 serum pools, the complete dilution pro- cedure takes about 1 h. Since the absence of interfer- ing substances was shown for all tested eontrol sera by uricase decomposition studies, one HPLC run with 6 Standard- and 3 serum injections takes about 20 min. Therefore, if two threefold-determinations of each serum pool are performed, the HPLC measure- ments will take about 5.5 h, if one run with an ap- propriate dilution of SRM 909 is intercalated in every 2 runs.
Tab. 4. Concentration of uric acid in the Standard Reference Material SRM-909 (human serum), obtained by ID- nrv^c Ο«Λ TWPT r1
CV = coefficient of Variation between days (n = 10)
%BiaS = 100 X (Cobtained - Ccer fied) / Gotrtffbd.
Ccer fied =? 483 μΠΊΟΐ/Ι
ID-GC-MS ' HPLC MeanμπιοΙ/1
483481 482482 482482
CV Bias Mean CV Bias
% % μιηοί/l % % 0.5 0.0 483 0.3 0.0
0.8 -0.4 481 0.5 -0.4
0.7 -0.2 480 0.7 -0.6
0.3 -0.2 482 0.5 -0.2
0.7 0.2 480 0.6 0.6
0.2 -0.2 483 0.4 0.0
Tab. 5. Concentration ot uric acid in tbe 14 control sera, ob*
tained by ID-GC-MS and HPLC
%Deviation = 100 χ (CIC-GOMS - cHPLc) / CID_GC-MS ID-GC-MS HPLC
Meanμιηοΐ/ΐ 328510 296500 320624 485160 286306 313306 403321
CV Mean CV Deviation
% μιηοΐ/ΐ % /0
0.56 328 0.52 0.00
0.53 510 0.38 0.00
0.74 502 0.64 -0.40
0.46 290 0.50 2.03
0.57 320 0.50 0.00
0.61 622 0.52 0.32*
0.78 162 0.66 -1.25*
0.31 486 0.50 -0.21
0.37 282 0.44 1.40
0.49 299 0.35 2.29
0.90 310 0.77 0*96
0.49 302 0.56 1.31
0*62 320 0*49 0*31
0.51 402 0.48 0.25
* Analysis was performed from single vials, not from pools, s described in Materials and Methode
600
«— ι
"o
^400
y
£
'G0 .y 200 5
0
./
/
</
/ //
sF //
rf
/ /
/^__ ' ,
200 400 ·-· 600 Uric acid (ID^GC-MS) [μηηοΐ/ΐ]
Fig. 2. Correlation of the analytical results for uric acid deter- mination in 14 control sera with HPLC and ID-GC- MS
J. Clin. Chem. Clin. Biocheni.V Vol. 27,1989 / N . 3
Kock et al.: A candidate reference method for the determination of uric acid 161 Conclusions
The HPLC method for determination of uric acid presented in this paper has high precision and accu- racy. The coefficient of Variation within run does not exceed 0.5%, and the day to day Variation does not exceed 0.8%. For Standard Reference Material SRM 909, the deviation from the certified value was no larger than 0.4%. Thus, the inaccuracy of the method presented is not worse than the imprecision.
The comparison of the analytical results for the 14 control sera obtained by the established ID-GC-MS method with those obtained by the described HPLC method yielded a coefficient of correlation r = 0.9998.
As can be seen in table 5; the largest difference be- tween the methods is 2.29%; for 8 of the 14 control sera the difference is less than or equal to 0.40%.
Large differences were observed in the case of two control sera, where the reference method value deter- I mined by ID-GC-MS was 2.03% or 2.29% higher i than the the value determined by HPLC. This may
! result from specific serum matrix effects, which affect only the accuracy of one or of both used methods.
Since HPLC- and ID-GC-MS measurements were done with samples from the same serum pools, other sources of error could be excluded.
To our knowledge, this is the first report of the parison of an HPLC- with an ID-GC-MS method for the determination of uric acid. Moreover, no previ- ously published HPLC method for this analyte has been evaluated using Standard Reference Material for Standards äs well äs control sera; and in all previously reported studies, accuracy was determined by stand- ard-recovery experiments only.
Another advantage of our HPLC method is the sim- plification of the sample preparation by the use of guard columns, which also contributes to the high reproducibility. As shown by Kojima et al. (26) for the Amicon MPS-1 ultrafiltration System and by Sak-
uma et al. (27) for several other deproteinizing meth-ods, such äs zinc hydroxide, sodium tungstate, tri- chloroacetic acid, perchloric acid and acetonitrile, all these procedures reduce the accuracy to such an ex- tent, that they are disqualified äs sample preparation techniques for a reference method.
Although the method is used in our laboratory only for the determination of reference method values, it may be used for the determination of uric acid in patient sera, if it is suspected that the routinely used methods are affected by interfering substances, äs reported for hyperxanthinaemia (28).
This method is the first HPLC method to be evaluated for application äs candidate reference method for the determination of uric acid in serum according to the recommendations of the International Federation of Clinical Chemistry (29-32).
An unsolved problem is the stability of uric acid in aqueous solution. Uric acid can be autoxidized by oxygen-derived radicals (33 — 34). This reaction is temperature-dependent, therefore the preparation of the uric acid Standard Solutions has to be carried out äs carefully äs possible. Temperatures above 20 °C should be avoided. This is also necessary for the reconstitution of the control sera.
References
1. Pachla, L. A. & Kissinger, P. X (1975) Clin. Chim. Acta 59, 309-312.
2. Kiser, E. J., Johnson, G. F. & Witte, D. L. (1978) Clin.
Chem. 24, 536-540.
3. Milner, J. A. & Pefkifts, E. G. (1978) Anal. Biochem. 88, 560-565.
4. Brown, N. D., Kintzios, J. A. & Koetitz, S. E. (1979) J.
Chromatogr. 777, 170-173.
5. Pachla, L. A. & Kissinger, P. T. (1979) Clin, Chem. 25, 1847-1852.
6. Putterman, G. J., Skaikh, B., Hallmark, M. R., Sawyer, C.
G., Hixson, C. V. & Perini, R (1979) Anal. Biochem. 98, 18-26.
7. Wung, W. E. & Howell, S. B. (1980) Clin. Chem. 26,1704- 1708.
8. Hausen, A,, Fuchs, D. Koenig, K. & Wächter, H. (1981) Clin, Chem. 27, 1455-1456.
9. Ingebretsen, O. C., Borgen, J. & Farstad, M. (1982) Clin.
Chem. 28, 496-498.
10. Nissen, R (1982) J. Chromatogr. 228, 382-386.
11. Miyazaki, H., Matsunaga, , Yoshida, K., Arawaka, S. &
Hashimoto, M. (1983) J. Chromatogr. 274, 75-85.
J. Clin. Chem. Clin. Biochenu /Vol. 27,1989 / No. 3
12. Palmisano, F., Desimoni, E. & Zambonin, R G. (1984) J.
Chromatogr. 306, 205—214.
13. Hatch, L. L. & Sevanian, A. (1984) Anal. Biochem. 138, 324-328.
14. Iriyama, K., Yoshiura, M., Iwamoto, T. & Ozaki, Y. (1984) Anal. Biochem. 141, 238-243.
15. Zhiri, A., Houot, O., Weilman-Bednawska, M. & Siest, G.
(1985) Clin. Chem. 31, 109-112.
16. Green, D. J. & Perlman, R. L. (1980) Clin. Chem. 26, 796- 17. Bennett, M. J., Patchett, B. R & Worthy, E. (1984) Med.797.
Lab. Sei, 41, 108-111.
18. Topp, H., Sander, G., Heller-Schoech, G. & Schoech, G.
(1985) Anal. Biochem. 150, 353-358.
19. Sotp-Otero, R., Mendez-Alvarez, E. & Sierra-Marcuno, G.
(1986) Anal. Letters 19, 1107-1119.
20. Krstulovic, A. M., Bertani-Dziedzic, L. A., Gitlovv, S. E.
& Lohse, K. (1979) J. Chromatogr. 164, 363-372.
21. Niklasson, F. (1983) Clin. Chem. 29, 1543-1546.
22. Siekmann, L., Siekmann, A., Mackrodt, D. & Johnen, C.
(1986) Fresenius Z. Anal. Chem. 324, 279-280.
23. Siekmann, L. (1985) J. Clin. Chem. Clin. Biochem, 23, 129-135.
24. Ziegler, J. M., Houot, O., Hernot, M. & Siest, G. (1985) Clin. Chim. Acta 147, 135-143.
25. Siekmann, L. & Breuer, H. (1982) J. Clin. Chem. Clin.
Biochem. 20,883-892.
26. Kojima, T., Nishina, T., Kitamura, M., Kamatani, N. &
Nishioka, K. (1986) Clin. Chem. 32, 287-290.
27. Sakuma, R., Nishina, T. & Kitamura, M. (1987) Clin.
Chem. 33, 1427-1430.
28. Hände, K. R., Perini, F., Putterman, G. & Elin, R. (1979) Clin. Chem. 25, 1492-1494.
29. Stamm, D. (1982) J. Clin. Chem. Clin. Biochem. 20, 817- 824.
30. Stamm, D. (1979) J. Clin. Chem. Clin. Biochem. 17, 283- 31. Büttner, J., Borth, R., Boutwell, J. H., Broughton, P. M.297.
G. & Bowyer, R. C. (1979) Clin. Chim. Acta 98, 129F- 143F; (1980) J. Clin. Chem. Clin. Biochem. 18, 69-77;
78-88.
32. Büttner, H. (1976) Pure Appl. Chem. 45, 69-73.
33. Grootveld, M. & Haliwell, B. (1987) Biochem, J. 243, 803 - 34. Maples, K. M. & Mason, R. P. (1988) J. Biol. Chem. 263,808.
1709-1712.
Prof. Dr. Dr H. Greiiing Institut für Klinische Chemie und Pathobiochemie
Medizinische Fakultät der RWTH Aachen Pauwelssstraße
D-5100 Aachen
J. Clin. Chem. Clin. Biochem. / Vol. 27,1989 / No. 3