Passing, Bablok and Glocke: The establishment of assigned values, Part IV 1157 J. Clin. Chem. Clin. Biochem.
Vol. 19,1981, pp. 1167-1179
An Optimized Design for the Establishment of Assigned Values in Control Sera
1) The Establishment of Assigned Values in Control Sera, IV
ByH. Passing
Hoechst AG, FOB 800 320, D-6230 Frankfurt (M) 80, Federal Republic of Germany, W. Bablok and M Glocke
Boehringer Mannheim GmbH, Sandhofer Straße 116, D-6800 Mannheim 31, Federal Republic of Germany (Received February 23/July 15, 1981)
Summary: From the study described in part 1 of this series (Passing, H. et al. (1981), this j. 19,1137-1144) it has been derived in part 3 (Passing, H. (1981), this j. 19, 1153-1166) that 6 reference laboratories are appropriate for the establishment of assigned values and their uncertainty intervals in a control serum. From the same study the two out- standing characteristics of an optimized design are found: It is sufficient that each reference laboratory performs single determinations within independent series. The number of series however has no relevant influence on accuracy and pre- cision of the assigned values. The following design is obtained: Six reference laboratories perform single determinations in five independent series each. Additionally, the complete concept of establishment of assigned values is summarized.
Up to now, the model has met the expectations in practice.
Ein optimierter Meßplan für die Ermittlung von Sollwerten in Kontrollseren Ermittlung von Sollwerten in Kontrollseren, IV.
Zusammenfassung: Von der in Teil l (Passing,H. et al. (1981) this j. 19,1137-1144) dieser Reihe beschriebenen Studie wurde in Teil 3 abgeleitet (Passing, H. (1981) this j. 19, 1153-1166), daß zur Ermittlung von Sollwerten und Soll- bereichen eines Kontrollserums 6 Referenzlabors angemessen sind. Von derselben Studie werden die beiden noch aus- stehenden Charakteristika eines optimierten Meßplanes gefunden: Es reicht aus, daß jedes Referenzlabor Einfachbe- stimmungen in unabhängigen Serien durchführt. Jedoch beeinflußt die Anzahl der Serien die Richtigkeit und Präzision des Sollwertes nicht relevant. Man erhält folgenden Meßplan: Sechs Referenzlabors führen jeweils Einfachbestimmungen in fünf unabhängigen Serien durch. Darüber hinaus wird das gesamte Sollwertermittlungskonzept zusammengefaßt. Bis heute hat das Modell die gesetzten Erwartungen in der Praxis erfüllt.
Introduction The number of independent series per laboratory and the number of replicate determinations within series.
This paper is the immediate continuation of I.e. (3). Two
problems are to be dealt with jointly: First, how to It was our intention (2) to investigate the influence of evaluate the assigned value of a control serum and its different designs in order to elaborate a model which uncertainty interval, and secondly, how to define an opti- gives accurate assigned values for acceptable expendi- mized design. An appropriate distribution-free evaluation ture, resulting in a high degree of security. Security is procedure has already been derived (3). used here in the sense of avoiding difficulties or legiti-
mate complaints with respect to recovery of assigned Moreover, six laboratories have been shown to be appro--
vai
Ue
S. This idea leads to an optimized design. Our priate to an actual establishment of assigned values. Two
modelobtained in I.e. (2, 3,4) and in the present paper further characteristics of the design are still undefined:
issujnmarized. It is compared with other models for
x
) A preliminary report is given in I.e. (1) the establishment of assigned values, cf. I.e. (5,6, 7).
0340-076X/81/0019-1167S02.00
© by Walter de Gruyter & Co. · Berlin · New York
1168
Passing, Bablok and Glocke: The establishment of assigned values, Part IVMaterials and Methods
The data of the study performed by laboratories of members of the Verband der Diagnostica- und Diagnosticager te- Hersteller (VDGH, Association of Diagnostics and Diagnostics Instrumentation Manufacturers) (2) formed the experimental basis. The study covered the constituents creatinine, glucose, urea, alanine and aspartate aminotransferase2), creatine kinase2), and 7-glutamyltransferase2). For each constituent we had 9 to 11 laboratories (see table 1) each having performed double determi- nations in approximately 18 independent series of the unknown sample, of the known control, and of a blind control. But we processed only the first 15 series of the unknown sample which had met the respective validity criterion as given in I.e. (4).
From these data we simulated various designs. As a conse- quence of the results obtained in I.e. (3) we restricted our- selves to all designs consisting of
1 = 6 laboratories, J = 4,5,7,10 or 15 series, K = 1 or 2 determinations per series.
For each such design several selections of 6 out of Imax3) laboratories were randomly performed thus yielding a total set of randomizations. The number T of these individual randomization steps is given in table 1. The first J valid series were used, and for K = 1 we used the first values only of the double determinations thus simulating single determinations.
For details see I.e. (3).
The assigned value arid its uncertainty interval based on the respective design and randomization are evaluated according in the following procedure4). The data of K determinations each within J series out of 6 laboratories are sorted. The total number of available values is then n = 6 · J- K. From n we derive m = 5 n/100 which is rounded off. m of the n values are trunc- ated so that the range of the remaining values is as short as possible. The extreme values of the remaining ones are the uncertainty limits. The median of the remaining values is the assigned value. This procedure has been shown to be superior (3).
We computed two objective quantities for each design and each randomization:
- The assigned value, and
- the width of its uncertainty interval.
Especially for I = Imax, J = 15, and K = 2 the assigned value is called the reference assigned value (3). The reference
Tab. 1. Number T of replications of individual randomization steps.
Constituent In
Creatinine Glucose
UreaAlanine aminotransferase Aspartate aminotransferase Creatine kinase
7-Glutamyltransferase
99 119 119 9
1112 6511 6611 12
a) number of laboratories underlying this study.
2) Enzymes: Glutamate-pyruvate-transaminase = alanine amino- transferase = £-alanine: 2-oxoglutarate aminotransferase, EC 2.6.1.2;glutamate-oxalacetate-transaminase = aspartate amino- transferase = //-aspartate: 2-oxoglutarate aminotransferase, EC 2.6.1.1;7-glutamyltransferase = (5-glutamyl)-peptide: amirio- acid 5-glutamyltransferase, EC 2.3.2.2; creatine kinase = ATP:
creatine N-phosphotransferase, EC 2.7.3.2.
3) Imax depends on the respective constituent and is identical to the number of laboratories underlying this study, see table 1.
4) Called procedure 2 in I.e. (3).
assigned value and its uncertainty interval are used as reference quantities.
The distribution of the results of all individual randomization steps is plotted against J for K = 1 and K = 2. The judgement of plots is based on criteria concering primarily robustness and secondarily accuracy. Robustness is defined by the shape of the respective distribution by means of three properties: The distribution should be unimodal and non-uniform on both sides of the mode whereas the location of the mode is arbitrary.
Secondly, the distribution should be connected. Thirdly, it should have a small variation. Accuracy however relates to good concordance of the median of the distribution with the reference assigned value of the width of its uncertainty inter- val, respectively. The judgement is performed by giving scores 2, l,orO:
Score 2
The results of the simulation show high robustness and good concordance except for at most one for T«» 12 or at most five for T « 66 randomizations. Concordance is called good if the median of the distribution of assigned values differs from the reference assigned value by less than one in the last relevant decimal place given by the respective analytical method. As to the widths, concordance is called good if the median of the distribution of the widths differs from the width of the uncer- tainty interval of the reference assigned value by about 8% or less, cf. I.e. (3).
Score 1
The results of the simulation show sufficient robustness whereas their concordance may be less.
Score 0
The results of the simulation do not show sufficient robustness.
The scores are summed up over all constituents.
The scores are not based on additional quantitative criteria since the definition of robustness cpvers several aspects. But by comp^
aring 10 distributions (J = 4, 5, 7,10, 15 for K> 1, 2) of each objective quantity and each constituent the scores are given simultaneously and relatively to each other in order to keep the subjective influence down and to obtain a correct ranking. This influence is also diminished by summing up the scores.
We focus our attention on designs covering 5 series at most in order that the number of series is less than the number of labor^
atories (=6). Therefore, out of all designs covering 5 series at most the design yielding the largest sum of scores is the best one.
By this methodological approach we arrive at an optimized design. The sum of scores of the other designs (J > 7) gives an empirical assessment of whether the limitation to J < 5 being theoretically motivated is justified.
Results
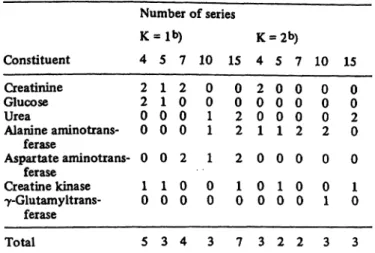
Figures 1 to 7 show the distribution of assigned values and their percentage deviation from the reference assigned value as obtained from the individual randomi- zation steps. The judgement of each figure is given in table 2.
The judgement of figure 1 is described in.detail. The median of 9 out of 10 distributions of creatinine varies between 309.5 and 310.5 ìôçïú/É where 310 ìôçïÀ/l is the reference assigned value. So the criterion of concord- ance is fulfilled here. The distributions accQ^ding to J = 4 and J = 7 series have the smallest variation when
J. Clin. Chem. Clin. Biochem. / Vol. 19,1981 / No. 12
Passing, Bablok and Glocke: The establishment of assigned values, Part IV 1169
«JCRO- flOL/L X
313- 310- 307- 304-
0.97- 0.00- -0.97- -1.94-
XX
XXX :
SMKXX — XX
-
4 ß XXX
BKXXXXX X X
-
• XXXX 9KXKX*
X X
-
I XX QK*X*
XX X X
3 1 XX
lK^
Xx
X
— SERIES
>
H I C R O - flOL/L X
313- 310- 307- 304-
0.97- X *
o.oo-
-0.97- .-1.94-
JL---
XwX
X
_ XXX
XX X 4 Ý
rfWwttf
T*
X X
1 XX
X X X
XXXX
XXX
X 3 IS
Fig. 1. Creatinine: Distribution of all assigned values and their percentage deviation from the reference assigned value as obtained from T individual randomization steps, cf. table 1.
Plotter printout
Left ordinate: Creatinine [ìðéïÀ/À].
Right ordinate: Deviation [%).
Abscissa: Series no.
The upper plot is based on the first values only (K = 1), the lower one on both values of the double determinations (K = 2).
For each number of series used during the simulation each individual assigned value is marked by a star. The median of each distribution is marked by o. The horizontal dashed lines give the reference assigned value. For K = 2 and 15 series the median and the dashed line need not coincide because six laboratories only are involved here.
MHOL/L '/.
12.3- 12.2- 12.1- 12.0- 1 1 . 9 -
0.82- 0.00- -0.82^
-1.64- -2.46-
-
9KXXXXXX xxxxx
-
-
4 ^
-
CDKXXXXXX
X
-
X
KXXXXXX- — X
XX X
-
X
^*****- -
X XXX
-
10 I XXX X E*X*X-
X X XX
— Qfrp r F<?
t
MHOL/L '/.
12.3- 12.2- 12. Ir 12.0- 1 1 . 9 -
0.82-
O . O O r
-0.82- - 1 . 6 4 - -2.46- 4
XX
r*^ — ~ —
DKXXXXXXX
X
-
5 XX
o******** -
-
X
X X
BKXXXX
XX XX X
- 1
XX XX
3**** —
XX X X
- KXXX
DKX*X-
XX XX
<5FR Ã PS 3 IS
Fig. 2. Glucose: Distribution of all assigned values and their percentage deviation from the reference assigned value as obtained from T individual randomization steps, cf. table 1.
Plotter printout
Left ordinate: Glucose [mmol/1].
Right ordinate: Deviation [%}.
Abscissa: Series no.
For details see figure 1.
J. din. Chem. Glin. Bipchem. / Vol. 19,1981 / No. 12
1170
Passing, Bablok and Glocke: The establishment of assigned values, Part IVflttOL/L × 13. 3- 13.2- 13.1- 13.0- 12.9- 12.8-
I.S4- 0.77- 0.00- -0.77- -1.54- -2.31- 4
X X
-XXX —
2*
xxxxx -
d
XX
- OKXX* - --
X
xxxx -
*
XX
.
X
-XX- —· — ^·
-
XX X
XX -
1
-
XX
9KXX* — -^ r
XX XXX
o" i
-XX
E*xxx-
XXX X X
>
nnoL/L y.
13.3- 13.2- 13.1- 13.0- 12.9- 12.8-
1.54- 0.77-
o.oo- -0.77- -1.54- -2.31-
<
X X
-X — — — —
XX -
DKXXXX X
^
XX
-
XXX- —
- EDKXXXX
X
× ô
÷
-XXX
(DK - xxxxx
-
1
-
XX -XX X CXX
XXX X
3 l XX
^ifwwy
xxxx
X
r SERIES
Fig. 3. Urea: Distribution of all assigned values and their percentage deviation from the reference assigned value as obtained from T individual randomization steps, cf. table 1.
Plotter printout
Left ordinate: Urea [mmol/lj.
Right ordinate: Deviation {%].
Abscissa: Series no.
For details see figure 1.
Fig. 4. Alanine aminotransferase: Distribution of all assigned values and their percentage deviation from the reference assigned value as obtained from T individual randomization steps, cf. table 1.
Plotter printout
Left ordinate: Alanine aminotransferase [U/1J.
Right ordinate: Deviation [%}.
Abscissa: Series no.
For details see figure 1.
Fig. 5. Aspartate aminotransferase: Distribution of all assigned values and their0percentage deviation from the reference assigned value as obtained from T individual randomization steps, cf. table 1.
Plf\tto»r T*rtntrk»it
Plotter printout
Left ordinate: Aspartate aminotransferase [U/1J.
Right ordinate: Deviation \%\.
Abscissa: Series no.
For details see figure 1.
J. Clin. Chem. Clin. Biochem. / Vol. 19,1981 / No. 12
Passing, Bablok and Glocke: The estab shment of assigned values, Part IV
1171
BBS,
SJI
é é -
. ê.
: Î
0?J
01UJ CO
*',·',.
é i-Uii
= J I I*» ss
é ·- éIlii s
CM — ï -^ CM
^
5< CM *· ï ·— CM
01 - ° ô r
j in co — «* r^
a ^ 10 co CM —
=» (0 U> CO CO CO
•U
• BE;
I T
.1.
.. SSi.
: .11
Ë 4. ß
X CM *^ 0 04 — 0
<o UJ
o:UJ
co
8.4.. .
LsJ ...
1 1
SiJ-.S
= ii l
•i:.£
" CM
— CM^- CJ 1 1
j éü i ^ ·* «7
= S S S S 5
Å if>|
• S
1I f
æ
f|
•
2
I»
mm 5*
Í
| i
|
• 5
ô Å
Hi*ô
|
•
s
. !.!
.s s;*
" 1 I
Í; CM ï10 Ï
— ï
_j U> 0
ï ï ï
É :
5Jij
•í 55 5
g!
1 '
. ÉßÀÇ
A » " · *
ihh
(0 CM
CM in
— CM1 1
ÉÏ Ï
o> <n
COUJ coUJ
f
[É I.| i
Eil ::
Ih h.
é É é é
I I Â
. 1 I
\\ i
L 1 1
I I 1 1
1
s é • é f ' s
\ ' 1
iliiL
»»&·&>·
' h ' '
i |
i é i ! : I I I
f ijigfi !:!
I 1 Ú 1
UJil
CO Ï (0 CM v; CM ï CM u>
— Ï — CM1 1
__i in ï ßï ï s ï ï ó> en
"* ^ ÃÏ ÃÏ COUJ COUJ
-
~
obL
J. Clin. Chem. Clin. Bi chem. / Vol. 19,1981 / No. 12
1172
Passing, Bablok and Glocke: The establishment of assigned values, Part IVU/L X 240- 233- 226- 219- 212- 205-
6.20- 3.10-
ï.ïï-
-3.10- -6.20- -9.30-
- _
×
×XX
Ë
÷÷÷÷÷ . "
4 ß
"
.
XX
÷
ô****
÷
-
÷
÷
÷ ïê÷÷
XX÷
1
÷
÷
-
÷ _
÷
*
- 3 1
÷
÷
÷*__
÷
5 U/L X
240- 233- 226- 219- 212- 205-
6.20- 3.10- ï.ïï- -3.10- -6.20- -9.30-
. -
÷÷
*« i
*
4 "Ý
- .
8"
÷"â"
× •
-
÷
Áé
÷÷*
÷-
÷ -
ß
ô!Ê×
É*
*
-
×
É*
XXX
÷
10 15
Fig. 6. Creatine kinase: Distribution of all assigned values and their percentage deviation from the reference assigned value as obtained from Ô individual randomization steps, cf. table 1.
Plotter printout
Left ordinate: Creatine kinase [U/l], Right ordinate: Deviation [%].
Abscissa: Series no.
For details see figure 1.
U/L 48.6- 48-3- 48.0-
ΑΙ "ί 4 / . /-
47.4-
U/L 48-6- 48.3- 48.0- ç «é4 / · /-
47.4- X 1 .89- 1.26- 0.63- Ï• UU-çç -0.63-
7.
1.89- 1.26- 0.63- Ï• UU-çç -0.63-
-
XXX -
÷ Ïê÷÷
÷÷÷÷÷
ß
XX÷ Ém
01
_
"÷ ^
÷÷÷÷ -
ß
-
XXX -
Ïê÷÷÷
÷
÷÷÷÷
÷
XX
«XXX•^ê
÷÷÷÷÷
!
-
*
*
XXâ^
0
"XX
÷÷÷÷
1
_ XX÷
-JKXj£
÷÷÷÷÷
1
-
÷÷
XX è£×
"*
÷÷÷÷÷
0 1
_
÷
1
÷÷
É÷÷÷
0 1
÷
÷*
÷
-m — · —÷
|××××
o E R J t o
>
÷÷ XX
÷
÷÷÷÷÷
o c K I c o 5
Fig. 7. 7-Glutamyltransferase: Distribution of all assigned values and their percentage deviation from the reference assigned'value as obtained from T individual randomization steps, cf. table 1.
Plotter printout
Left ordinate: ã-Glutamyltransferase [U/l].
Right ordinate: Deviation [%].
Abscissa: Series no.
For details see figure 1.
J. din. Chem. Clin. Biochem. / Vol. 19,1981 / No. 12
Passing, Bablok and Glocke: The establishment of assigned values, Part IV 1173 Tab. 2. Scores of plots of figures 1 to 7a).
Constituent
Number of series
4 5 7 10 15 4 5 7 10 15 Creatinine
Glucose
UreaAlanine aminotrans- ferase
Aspartate aminotrans- ferase
Creatine kinase ã-Glutamyltrans-
ferase Total
22 00 0 01
5 11 00 0 10
3 02 00 2 00
4 00
11 1 00
3 00 22 2 01
7 20 01 0 00
3 00 01 0 01
2 00 02 0 00
2 00 02 0 01
3 00 02 0 01
3 a) All distributions of each figure are compared simultaneously.
The meaning of the scores is given in Materials and Methods.
b) Using first values only (K = 1) or both values K = 2) of the double determinations.
the first values only are used (K = 1) especially since by our definition the assigned value of up to one individual randomization step may be neglected. Moreover, these
two distributions are unimodal, not uniform, and con- nected. The distributions according to J = 4, K = 1 and J = 4, K = 2 are nearly identical. Consequently, the score 2 is given to them. The median of the distribution according to j = 5 and K = 1 is 311 ìôçïÀ/À and therefore less concordant with the reference assigned value, and this distribution is less sharply one-peaked resulting in the score 1. All the other distributions have a larger variation or are multi-peaked and obtain score 0.
It should be stressed here that all distributions to be compared are derived from the same randomizations.
That is why differences between distributions are not caused at random; rather they are caused by the various designs and the data themselves.
For each number of series the distribution based on first values only of the double determinations (K = 1) turns out to be at least as good as the distribution based on both values (K = 2).
Figures 8 to 14 show the distribution of widths of the uncertainty intervals of the above assigned values as obtained from the individual randomization steps.
niCRO-
HOL/L 65.0- 59.0- 53.0- 47.0- 41.0- 35.0-
*
-,
. XXXX
!Jix
"
XXX
s
-
÷
XXXÏê÷ -
XXX
÷
÷
-÷
-_÷÷
ñê÷ ÷
XX÷
÷
÷
é
-
÷
XX 3)|÷
XX
÷
_÷
-÷— —
÷
û**
÷XXXX
÷
— .ò FR r FS
ï is
MJCRO- MOL/L 65 .0- 59.0- 53.0-
•47 .0- 41.0- 35.0-
-
xxx 1 ðß* Ix
÷
÷
•^s
-
DKXXXXX XX
É ÷
É
÷
XX0« "~ ^"
XX
÷ ÷
÷
÷
-2Ñ1×
XX÷
÷
÷
•
10 1
÷
_*
Æ$÷÷÷÷
XX
÷
: — SERIES
5
Fig. 8. Creatinine: Distribution of the widths pf the uncertainty intervals of the assigned values shown in figure 1; for details see there.
Plotter printout
Ordinate: Creatinine [ìðéïÀ/À].
Abscissa: Series no.
J. Oin. Chem. Clin. Biochem. / Vol. 19,1981 / No. 12
ß 1174
Passing, Bablok and Glocke: The establishment of assigned values, Part IV«HOL/L É . ä- 1. 4- 1.3- 1.2- l.l- 1.0-
'
"
X
-
!)KXXXXXXXXX - X
s
n
xxx
-
Q)KXXXXXXX X
"
XX XX
DKXXXXXX
X
1
2*xr· .
XXX
-
•
0 1
DKXXXXXXXXX X
>
HHOL/L 1 .ä- 1 .4- 1.3- 1 .2- l .1- 1 .0-
"
DKXXXXXXX
X XXX
- s
-
XXXXX -
!>ê÷÷
XX*
X
~
DKXXXXXXX
XX
- -
1 XX
XX
÷ - - - d é
wwwwww
b
xxxxxx>
Fig. 9. Glucose: Distribution of the widths of the uncertainty intervals of the assigned values shown in figure 2; for details see figure 1.
Plotter printout
Ordinate: Glucose [mmol/1].
Abscissa: Series no.
miOLy é Ô- É . ä- 1. 3- 1 .É- Ï. 9-
4
HMOL ) ^ _
É . ä- 1. 3- 1 .É- Ï. 9- 'L
Ïê÷÷÷÷÷÷
×
×
×
×
'L
Ïê÷÷ê÷÷
XX
÷ ÷
-
-
4 ß
Ïê÷÷÷÷÷÷
XX÷
÷
-
WWWW ,. _„ J
DKX
÷
XX XX
•
-
é
DKXXXXX
XX
÷
÷
÷
Âê÷÷÷÷÷÷÷ ^
÷ -
XX
-
-
10 1
DKXX÷
XX XX
- - é
DKXXXXX XX - XX
÷
- -
0 á 1
DKXXXXXXXX
XX
SERIES
DKXX XXX
÷
>
Fig. 10. Urea: Distribution of the widths of the uncertainty intervals of the assigned values shown in figure* 3; for details see figure 1.
Plotter printout Ordinate: Urea lmmol/11.
Abscissa: Series no.
J. Oin. Chem. Clin. Biochem. / Vol. 19,1981 / No. 12
Passing, Bablok and .Glocke: The establishment of assigned values, Part IV
1175
U/L 9.8- è.è- -7.8- 6.8- 5.8- 4.8- t U/L 9.8- 8.8- -7.8- 6.8- 5.8- 4.8-
<
ras.
»·1·Ì·
Ééðïçðçç -
».
raB
^
—«
•t""" — —
ìÉÃ
1"
a«·
gMM.1
-
S
ÚÊÇ.
S^ «...
-
-
*
-
ÇÌÌÌ••n····
«H-
MMM···
F «
-
*
-
l·· iSK- f·
••••n··
•
l
-
1 :
S
-
1
gnus
MIH"
B'"
v··
•
0 1
t h.. !*
m
-
0 1
Hin·.·
f;:™. i...
D·«
— S E R I E S
• JtHII·•B··
ß- HI ••i·
*
. · S E R I E S
>
Fig. 11. Alanine aminotransferase: Distribution of the widths of the uncertainty intervals of the assigned values shown in figure 4;
for details see figure 1.
Plotter printout
Ordinate: Alanine amin ï trans ferase (U/1J.
Abscissa: Series no.
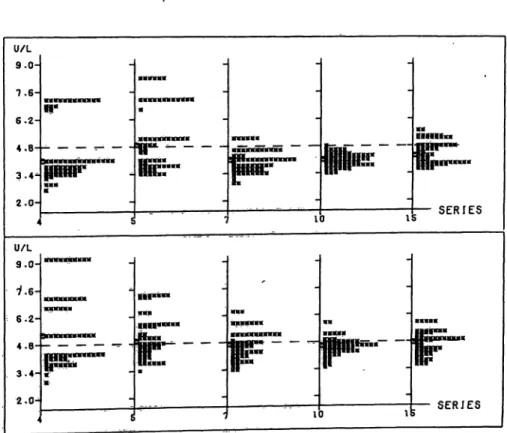
U/L 9.0- T.6- 6.2-
3 . 4 ^
2.Ï- SERIES
U/L 9.0-
6.2- 4 . B - - 3.4- 2.0
ÉÏ
ilMM
SERIES
Fig. 12. Aspartate aininotransferase: Distribution.of the widths of the uncertainty intervals of the assigned values shown in figure 5;
fpr details see figure 1.
Plotter printout
Ordinate: Aspartate aminotransferase [U/1J.
Abscissa: Series no.
J. CUn. Chem. Clin. Biochem.,/ Vol. 19,1981 / No. 12
f 1176
Passing, Bablok and Glocke: The establishment of assigned values, Part IVU/L 103.0-
90.0- 77.0- 64.0- 51.0- 38.0- 4 U/L 103.0-
90.0- 77 .0- 64.0- 51.0- 38. 0- 4
^ -
m*
-xxx~
9
"g
å -
xxxxx 2*XXX
I
-
•
s
- - (DKXxxxx
»X XX
—
-
'
- JgXXXX
I i
-
-
"i
•
[#•1 -÷÷-
1*
"
.-
1
- D*
WK
X
-
-
1
- QKxXXX
X
X
"
-
0 l
xxxxx
XX
1
X
-
-
) l _JKXX Six
XX
X
X
\
*****
XX
*
X
P CD r r*c
Fig. 13. Creatine kinase: Distribution of the widths of the uncertainty intervals of the assigned values shown in figure 6; for details see figure 1.
Plotter printout
Ordinate: Creatine kinase [U/l].
Abscissa: Series no.
U/L 6.7- 5-8- 4«?lQ- 4.0- 3.1- i U/L
6.7- 5.8- 4« Ú»Q-
4.0- 3-1-
- -
XXXXX _ QgXXXX
.X
i
_
. xxxxx
33****
X
{
-
xxxx DK****. XXX
'
^ .
XXX XX' ' Bgxxxx
X
1
-
XXX
^ilx _
l _ xxxxxx
9
XX XXX X
- 1
r
XXX
°Ñê _
) 1 _ XXX
.
DKXXX
11*
-
• -
ï" é
i«-JWUT ^~
X
.- o t R J t o 5
<
'-
X
.
GKXXx X
)
Fig. 14. T-Glutamyltransferase: Distribution of the widths of the uncertainty intervals of the assigned values shown in figure 7;for details see figure 1.
Plotter printout
Ordinate: ã-Glutamyltransferase [U/1J.
Abscissa: Series no.
J. din. Chem. Clin..Biochem. / Vol. 19,1981 / No. 12
Passing, Bablok and Glocke: The estabushment of assigned values, Part IV
1177 The judgement of these figures is given in table 3.
Tab. 3. Scores of plots of figures 8 to 14*).
Number of series
Using the sum of scores given in table 4 it cannot be decided however which of the designs covering either 4 or 5 series is better. But tables 2 to 4 show no relevant improvement of the distributions if the number of series increases.
Constituent 4 5 7 10 15 4 5 7 10 15
Creatinine Glucose
UreaAlanine aminotrans- ferase
Aspartate aminotrans- ferase
Creatine kinase Y-Glutamyltrans-
ferase
01 01 0 00
10 01 0 02
01 11 1 00
01 01 1 00
02 01 0 01
01 01 0 00
20 01 0 01
01 00 1 00
01 20 2 00
01 01 1 02
Total 2 4 4 4 2 4 2
a) see table 2 for explanations.
The distribution based on first values only (K = 1) is roughly as good as the distribution based on both values (K = 2). The sum of the scores of all figures is given in table 4 showing that the distribution based on first values only is at least as good as that one based on both values. This statement holds in particular for those designs with 5 series at most.
Tab. 4. Sum of scores of all figures.
Number of series
10 15 4 10 15
8 11
a) see table 2 for explanations.
Discussion
Consequences of the simulation
The distribution of the results of the simulation based on first values only is at least as good as the distribution based on both values. Therefore it can clearly be stated:
Single determinations within series are sufficient for the establishment of assigned values. This conclusion is satis- factory with respect to the analytical expenditure. It confirms a result (2) from quite another point of view.
So we restrict ourselves to single determinations.
The judgement of figures does not give a decision for the choice of the numbers J of series. The median and the minimal and maximal values qf the plotted distributions of the assigned values do not differ for varying J from a practical point of view, except for creatine kinase.
There is often a trend to increasing widths when J is enlarged. This fact is also theoretically expected at least for small J. But the range of the widths of the uncertainty intervals computed from 6 laboratories selected at random does not contract in general if J increases, cf.
table 5. Therefore it must be concluded from our judge- ment and from a practical point of view, too, that the number J of series obviously does not influence the accuracy and the precision of the assigned value for J>4.
It is reasonable to restrict J to 5 at most a priori on the following consideration. The accuracy and the precision of the assigned value is influenced most by the variation of accuracy between laboratories because in most cases this variation is larger than the variation between series or within series (4). Consequently, the number I of laboratories involved should be larger than the number
Tab. 5. Range») of widths of uncertainty intervals using first values only of the double determinations.
Constituent Creatinine Glucose
UreaAlanine aminotransferase Aspartate aminotransferase Creatine kinase
-ã-Glutamyltransferase
Number of series 4 5 140.3
0.55.1 384.6
1.5
170.3 4.90.4 194.9
2.2
7 270.3
0.63.9 252.3
1.4
10 200.2
4.70.3 371.4
1.5
15 180.2
0.24.3 382.0
1.2
unit ìÀôéï1/1 mmol/1 mmol/1 U/lU/l U/lU/l a) Range refers to the difference of the largest and the smallest widths of uncertainty intervals computed from 6 laboratories
selected at random.
J. Clin. Chem. din. Biochem. / Vol. 19,1981 / No. 12
1178
Passing, Bablok and Glocke: The establishment of assigned values, Part IVJ of series. In other words, large numbers of J cannot refine the accuracy and the precision of the assigned value for a fixed number of laboratories. This theoretical consideration is confirmed by our simulation as stated above. So it is reasonable to restrict the number of series to J < 6. More than 5 independent series will not yield more accurate and precise assigned values.
Since the results of the simulation do not differ essen- tially for J = 4 and J = 5 we can be sure that J = 5 is too large rather than too small. So we propose to perform 5 independent series. This is an acceptable experimental expenditure which can be handled within one week.
We.have simulated balanced designs only i.e. an equal number of series and of replicate determinations within each reference laboratory was used. Yet, the variety of other designs has not been studied. Therefore, the extent to which accuracy and precision of the assigned value are influenced cannot be assessed if an unequal number of series or of replicate determinations within laboratories is processed.
Discussion of criteria for judging plots
Each random selection of I laboratories out of our pool of I
maxlaboratories corresponds to the participation of certain I reference laboratories in the case of an actual establishment of assigned values. Therefore, each assigned value obtained from an individual randomization step corresponds to an assigned value actually established. It must be expected that approximately the same results would be obtained if actually other laboratories parti- cipated. Therefore, the distribution of the results of the simulation depending on the reference laboratories in- volved should be small and unimodal. A uniform distribu- tion however would imply that each figure within a cer- tain range can be obtained with equal probability as an assigned value or as the width of its uncertainty interval.
An unconnected distribution consists of two partial distributions being superposed but distinctly separated.
It indicates essential differences of accuracy or precision between all available laboratories.
The idea of our criteria for judging the plots is to distinguish those designs which are as robust as possible against the effects just described. The criterion of con- cordance has already been used (3). There it was dis- cussed why concordance is weighed less than robustness.
The complete model
We summarize the results of all four papers of this series to the following model.
Structure of the experiment
The project supervisor issues a blind control and the un- known sample, assigned values of which are to be deter-
mined by six reference laboratories. Each reference laboratory performs single determinations within five valid (see below) independent series each containing both sera and the internal quality control. A series and thus the pertaining value of the unknown sample is found valid by the project supervisor if the values of the internal control as well as of the blind control of this series are within the respective uncertainty intervals given by the manufacturers. Additionally, the project supervisor may perform other checks which may lead to the exclusion of all values of a laboratory. For safety reasons he may prescribe a larger number of series per laboratory or in- volve more than six reference laboratories in order that at least six laboratories each with five independent series will pass the validity check. Then it may happen that more than five series or even more than six laboratories pass the validity checks.
Evaluation procedure for the unknown sample An equal number (> 5) of valid values of each laboratory is processed. If a laboratory performs more valid values than another one so that its values cannot be processed in total the values of the last valid series are neglected.
All permissible values of the laboratories are sorted. Out of them the smallest or the largest value (i.e. about 5%
of all permissible values) is eliminated so that the range of the remaining values is as small as possible
5). Out of these remaining values the median gives the assigned value and the two extreme values give the limits of the uncertainty interval.
Comparison with other models
Our design is in concordance with the NCCLS-design (5) concerning the number of laboratories and of series.
But it covers an additional quality control of the data by means of a blind control. Our evaluation procedure however is distribution-free in contrast to the statistical procedure (5). Moreover, we formally give a prediction interval whereas a confidence interval is computed iii I.e. (5)
>»
The model in I.e. (6) covers three laboratories each with double determinations within 15 or 10 independent series depending on whether the sample is lyophilized or liquid. The evaluation procedure is similar to ours. Both techniques are distribution-free. They differ with respect to the calculation of the assigned value only.
The model in I.e. (7) covers 10 laboratories each with two values independently of the arrangement of these two values. The statistical evaluation is based on a normal distribution model. A prediction interval is calculated in concordance with our procedure.
5) If actually more than 40 values are to be processed two of them are truncated in an analogous manner, and so on. See Materials and Methods.
J. CHn. Chem. din. Biochem. / Vol. 19,1981 / No. 12
Passing, Bablok and Glocke: The establishment of assigned values, Part IV 1179
Both models (6, 7) do not employ a blind control.
The performance either of double determinations of the unknown sample only or of single determinations of the unknown sample and additionally of the blind control results in the same analytical expenditure.
But it has been shown (2) that the blind control has a greater control effect concerning elimination of laboratories than has the double determination.
The boundary values of the number of laboratories and of series used in the simulation were defined by the numbers of the models (5,6,7). We started at 4 series however since two values only do not allow an assessment of the accuracy of a laboratory.
Experiences up to now
The above model for the determination of assigned values has been applied in practice for about two years;
so far, at least 3200 assigned values have been deter-
mined. There were no difficulties or legitimate com- plaints with respect to recovery of assigned values.
Therefore, our optimized model has been proved to be adequate. We can state that it gives a high degree of security for acceptable expenditure.
Acknowledgements
This study was initiated by the Committee of Clinical Chemistry oftheVDGH.
The authors thank B. Müller (Behringwerke AG) for many hints, and for assistance in writing this paper. The determinations of the cited constituents were performed by G. von Seydlitz (Asid Bonz and Sohn GmbH), A Berke (Boehringer Ingelheim Diagno- stika GmbH), A. Benozzi, F. Bosslet, H. Brettschneider (all Boeh- ringer Mannheim GmbH), W. von Thun (Goedecke AG),
ff.-G. Eisenwiener (F. Hoffmann - La Roche & Co AG), B. Carl (Dr. Bruno Lange GmbH), F. Schindler (E. Merck), R. Spaethe (Merz und Dade, Abteilung der American Hospital Supply Deutschland GmbH, and D. Schlitzer (Technicon GmbH). The consequences from the results were drawn jointly by all participants.
References
1. Passing, H., Glocke, M., Brettschneider, H. & Müller, B."
(1980) Lab. Med. 4,154-159.
2. Passing, H., Müller, B. & Brett Schneider, H. (1981) J. Oin.
Chem. Clin. Biochem. 19,1137-1144.
3. Passing, H. (1981) J. Clin. Chem. Clin. Biochem. 19, 1153-1166.
4. Passing, H. (1981) J. Clin. Chem. Clin. Biochem. 19, 1145-1151.
5. National Committee for Clinical Laboratory Standards (NCCLS), Calibration reference materials and control materials in clinical chemistry (1975).
6. Hansert, E. & Stamm, D. (1980) J. Clin. Chem. Clin. Biochem.
/£, 461-490.
7. Schumann, V. (1976) Med. Lab. 29, 271-276.
For reprint requests:
Geschäftsstelle des
Verband der Diagnostica- und Diagnosticageräte-Hersteller (VDGH) Karlstr. 21
D-6000 Frankfurt l
J. Oin. Chem. Clin. Biochem. / Vol. 19,1981 / No. 12