RESULTS FROM THE OPTICAL REPLICA EXPERIMENT AT FLASH
J. B¨odewadt, S. Khan
∗, University of Hamburg, Germany
F. L¨ohl, E. Saldin, H. Schlarb, E. Schneidmiller, A. Winter, M. Yurkov, DESY, Hamburg, Germany M. Larsson, P. van der Meulen, P. Sal´en, FYSIKUM, Stockholm, Sweden
G. V. Angelova, V. Ziemann, UU/ISV, Uppsala, Sweden and A. Meseck, BESSY, Berlin, Germany
Abstract
Experimental results from the optical replica synthesizer (ORS) at FLASH (DESY, Hamburg) are presented. The ORS [1] is a novel method to determine the longitudinal structure of sub-ps electron bunches by creating a coherent optical pulse at 775 nm wavelength that has the same shape as the electron bunch and can be analyzed using a FROG (frequency-resolved optical gating) device. The ORS hard- ware was installed in 2007, comprising a Ti:sapphire laser system, two undulators and optical equipment. Duringfirst experiments, the spatial and temporal overlap of an uncom- pressed electron bunch and a 200 fs laser pulse in an un- dulator was achieved, modulating the electron energy and density. Coherent transition radiation from micro-bunched electrons was observed varying the timing between elec- trons and laser pulse and producing two-dimensional im- ages of slices within the electron bunch. In later experi- ments, laser pulses were overlapped with compressed elec- tron bunches in the undulator and coherent radiation from a second undulator was observed and analyzed using the FROG device.
INTRODUCTION
High-gain free-electron lasers (FELs) based on the prin- ciple of self-amplified spontaneous emission (SASE) such as FLASH [2] at DESY, LCLS [3] at SLAC or the Eu- ropean XFEL [4] require electron beams with high peak current. In FLASH, electron bunch trains (1-800 bunches, repetition rate 1-10 Hz, bunch charge 0.5-1 nC) from an rf photocathode gun are accelerated to 1 GeV by 1.3-GHz superconducting rf modules with two bunch-compression stages producing FEL radiation at a wavelengths down to 6.5 nm. The compressed electron bunches presently (i.e.
prior to the installation of a third-harmonic rf system in 2009) comprise a short head, a few 10 fs in length, and a 2 ps long tail. The spectral analysis of the radiation sug- gests a pulse duration of 10 fs [2]. To verify the theoretical understanding of the lasing process, it is important to de- termine the actual size and shape of the bunch, and several methods to this end have been devised.
Electro-optical sampling, in which the intensity of a laser pulse is modulated by a birefringent crystal (e.g. GaP) un- der the influence of the electricfield of a nearby electron bunch, has reached a time resolution of∼55fs [5]. Fur- ther improvement is inhibited by the velocity mismatch of
∗contact: shaukat.khan@desy.de
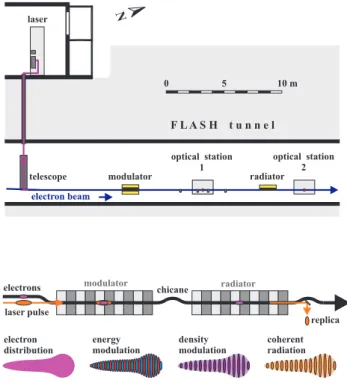
Figure 1: Technical layout (top) and principle (bottom) of the optical replica synthesizer: laser-electron interaction in an undulator causes an electron energy modulation, which is converted to a density modulation by a magnetic chicane and gives rise to a coherent radiation pulse that resembles the original electron distribution. The radiation pulse is ex- tracted and analyzed using a FROG device at the second optical station.
the laser pulse and the electricfield inside the crystal. Im- ages of bunches tilted by a transversely deflecting rf struc- ture reveal the longitudinal bunch shape and slice emittance with a time resolution of 20-30 fs (rms) [6]. The infrared spectrum of coherent transition radiation (CTR), diffrac- tion radiation or synchrotron radiation is proportional to the square of the Fourier-transformed longitudinal charge dis- tribution. The reverse Fourier transform does not uniquely determine the bunch profile, but assumed distributions that fit the measured CTR typically exhibit a 20 fs long spike [7].
A novel method to unambiguously determine the longi- tudinal bunch structure with a resolution of a few fs was proposed in 2004 [1]. The principle of this method, known as optical replica synthesizer (ORS), is illustrated by Fig. 1.
A laser pulse co-propagating with an electron bunch in an Proceedings of FEL08, Gyeongju, Korea THBAU04
FEL Technology
497
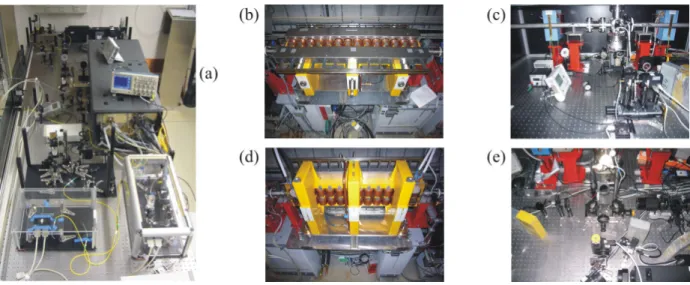
Figure 2: Photographs showing the laser system (a) with an Er-dopedfiber oscillator, amplifier and second-harmonic generation stage and a Ti:sapphire amplifier, the modulator (b), the optical station 1 (c) with two chicane magnets visible, the radiator (d) and the optical station 2 (e) with a CCD camera and the GRENOUILLE device (bottom right).
undulator (the ”modulator”) gives rise to a modulation of the electron energy with the periodicity of the laser wave- length. In a chicane formed by four dipole magnets, the energy-dependent path length causes a density modula- tion. The density-modulated bunch emits coherent radia- tion in a second undulator (the ”radiator”), which can be tuned to the laser wavelength or a higher harmonic thereof.
The coherent light pulse is a replica of the electron bunch (hence the name of the method) and its time structure can be uniquely determined in a single-shot fashion by a com- mercially available FROG (frequency-resolved optical gat- ing [8, 9]) device, which is essentially a combination of an autocorrelator and a spectrometer. The time resolution is given by the laser wavelength (775 nm corresponding to 2.6 fs) plus the slippage of the electrons in the undulator, i.e. one wavelength per undulator period. The effect of slippage may be reduced by an unfolding procedure. To- date, ORS is the only conceived method to uniquely deter- mine the longitudinal profile of sub-10 fs electron bunches in FELs. Need for non-destructive single-shot character- ization of ultrashort bunches also arises from upcoming novel acceleration schemes such as laser-plasma acceler- ation (e.g. [10]).
TECHNICAL LAYOUT
The installation at FLASH, completed in 2007 [11, 12], is the worldwidefirst and to-date only implementation of the ORS method. The laser system is located in a newly constructed building adjacent to the FLASH tunnel and is based on a commercial Ti:Sapphire regenerative amplifier (Clark-MXR CPA2001). However, the standard oscillator for this system has been replaced by a home-built Er-doped fiber oscillator operating at 1550 nm with a repetition rate of 54 MHz [13]. The oscillator pulses are amplified, com- pressed and subsequently frequency-doubled in a 1 mm
PPLN crystal before being injected into the amplifier cav- ity. The amplifier produces pulses of up to 800µJ in energy and, depending on the settings of the compressor, a dura- tion between 170 fs and 3 ps. The Er-dopedfiber oscillator is phase-locked to the rf system of FLASH with a timing jitter of approximately 50 fs. The arrival time of oscilla- tor pulses with respect to the electron bunch can be varied electronically using a vector modulator.
The amplified laser pulses are transported in air over a distance of 12 m using remotely controlled mirrors. Be- fore entering the FLASH vacuum vessel through a back- tangent window at a dog-leg chicane, the laser pulses pass a telescope with onefixed lens and two lenses on remotely controlled translation stages. Longitudinal lens movement adjusts the position and diameter of the laser waist at the modulator, the transverse degrees of freedom allow to cen- ter the laser beam on the lenses. A retractable mirror fol- lowing the telescope is used to send the focused laser beam back to the laser building for diagnostics purposes.
In a four-magnet chicane between modulator and radia- tor, the laser pulses are coupled out by a silver-coated sili- con screen which is normally used to produce optical tran- sition radiation (OTR), but acts as a mirror here. An opti- cal table (optical station 1, OS1) accommodates a camera, photodiodes and a power meter to analyze the laser pulses.
Both, the modulator and the radiator are electromagnetic devices with a magnetic gap of 40 mm,five 200 mm long periods and two additional poles at either end. The max-
imumfield is 0.45 T. The modulator deflects the electron
beam vertically, corresponding to the electric field of a vertically polarized laser beam, while the radiator deflects horizontally and produces horizontally polarized radiation.
This way, a polarizer can be used to reject background caused by scattered laser light.
Following the radiator, another magnetic chicane allows to displace the electron beam while coupling the replica THBAU04 Proceedings of FEL08, Gyeongju, Korea
FEL Technology 498
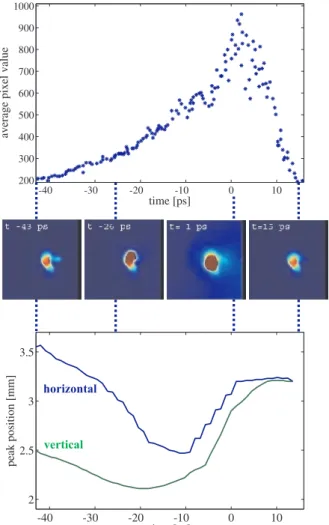
Figure 3: Optical transition radiation (OTR) from uncom- pressed bunches in FLASH after interacting with 200 fs laser pulses under variation of their arrival time. The OTR is dominated by a coherent component from an energy- modulated slice within the bunches. From the recorded im- ages (four examples are shown in the center), average pixel values (top) in a small region around the light spot and the horizontal and vertical spot position (bottom) as function of arrival time are derived.
pulses out, again using an OTR screen. If the chicane magnets are switched off, the density-modulated electron beam hits the screen producing coherent OTR. On a sec- ond optical table (optical station 2, OS2), the replica or OTR pulses can be sent either to a power meter, to a camera (Basler A311) or to the FROG device. The FROG used dur- ing commissioning was a GRENOUILLE [9, 14] (Swamp Optics 8-500USB) which is optimized for pulses of 0.5-5 ps duration. For future experiments, a model adapted to shorter pulses will be used. Figure 2 shows pictures of the laser system, of the modulator and radiator, and of the op- tical stations.
EXPERIMENTAL RESULTS
During first shifts in 2007, the hardware was com- missioned and laser-electron overlap was successfully achieved [15, 16]. For transverse overlap, the electron beam position on two OTR screens at either end of the modulator is determined and the laser beam is set to the same position using two mirrors. To view the laser beam, the OTR screens are replaced by a steel plate with a dif- fusely scattering surface, since OTR screens acting as mir- rors would produce an image with a source point else- where. Subsequently, temporal overlap is achieved by aligning laser pulses and synchrotron radiation from the modulator within the precision of a photodiode at OS1.
Next, the laser arrival time is varied until successful laser- electron interaction is detected either by coherent OTR or coherent synchrotron light from the radiator, which are both more intense that the respective incoherent radiation.
Infirst experiments, laser pulses of 200 fs duration were made to interact with uncompressed electron bunches of ps duration in order to facilitate the temporal overlap. In this case, the laser pulse defines a slice withing the electron bunch, in which energy modulation occurs, and the image of coherent radiation viewed by a camera corresponds to a tomographic picture of the bunch, which changes its inten- sity, size and position as the laser arrival time is varied. An example is shown in Fig. 3, where the arrival time was var- ied over 60 ps while taking images of OTR at OS2, which includes an incoherent component as well as coherent ra- diation at the laser wavelength and its harmonics. Here, the second harmonic was extracted using a bandpassfilter (BG39) to further suppress laser background. The average pixel value in a small region around the light spot is plot- ted as function of delay time, resembling the longitudinal bunch profile. The horizontal and vertical transverse posi-
−20 −10 0 10 20
0 100 200 300 400
time [ps]
signal [a.u.]
Figure 4: Square root of coherent-light intensity (black line) as described in the caption of Fig. 3 and longitudi- nal bunch profile obtained using a transversely deflecting rf cavity (blue dots).
Proceedings of FEL08, Gyeongju, Korea THBAU04
FEL Technology
499
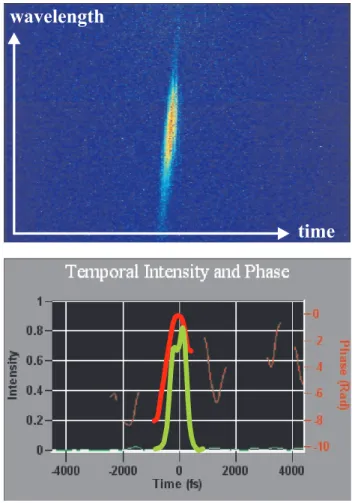
Figure 5: Intensity of a pulse from the radiator as func- tion of time and wavelength as measured by a FROG de- vice (”FROG trace”, top) and reconstructed temporal struc- ture (bottom) in terms of intensity (green) and phase (red), where the lines were redrawn for better visibility.
tion of the spot also varies with delay time, showing that the bunch has a nearly helical shape. Since the radiation inten- sity saturated the CCD camera, the information extracted from this experiment is of qualitative nature.
A non-saturated example from later experiments, using additional neutral-density filters, is discussed in [15]. In Fig. 4, the square root of the coherent-light intensity (which should be proportional to the bunch line density) is com- pared to the longitudinal bunch profile obtained using a transversely deflecting rf cavity [6] installed at FLASH. In general, the agreement is very good, and differences may be attributed to the fact that many bunches contribute to the coherent-light curve, whereas the transverse deflection yields a single-shot image of one bunch.
A similar experiment was conducted by tuning the ra- diator to the second harmonic of the laser wavelength and observing coherent undulator radiation on a screen at OS2, while a magnetic chicane guided the electron beam around that screen.
Scanning the laser arrival time and observing the bunch profile gives confidence in the ORS setup. As a next step
towards the actual purpose of the ORS, 200 fs long laser pulses were employed together with compressed bunches, where the width of the leading spike was of the order of 100 fs. Optimizing the spatial and temporal laser-electron overlap and carefully tuning the accelerator resulted in a coherent pulse energy of 10µJ, which was sufficient to ob- serve FROG traces. An example of a FROG trace, i.e. light intensity as function of time and wavelength, is shown in the top part of Fig. 5. From this trace, the FROG algorithm reconstructed the pulse intensity and phase shown in the lower part of thefigure. The apparent width of this pulse is about 500 fs, mainly given by the time resolution of the GRENOUILLE 8-500USB, which was used during com- missioning.
The final goal, to be pursued in upcoming shifts, is to produce FROG traces and corresponding time profiles us- ing a short-pulse GRENOUILLE model and demonstrate the superior time resolution of the ORS method.
ACKNOWLEDGEMENTS
It is a pleasure to acknowledge the help of the crew op- erating FLASH, the work done by the technical groups of DESY and the Institut f¨ur Experimentalphysik (University of Hamburg), and the support through the SU-UU-KTH FEL-center.
REFERENCES
[1] E. Saldin, E. Schneidmiller, M. Yurkov, DESY 04-126 (2004) and Nucl. Inst. Meth. A 539 (2005), 499.
[2] W. Ackermann et al., Nature Photonics 1 (2007), 336.
[3] The LCLS Design Study Group,LCLS Design Study Report, SLAC-R-593 (2002).
[4] M. Altarelli et al. (Eds.),The European X-ray Free Electron Laser. Technical Design Report, DESY 2006-097 (2006).
[5] B. Steffen at al., Proc. FEL’07, Novosibirsk, 310, and B.
Steffen, PhD thesis, University of Hamburg (2007), DESY- THESIS-2007-020.
[6] M. R¨ohrs, C. Gerth, H. Schlarb, Proc. FEL’06, Berlin, 300, and M. R¨ohrs, PhD thesis, University of Hamburg (2008).
[7] H. Delsim-Hashemi et al., Proc. FEL’06, Berlin 2006, 594, and H. Delsim-Hashemi, PhD thesis, University of Hamburg (2008).
[8] R. Trebino, D.J. Kane, J. Opt. Soc. Amer. A 10 (1993), 1101.
[9] R. Trebino, Frequency-Resolved Optical Gating, Kluver Academic Publishers, Boston 2000.
[10] W. P. Leemans et al., Nature Physics 2 (2006), 696.
[11] E. Saldin et al., Proc. PAC’07, Albuquerque, 965.
[12] G. Angelova et al., Proc. FEL’07, Novosibirsk, 438.
[13] A. Winter et al., Proc EPAC’06, Edinburgh, 2747.
[14] P. O’Shea, M. Kimmel, X. Gu, R. Trebino, Opt. Lett. 26 (2001), 932.
[15] G. Angelova et al., PRST-AB 11 (2008), 070702.
[16] V. Ziemann et al., EPAC’08, Genova, 1332.
THBAU04 Proceedings of FEL08, Gyeongju, Korea
FEL Technology 500