Novel in vitro model for combined effects of alcohol and free fatty acids on hepatocellular lipid accumulation and
inflammation
DISSERTATION
ZUR ERLANGUNG DES DOKTORGRADES DER NATURWISSENSCHAFTEN (DR. RER. NAT.) DER FAKULTÄT CHEMIE UND PHARMAZIE
DER UNIVERSITÄT REGENSBURG
vorgelegt von
Abdo Mahli
aus Aleppo, Syrien im Jahr 2013
Department of Internal medicine I at the University Hospital Regensburg from September 2009 to December 2013 under the supervision of Prof. Dr. med. Claus Hellerbrand
Die vorliegende Arbeit entstand unter der Anleitung von Prof. Dr. med. Claus Hellerbrand in der Zeit von September 2009 bis Dezember 2013 am Forschungsgebäude H1, Innere Medizin I, Klinikum der Universität Regensburg.
Date of colloquium: 18.12.2013 Board of examiners:
First Examiner: Prof. Dr. Sigurd Elz
Second Examiner: Prof. Dr. med. Claus Hellerbrand Third Examiner: Prof. Dr. Richard Warth
Chairman: Prof. Dr. Achim Göpferich
Because the liver is a source of many diseases, and is a noble organ that serves many organs,
almost all of them: so it suffers, it is not a small suffering, but a great and manifold one”
Theophrastus Bombastus von Hohenheim, known as Paracelsus (1493_1541)
I would like to express my thanks and appreciations to many people for contributing for the Happy End of my PhD thesis:
I would like to express my deepest sense of gratitude to Prof. Dr. med. Claus Hellerbrand for taking me as a PhD student and for his truly generous support during all those years, his continuous guidance, encouragement, excellent advices throughout this study and for his nice Valuation Score “A, B, C Note”.
I would like to thank Prof. Dr. Sigurd Elz, my supervisor at the Faculty of Pharmacy at Regensburg University, who has introduced me to Prof. Hellerbrand and for his truly generous support during my habilitation in pharmacy faculty to be an accepted PhD student.
I thank Prof. Dr. Richard Warth for his willingness to be the third Examiner.
I thank Prof. Dr. Achim Göpferich for his willingness to be the Chairman.
I would like to thank my colleagues in the lab Andreas Koch, Dr.Barbara Czech, Birgitta Ott-Rötzer, Dr.Christoph Dorn, Dr. Daniela Valletta, Heidi Gschwendtner, Jan-hauke wulf, Kornelia Elser, Marina Fink, Margit Nützel, Dr.Michael Saugspier, Monika Artinger, Sabine Kiessling, Sebastian Buschauer, Ruth Schewior und Dr. Thomas Amann for the wonderful atmosphere, for making me feel at home and specially for teaching me the nice Bavarian dialect.
A very big thanks to my family, especially my father Mohamed Bashier, my brothers and sisters for everything they have enabled me. Thank you for your understanding and support!
Most of all I want to thank you, my dear Ghalia!! It is very nice to have someone, who is always here for you and believe in you.
For the person who stay always in my Heart and Mind for ever ….
For him I am here searching the liver…..
For my warm liver……my affectionate Mother…...“Aysha Issmaail”
For her pure Soul ….I will search the liver FOR EVER …..
Table of Contents
1 Summary... 1
2 Introduction ... 3
2.1 Liver diseases ... 3
2.1.1 Definition and natural course of liver disease ... 3
2.1.2 Non-alcoholic fatty liver disease (NAFLD) ... 3
2.1.2.1 Definition... 3
2.1.2.2 Epidemiology of NAFLD/NASH... 4
2.1.2.3 Etiology and pathogenesis of NAFLD/NASH ... 5
2.1.2.4 Risk factors of NAFLD and NASH ... 5
2.1.2.5 Prognosis and therapy... 6
2.1.3 Alcoholic liver disease (ALD) ... 6
2.1.3.1 Definition... 6
2.1.3.2 Epidemiology and natural course of ALD………7
2.1.3.3 Pathogenesis of ALD ... 8
2.1.4 The epidemiology and clinical history of NAFLD and ALD co- morbidity... 10
2.1.5 The role of CYP2E1 in NAFLD and ALD... 11
2.1.5.1 Definition... 11
2.1.5.2 The role of CYP2E1 in the pathogenesis of NAFLD ... 12
2.1.5.3 The role of CYP2E1 in the pathogenesis of ALD ... 13
2.1.6 The role of autophagy in NAFLD and ALD... 14
2.1.6.1 Definition... 14
2.1.6.2 The role of autophagy in NAFLD ... 14
2.1.6.3 The role of autophagy in ALD ... 16
2.2 Aim of the thesis... 17
3 Materials and Methods ... 18
3.1 Chemicals and Reagents ... 18
3.2 Laboratory expendables... 19
3.3 Laboratory instruments ... 19
3.4 Buffers... 20
3.5 Cell culture ... 21
3.5.1 Cell culture medium ... 21
3.5.2 Cultivation of cell lines ... 21
3.5.3 Human hepatoma cell line ... 22
3.5.4 Isolation of primary human hepatocytes ... 22
3.5.5 Determination of cell number and viability ... 22
3.6 Isolation and analysis of RNA ... 23
3.6.1 RNA isolation and determination of RNA concentration... 23
3.6.2 Reverse transcription of RNA to cDNA ... 23
3.6.3 Quantitative real time polymerase chain reaction ... 24
3.7 Protein analysis... 26
3.7.1 Preparation of protein extracts ... 26
3.7.2 Determination of protein concentration ... 26
3.7.3 SDS polyacrylamid gel electrophoresis (SDS-PAGE)... 27
3.7.4 Western Blotting... 28
3.7.5 Analysis of cell culture supernatants... 28
3.8 Functional assays ... 29
3.8.1 Mitochondrial activity assay (XTT) ... 29
3.8.2 CYP2E1 activity (p-nitrophenol hydroxylation) ... 30
3.9 Lipid assays ... 30
3.9.1 Triglycerides (TG) assay... 30
3.9.2 Lipid peroxidation (TBARS assay) ... 31
3.9.3 Oil Red O staining... 31
3.10 Reagent preparation for in vitro experiments ... 32
3.10.1 Oleate preparation ... 32
3.11 Statistical analysis... 32
4 Results ... 33
4.1 Establishment an in vitro model for the combined effects of alcohol and FFA ……….33
4.2 Combined effects of alcohol and FFA on hepatocellular lipid accumulation ……….36
4.3 Combined effects of alcohol and FFA lipid peroxidation and inflammation ……….37
4.4 Role of CYP2E1 in joint effects of alcohol and FFA on lipid metabolism and pro-inflammatory gene expression... 39
4.5 Role of autophagy in joint effects of alcohol and FFA on lipid metabolism
and pro-inflammatory gene expression... 44
4.5.1 Inhibition of autophagy enhances the synergistic effects of alcohol and FFA on lipid accumulation, lipid peroxidation and hepatocellular inflammation... 46
4.5.2 Induction of autophagy blunted the synergistic effects of alcohol and FFA on lipid accumulation, lipid peroxidation and hepatocellular inflammation ……….47
5 Discussion... 48
6 References... 51
7 Abbreviations ... 61
8 Appendix ... 64
8.1 Curriculum Vitae... 64
1 Summary
Alcoholic steatohepatitis (ASH) and nonalcoholic steatohepatitis (NASH) are the most frequent conditions leading to elevated liver enzymes and liver cirrhosis, respectively, in the Western world. However, despite strong epidemiological evidence for combined effects of alcohol consumption and hepatic lipid accumulation on the progression of liver injury, the mutual interaction of the pathophysiological mechanisms is incompletely understood.
The aim of this study was to establish an in vitro model for joint effects of alcohol and lipids on hepatic steatosis and inflammation. Herein, we particularly wanted to assess the role of CYP2E1, which activates several hepatotoxins and contributes to alcoholic liver damage and the role of autophagy, which has been emerged as new mechanism for alcohol-induced liver injury. Initially, we established the dose range in which neither alcohol nor incubation with the free fatty acid (FFA) oleate affected viability or mitochondrial activity in primary human hepatocytes (PHH) and HepG2 hepatoma cells. Subsequently, we assessed the combined effect of alcohol (50 mM) and oleate (0.2 mM) on hepatocellular lipid accumulation and inflammation in PHH. Under these conditions, alcohol significantly enhanced oleate induced cellular triglyceride content, while alcohol alone had only a minimal effect on hepatocellular lipid content. Analysis of heme oxygenase-1 (HMOX-1) expression and malondialdehyde levels (MDA) revealed that the combination of alcohol and oleate caused significantly higher oxidative stress and lipid peroxidation than either of the two substances alone. The CYP2E1 inhibitor chlormethiazole and the antioxidant N-acetylcysteine blunted these combined effects of alcohol and oleate on hepatocellular lipid accumulation and inflammation in PHH. In contrast to HepG2 C34 cells which do not express CYP2E1, HepG2 E47 cells which express CYP2E1 exhibited similar joint effects of alcohol and oleate as observed in PHH. The combination of alcohol and FFA induced also significantly autophagy markers more than the each stimulus alone. Inhibition or induction of autophagy led to exacerbate or abrogate the combined effects of alcohol and FFA on lipid accumulation, lipid peroxidation and inflammation, respectively.
In summary, our new model allows the investigation of isolated or joint effects of alcohol and FFA on hepatocellular lipid metabolisms and inflammatory signaling.
Our present findings indicate that CYP2E1, CYP2E1-derived reactive oxygen species (ROS) and autophagy play a crucial role in mediating the synergistic effects of alcohol and lipids on hepatic steatosis, oxidative stress and inflammation
2 Introduction
2.1 Liver diseases
2.1.1 Definition and natural course of liver disease
Liver diseases can be divided into acute and chronic liver diseases depending on the type of pathogens and the scope of injury. For example alcohol or drug intoxications and acute viral infections may lead to acute liver injury and death.
While chronic liver disease could be caused by chronic alcohol consumption or drug abuse, genetic alterations, viral infections and by metabolic disorders or by any combinations thereof. Fortunately, complete liver failure caused by acute injury is a rare condition. However, the main health problem and burden worldwide are chronic liver diseases. Here, regardless of the etiology, persistence of hepatic injury leads to chronic hepatic inflammation which can lead to liver fibrosis and ultimately liver cirrhosis and cancer.
2.1.2 Non-alcoholic fatty liver disease (NAFLD) 2.1.2.1 Definition
Non-alcoholic fatty liver disease (NAFLD) was first described by Ludwig et al.
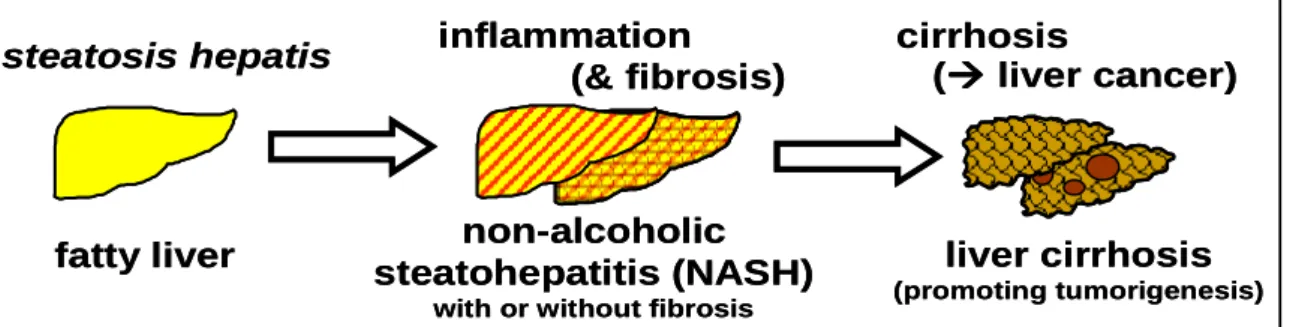
(Ludwig et al., 1980) in series of patients with liver disease and it represents a range of histological lesions in the liver that occur in individuals who do not consume alcohol in quantities that generally are considered to be harmful (alcohol intake < 20-30 g/day), These histological changes range from macrovesicular steatosis, which is the key histological feature of NAFLD and is considered relatively benign, through lobular inflammation (nonalcoholic steatohepatitis [NASH]) to variable degrees of fibrosis, cirrhosis and even hepatocellular carcinoma (HCC) (Caldwell and Argo, 2010) (Figure 2.1). The most common phenotypic manifestations of primary NAFLD/NASH are overweight/obesity, visceral adiposity, type 2 diabetes, hypertriglyceridemia and hypertension.
fatty liver non-alcoholic steatohepatitis (NASH)
with or without fibrosis
liver cirrhosis
(promoting tumorigenesis)
steatosis hepatis inflammation (& fibrosis)
cirrhosis
( liver cancer)
fatty liver non-alcoholic
steatohepatitis (NASH)
with or without fibrosis
liver cirrhosis
(promoting tumorigenesis)
steatosis hepatis inflammation (& fibrosis)
cirrhosis
( liver cancer)
Figure 2.1 The spectrum of NAFLD: fatty liver (steatosis hepatis), non-alcoholic steatohepatitis (NASH) with or without fibrosis, and liver cirrhosis, which promotes development of liver cancers.
2.1.2.2 Epidemiology of NAFLD/NASH
Nonalcoholic fatty liver disease (NAFLD) is increasingly recognized as an important public health problem. It is considered the most common cause of chronic liver disease in Western countries and USA (Clark et al., 2002; Powell et al., 2005). It is a common condition that in significant number of individuals can lead to NASH, fibrosis, cirrhosis and liver cancer. NASH, a serious form of NAFLD—is predicted to become the leading cause of liver transplantation in the USA by the year 2020 (Wree et al., 2013). Because it is often asymptomatic, much of the population with this condition may be unaware that they are afflicted.
Estimates of the prevalence of NAFLD in unselected populations from developed countries vary between 20 and 30% (Browning et al., 2004; Jimba et al., 2005;
Williamson et al., 2011) and even up to 42.6% in diabetic patients (Williamson et al., 2011) and approximately 2-3% of the same population will have NASH (Neuschwander-Tetri and Caldwell, 2003). NAFLD is closely linked to obesity and insulin resistance in most cases in the Western world (Loomba and Sanyal, 2013).
Similarly, the vast majority of individuals with NAFLD are either overweight (BMI > 25 kg/m²) or obese (BMI > 30 kg/m²) (Bacon et al., 1994) and it is estimated to be 60–75% in obese persons (Angulo, 2002; Bellentani et al., 2000) and even 85-90% in morbidly obese individuals (BMI > 35 kg/m²) (Andersen et al., 1984; Angulo, 2002). NAFLD has been also considered as the hepatic manifestation of the metabolic syndrome (MS), which includes central obesity, insulin resistance, dyslipidemia, and hypertension (Bieghs et al., 2012).
Furthermore, NAFLD increases the risk of liver cancer (hepatocellular carcinoma [HCC]) which is now the leading cause of obesity-related cancer deaths in middle- aged men in the USA (Michelotti et al., 2013). The overall prevalence of NAFLD in children is estimated at 3-10% and in some more recent studies was diagnosed in
55% of United State children identified by screening and referral (Schwimmer et al., 2013). Moreover, a recent report from the national health and nutrition examination survey demonstrated that the prevalence of suspected NAFLD has more than doubled over the past 20 years and currently affects nearly 11% of adolescents and one-half of obese males (Welsh et al., 2013).
2.1.2.3 Etiology and pathogenesis of NAFLD/NASH
Up to date, major gaps remain in our understanding of the etiology of NAFLD.
Many cases are related to a “Western lifestyle”, i.e. nutrient abundance coupled with a sedentary lifestyle; however, it is likely that genetic predisposition and environmental factors plays an important, if not decisive, role in determining which individuals have a higher risk for development of NAFLD and for its progression. In 1998 Day and James proposed the ‘two-hit’ hypothesis for the pathogenesis of NASH (Day and James, 1998). The ‘first hit’ involves an imbalance in lipid metabolism that leads to hepatic lipid accumulation (hepatic steatosis) which primers the liver to develop hepatic inflammation upon either a second pathogen afflict the liver or by exposing the liver to a second metabolic stressor (‘second hit’) that promotes oxidative stress, mitochondrial dysfunction and dysregulated cytokine production and hence steatohepatitis. The ‘two-hit’ model has subsequently been revised in recognition that a combination of ‘second hits’ (both environmental and genetic) may lead to the development of steatohepatitis (Day, 2002). A recent study in NAFLD patients, has shown that hepatic steatosis, nearly 60% arose from free fatty acids (FFAs), whereas de novo fatty acid synthesis accounted for 26%, with a much smaller portion of 15% arising from the diet (Donnelly et al., 2005). The causes for progression to fibrosis or even cirrhosis in some NASH patients are subject of many studies and are often referred to as the
‘third hit’ (Hellerbrand, 2010).
2.1.2.4 Risk factors of NAFLD and NASH
•••• Obesity: NAFLD may occur in three-quarters of obese people and close to 20% may have NASH (Wanless and Lentz, 1990).
•••• Central adiposity: central adiposity has been shown to be associated with NAFLD in normal weight men but with a high waist-to-height ratio (Hsieh and Yoshinaga, 1995).
•••• Hypertriglyceridemia: It has been reported that the prevalence of fatty liver and or metabolic syndrome is much higher in persons with hypertriglyceridemia compared with those with normal triglycerides (Nomura et al., 1988; Pinto et al., 2013)
•••• Type 2 diabetes mellitus: NAFLD was positively associated with the presence of diabetes independent of the degree of obesity (Braillon et al., 1985). Moreover, the extent of steatosis correlated with the degree of impaired glycemic status, independent of degree of obesity (Silverman et al., 1990). It has been also reported that the prevalence of NASH in diabetics is much higher compared with non-diabetics (Wanless and Lentz, 1990; Williamson et al., 2011).
•••• Metabolic syndrome (insulin-resistance syndrome): Insulin resistance has been regarded as central in the pathogenesis of NAFLD (Marchesini et al., 1999) and now NAFLD is considered the hepatic manifestation of the metabolic syndrome (Kim and Younossi, 2008).
2.1.2.5 Prognosis and therapy
In general, the prognosis for simple steatosis is very good; however, NASH can progress to cirrhosis and hepatocellular carcinoma in 10-15% of patients. Once cirrhosis is present, it is estimated that 30-40% of these patients will progress to a liver-related death over a 10-year period (Bacon et al., 1994; Matteoni et al., 1999;
Powell et al., 1990). Despite increasing understanding of the mechanisms of NAFLD pathogenesis, few effective liver-specific therapies are available. Still, weight loss, anti-obesity medication, insulin sensitizer agents and anti-oxidants appear to exert favorable effects on NAFLD pathology [reviewed in (Dowman et al., 2011)].
2.1.3 Alcoholic liver disease (ALD) 2.1.3.1 Definition
Similar to NAFLD, alcoholic liver disease (ALD) represents a spectrum of liver lesions. The spectrum of ALD includes steatosis with or without fibrosis in virtually all individuals with an alcohol consumption of >80 g/day, alcoholic steatohepatitis (ASH) with variable severity, fibrosis and liver cirrhosis. Once cirrhosis is
established, there is a risk for hepatocellular carcinoma (HCC) in some cases (Stickel and Hampe, 2012).
2.1.3.2 Epidemiology and natural course of ALD
ALD affects millions of patients worldwide each year and about 4% of all global deaths are attributed to alcohol-induced liver injuries (Rehm et al., 2009). ALD is still one of the most frequent causes for chronic liver disease, not only in Western Countries (Barve et al., 2008; Bergheim et al., 2005) but also in Asia (Farrell et al., 2013) and it is the second most common reason for liver transplantation in the United States and Europe (Adachi and Brenner, 2005; Bellentani et al., 1994).
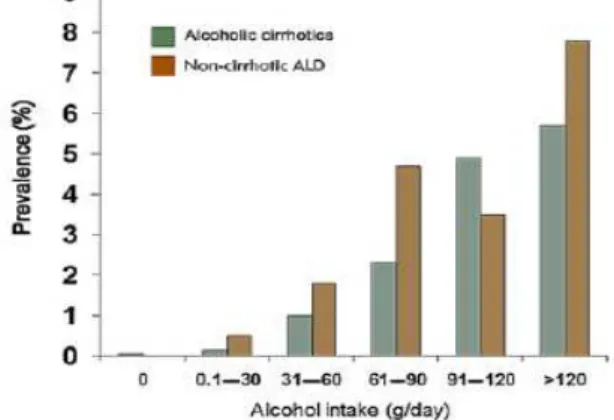
Multivariate analysis Studies in humans estimate that liver steatosis evolves in almost excessive drinkers (consumption of >30 g/day), but only about one-third develop significant necroinflammation (alcoholic steatohepatitis [ASH]) and fibrosis and only about 10% progress to cirrhosis (Becker et al., 1996; Bellentani et al., 1997). Among the latter, 1-2% annually develop hepatocellular carcinoma (HCC) as a severe complication (Seitz and Stickel, 2007). A dose–response relationship for the amount of alcohol consumed and the risk of HCC has been shown (Corrao et al., 2004). Moreover, chronic alcohol consumption strikingly increases the risk of cirrhosis and HCC in patients with co-existing of hepatitis B and/or hepatitis C virus infection or hemochromatosis (Morgan et al., 2004). Noteworthy, women have a significantly higher relative risk of developing alcohol-related liver disease than men for any given level of alcohol intake. However, a dose-dependent increase has been observed in the relative risk of developing alcohol-induced liver injury for both men and women, with the steepest increase among women (Becker et al., 1996; Bellentani et al., 1997) (Figure 2.2).
Figure 2.2 Relationship between the amount of alcohol consumed and the likelihood of developing non-cirrhotic or cirrhotic alcoholic liver disease (ALD) (Bellentani et al., 1997).
2.1.3.3 Pathogenesis of ALD
The pathogenesis of ALD is a complex process and that involves several mechanisms at different metabolic levels (Scaglioni et al., 2011). The most toxic effects of alcohol are closely linked to its toxic metabolites. Therefore, in order to understand the underling mechanism of alcohol-induced liver injuries we have to know, how alcohol is metabolized in the liver and the consequences of its metabolites on the status and function of the liver. Additional to alcohol hepatotoxic effects, alcohol consumption can lead to an increased uptake of endotoxins from gut bacteria which contribute to necroinflammation response and fibrosis progression via various molecular mechanisms including tumour necrosis factor (TNF) and the CD14/toll-like receptor-4 complex to produce ROS via NADPH oxidase [reviewed in (Altamirano and Bataller, 2011)].
2.1.3.3.1 Hepatic alcohol metabolism
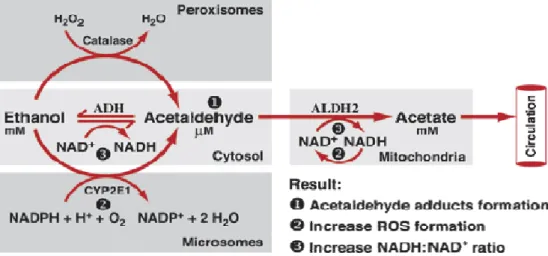
Alcohol (ethanol, C2H5-OH) undergoes enzymatically-catalyzed oxidative metabolism to acetaldehyde (CH3-CHO) by alcohol dehydrogenase (ADH), which is located in the cytosol of hepatocytes, and by the microsomal ethanol oxidizing system (MEOS) cytochrome P450 2E1 (CYP2E1) in the microsomes, and a minor alcohol amount by catalase in the peroxisomes (Figure 2.3).
Figure 2.3 Oxidative ethanol metabolism in the liver cells (hepatocytes) (Zakhari, 2006).
The resulted acetaldehyde is further oxidized by acetaldehyde dehydrogenase (ALDH) to acetate (CH3COO−) which released to blood circulation or enters citrate cycle. These biochemical processes lead to hepatic lipid accumulation, reactive oxygen species (ROS) production and oxidative stress which lead in significant fraction of patients to hepatic fibrosis, cirrhosis and liver cancer (HCC).
2.1.3.3.2 Alcohol-induced hepatocellular lipid accumulation
Excessive neutral fat accumulation in the liver (hepatic steatosis) is the most common and earliest response of the liver to chronic alcohol consumption (Purohit et al., 2004). The mechanisms underlying alcohol-induced hepatic steatosis are complex, involving the disturbance of several signaling pathways like adenosine monophosphate -activated protein kinase (AMPK) pathway (You et al., 2004) and some enzymes like sterol regulatory element binding protein 1 (SREBP-1) which is activated to induce a higher expression of lipogenic enzymes (You et al., 2002) including fatty acid synthase (FASN), acyl CoA carboxylase (ACC), stearoyl CoA desaturase (SCD-1) and diacylglycerol acyltransferase (DGAT) (Carrasco et al., 2001; Wang et al., 2010) or by inhibition of lipid oxidation by inhibition of peroxisome proliferator-activated receptor alpha (PPAR alpha) (Galli et al., 2001).
Moreover, recent studies have shown a crucial role of CYP2E1 in the underlying machanisms of alcohol-induced hepatic steatosis (Wu et al., 2010; Wu et al., 2012).
2.1.3.3.3 Alcohol-induced ROS production and hepatic oxidative stress
Alcohol metabolism produced acetaldehyde, a highly toxic and mutagenic molecule, and increases oxidative stress by the production of ROS and lipid peroxides such as 4-hydroxy 2,3-nonenal, 4-hydroxy-2,3- alkenals and malondialdehyde (MDA) (Wu and Cederbaum, 2009). Many processes and factors are involved in causing alcohol-induced oxidative stress, including:
• Changes in the NAD+/NADH ratio in the hepatocytes.
• Production of acetaldehyde during alcohol metabolism, which through its interactions with proteins and lipids also can lead to radical formation and cell damage.
• Damage to the mitochondria resulting in decreased adenosine triphosphate (ATP) production.
• Alcohol-induced oxygen deficiency (i.e., hypoxia), especially in the pericentral region of the liver where extra oxygen is required to metabolize alcohol.
• Alcohol-induced increase in the ability of the bacterial product endotoxin to enter the bloodstream and liver, where it can activate certain immune cells.
• Induction of cytochrome P450 2E1 (CYP2E1) activity, which metabolizes alcohol and other molecules and generates ROS in the process.
• Alcohol-induced increases in the levels of free iron, which can promote ROS generation.
• Effects on antioxidant enzymes and chemicals, particularly glutathione (GSH).
• Conversion of the enzyme xanthine dehydrogenase into a form called xanthine oxidase, which can generate ROS (Wu and Cederbaum, 2009).
2.1.4 The epidemiology and clinical history of NAFLD and ALD co- morbidity
NAFLD/NASH and ALD/ASH are increasingly relevant public health issues, first of all because of their close association with the worldwide epidemics of diabetes and obesity (Scaglioni et al., 2011). Recent studies have found that alcohol per se is a risk factor for obesity through both of its produced metabolic energy and via increasing the food intake (Yeomans, 2010). The risk of alcohol consumption and obesity-inducing liver injury together is far greater than the risk of a single factor inducing liver injury (Shen et al., 2010; Tsai et al., 2012). Thus, obese alcoholics have an accentuated elevation in serum transaminase levels (Alatalo et al., 2008;
Ruhl and Everhart, 2005), and in subjects with heavy or even moderate alcohol consumption, obesity is an independent risk factor for the development of both acute and chronic alcohol-induced hepatitis and cirrhosis (Figure 2.4) (Liu et al., 2010; Naveau et al., 1997; Raynard et al., 2002). However, the effect of even moderate alcohol consumption on liver enzymes increases with increasing BMI (Alatalo et al., 2008) and the raised BMI and alcohol consumption are both related to liver disease, with evidence of a supra-additive interaction between the two (Hart et al., 2010). Most recently, an interesting epidemiological study in England of more than 100,000 women has shown that alcohol consumption accompanied with obesity induced liver injury in super additive manner in comparison with non- obese patients who consumed similar moderate or heavy alcohol amounts (Keller, 2013).
Figure 2.4 Standardised rates (with 95% CI) for liver cirrhosis per 1000 women over 5 years by body mass index (BMI) and alcohol consumption (Liu et al., 2010).
2.1.5 The role of CYP2E1 in NAFLD and ALD 2.1.5.1 Definition
The cytochrome P450 super family is a group of hemecontaining proteins with multiple functions including the metabolism of xenobiotics such as drugs, toxins, carcinogens, and endogenous substrates, such as fatty acids and steroids. The cytochrome P450 enzymes catalyze a number of chemical reactions such as peroxidation, dealkylation, mono-oxygenation, reduction, epoxidation, and dehalogenation (Leung and Nieto, 2013). A major function of the cytochrome P450 system is to convert non-polar to polar compounds for conjugation by phase II enzymes or for direct excretion. Toxic metabolites are generated by cytochrome P450- mediated metabolism, which in turn causes significant cellular injury. The catalytic activity of the cytochrome P450 enzymes requires oxygen activation, which results in the generation of ROS such as superoxide anion (O2.-) hydrogen peroxide (H2O2), and hydroxyl radical (.OH) (Leung and Nieto, 2013). CYP2E1 oxidizes ethanol to acetaldehyde, and the 1-hydroxyethyl radical, activates various agents (CCl4, acetaminophen, benzene, halothane, halogenated alkanes, and alcohols) to reactive products, generates reactive oxygen radical species and can be induced by ethanol. Moreover, the ethanol-induced liver pathology correlated with CYP2E1 levels and lipid peroxidation. Furthermore, inhibitors of CYP2E1 prevented the elevation of lipid peroxidation and ethanol- induced liver pathology [reviewed in (Cederbaum, 2012)]. CYP2E1 is important not only for alcoholic liver disease but it plays also a crucial role in NAFLD, for example it metabolizes
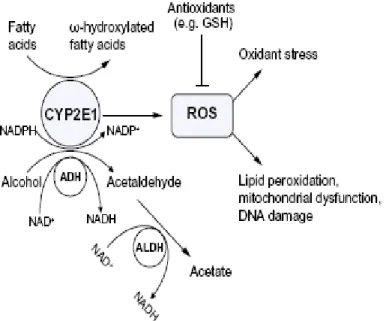
polyunsaturated fatty acids such as linoleic acid and arachidonic acid to generate ω-hydroxylated fatty acids which could be further transformed by alcohol and aldehyde deydrogenases to dicarboxylic fatty acids that can have at high levels harmful effects on hepatocytes (Aubert et al., 2011) (Figure 2.5).
Figure 2.5 A significant amount of CYP2E1 is produced and activated by alcohol and fatty acids in ALD and NAFLD (Leung and Nieto, 2013).
2.1.5.2 The role of CYP2E1 in the pathogenesis of NAFLD
Several clinical studies and rodent models have recently reported the induction of CYP2E1 protein level and/or activity in context of obesity, NAFLD and NASH [reviewed in (Aubert et al., 2011)]. Other studies have also reported higher CYP2E1 mRNA expression in NAFLD thus suggesting increased rate of transcription and/ or higher stability of CYP2E1 transcripts [reviewed in (Aubert et al., 2011)]. Many studies have shown the significance of increased CYP2E1 expression and electron leakage from the mitochondrial respiratory chain in inducing oxidative stress in NAFLD [reviewed in (Leung and Nieto, 2013)]. The hepatic CYP2E1 content and its activity in obese patients with steatosis and, particularly, with steatohepatitis were significantly higher than controls and correlated positively with both the severity of the liver damage (Orellana et al., 2006). Furthermore, CYP2E1 activity correlated with the degree of steatosis (Butura et al., 2009). Moreover, CYP2E1 is induced in rats fed a high fat diet compared to rats fed a high-sucrose /low fat diet suggesting that the amount of fat consumed is critical for CYP2E1 induction (Osabe et al., 2008). These data provide evidence that CYP2E1 has a crucial role in the mechanism of liver injury
found in obese NAFLD and NASH patients. These studies suggest also that the amount of fat in the liver is important for the pathogenesis of NASH by increasing CYP2E1 and by rendering the liver more susceptible to noxious molecules such as ROS and other metabolic stressors like lipid peroxidation which correlated positively with CYP2E1 expression in obese patients (Orellana et al., 2006).
Insulin resistance and hyperinsulinemia play a key role in hepatic steatosis and are common to both ALD and NAFLD. (CYP2E1_/_) knockout mice showed protection from a high-fat diet-induced insulin resistance with improved glucose homeostasis (Zong et al., 2012).
2.1.5.3 The role of CYP2E1 in the pathogenesis of ALD
The involvement of cytochrome P450 in alcohol metabolism was first identified by Charles S. Lieber in his studies on the microsomal ethanol-oxidizing system (MEOS) (Lieber, 1997). Many recent studies have suggested a crucial role for cytochrome P450 2E1 in context of alcoholic liver disease (ALD) which can be induced 10-20 fold by chronic alcohol consumption (Wang et al., 2009). Alcohol induced CYP2E1 activity in a dose and time-dependent manner (Liu et al., 2005) and this induction is associated with hepatic steatosis (Lu et al., 2008), ROS production, oxidative stress (French, 2013; Gonzalez, 2005; Liu et al., 2005; Lu and Cederbaum, 2008) inflammation and fibrosis (Lieber, 2004) and DNA lesions (Wang et al., 2009). Moreover, CYP2E1 potentiates nitroxidative stress, gut leakage, and endotoxemia; altered fat metabolism; and inflammation contributing to hepatic apoptosis and steatohepatitis (Abdelmegeed et al., 2013). Interestingly, CYP2E1-expressing cells showed an increase in GSH, glutathione-S-transferase, catalase and heme-oxygenase and the treatment of these cells with antioxidants prevented the induction of these enzymes suggesting that CYP2E1-derived ROS may be responsible for the transcription and activation of the antioxidant genes [reviewed in (Leung and Nieto, 2013)]. CYP2E1 also induces other antioxidant factors, like Nrf2, to protect the liver against CYP2E1-induced oxidant stress (Gong and Cederbaum, 2006). Furthermore, using a co-culture model of HepG2 cells, which do (E47 cells) or do not (C34 cells) express CYP2E1 with hepatic stellate cells (HSC) has shown an increase in intra- and extracellular hydrogenperoxide (H2O2), lipid peroxidation, and collagen type I protein in HSC co-cultured with E47 cells compared with stellate cells alone or co-cultured with C34 cells (Nieto et al., 2002), thus reveals a profibrogenic role of CYP2E1- derived
ROS. Recently, a new strategy for treatment of alcohol-induced liver injury has emerged, namely the pharmacological inhibition of CYP2E1 which has detrimental effects on the liver through free radical formation and lipid peroxidation (Gebhardt et al., 1997; Gouillon et al., 2000; Swaminathan et al., 2013). Moreover, Chlormethiazole (a CYP2E1 inhibitor) decreased lipopolysaccharide-induced inflammation in rat Kupffer cells (hepatic macrophages) with ethanol treatment (Ye et al., 2013) which reveals a crucial role of CYP2E1 in alcohol-induced steatohepatitis.
2.1.6 The role of autophagy in NAFLD and ALD 2.1.6.1 Definition
Autophagy (Greek ‘‘self eating”) is a highly conserved intracellular catabolic pathway for the degradation of long-lived proteins, cytoplasmic lipid droplets and organelles that is essential for survival, differentiation, development, and homeostasis. Autophagy principally has an adaptive role to protect organisms against diverse pathologies, including infections, cancer, neurodegeneration, aging, and heart disease (Levine and Kroemer, 2008). The autophagic process includes a series of steps, including initiation, elongation and expansion of the phagophore assembly site (PAS), phagophore, formation of double-membrane vesicle termed autophagosome, maturation through fusion with the lysosome to form an autolysosome, leading to the degradation of the enclosed substances together with the inner autophagosomal membrane (Figure 2.6) (Cui et al., 2013).
The resulting molecules are then recycled back to the cytoplasm for reuse. A recent study has shown also that pharmacological promotion of autophagy alleviated hepatic steatosis and injury in models of alcoholic as well as non- alcoholic fatty liver injuries (Lin et al., 2013). Moreover, a new study has shown that gene transfer of a master autophagy regulator results in clearance of toxic protein and correction of hepatic disease in alpha-1-anti-trypsin deficiency (Pastore et al., 2013).
2.1.6.2 The role of autophagy in NAFLD
Many metabolic, endougenous and/or exogenous factors affect hepatic autophagy regulation in terms of nutritional status (Figure 2.7). For example glucagon
released from the pancreas during fasting promotes autophagy, whereas insulin released after feeding suppresses autophagy (Dolganiuc et al., 2012).
Figure 2.6 The core molecular machinery of autophagy in mammalian cells. The autophagic process in mammalian cells is controlled by the following groups of Atgs: (1) The ULK1 complex controls the induction or initiation of autophagy for the formation of PAS and phagophore; (2) The Beclin 1-class III PI3K complex controls the nucleation step of autophagosome formation; (3) The two ubiquitin-like conjugation systems (the Atg12–Atg5 system and the LC3 system) mediate the elongation stage, leading to formation of a complete autophagosome; and (4) The Atg9 retrieval process functionally involves a protein complex of Atg18 and Atg2 (Cui et al., 2013).
In the liver, autophagy promotes lipid droplets degradation in hepatocytes (macrolipophagy) (Dong and Czaja, 2011). The lipid droplets become trapped inside the double-membrane vesicle (autolipophagosome) and are infused with lysosomes, where they are degraded to fatty acids (Figure 2.7). Recently, a novel in vitro study has shown that increased autophagy, leads to a greater breakdown of stored lipids to supply fatty acids for β-oxidation or for other uses and oppositely pharmacological inhibition of autophagy with 3-methyladenine (3-MA) significantly increased hepatocyte TG content in the absence or presence of exogenous lipid supplementation (Singh et al., 2009). In the same study, hepatocyte-specific Atg7- knockout mice had markedly increased hepatic steatosis (Singh et al., 2009).
Interestingly, restoration of Atg7 expression results in significant reduction in obesity-induced ER stress in the liver of ob/ob mice, rescues the defects in insulin receptor signaling, reduces serum insulin level, improves glucose tolerance and whole body insulin sensitivity through the suppression of hepatic glucose
production and enhancement of insulin-stimulated glucose disposal in the periphery, and decreases hepatic fatty acid infiltration and liver triglyceride content [reviewed in (Rautou et al., 2010)].
Figure 2.7 Fatty liver disease and metabolic syndrome. Autophagy functions in the basal turnover of lipids by engulfing and degrading lipid droplets. Autophagy is inhibited by the insulin-amino acid- mTOR signaling pathway via both short-term and long-term regulation mechanisms (Rautou et al., 2010).
2.1.6.3 The role of autophagy in ALD
Analysis the hepatocytes of chronic alcohol-fed mice revealed fourfold higher autophagosomes formation than in cells of control animals. These results were confirmed by immunoblot analyses of light chain protein (LC3-II), an essential protein in autophagy levels (Ding et al., 2010; Thomes et al., 2012). Of note, this induction of autophagy required CYP2E1-mediated alcohol metabolism and ROS production (Ding et al., 2010). However, recent studies identified alcohol-induced autophagy in primary hepatocytes and in hepatoma cells expressing alcohol dehydrogenase (ADH) and cytochrome P450 2E1 (CYP2E1) as protective mechanism against ethanol-induced toxicity and it seemed to be selective for damaged mitochondria and accumulated lipid droplets, but not for long-lived proteins, which could account for its protective effects (Ding et al., 2010; Ding et al., 2011; Wu et al., 2012). Moreover, induction of autophagy has been shown to
reduce steatosis and to protect from hepatotoxicity in models of acute or chronic ethanol exposure (Ding et al., 2010; Wu et al., 2010; Wu et al., 2012; Yang et al., 2012). In accordance, inhibition of autophagy using 3-MA exacerbate the toxic effects of ethanol in different in vitro and in vivo alcohol models (Ding et al., 2011;
Wu et al., 2010; Wu et al., 2012). Furthermore, a recent study has shown that autophagy promotes fibrogenesis in activated hepatic stellate cells (HCS) in mice and in human tissues via digestion the stored lipids in HCS in order to offer the required energy source for their activation (Hernandez-Gea et al., 2012).
2.2 Aim of the thesis
The aim of this thesis was to establish an in vitro model to analyze the combined effects of alcohol and free fatty acids (FFA) on hepatocellular lipid accumulation and inflammation and to investigate the role of CYP2E1 and autophagy in these pathophysiological mechanisms.
3 Materials and Methods
3.1 Chemicals and Reagents
Agarose SeaKem ® LE Biozym, Hess/Oldendorf, Germany
Agar Difco Laboratories, Augsburg, Germany
Ampicillin Sigma-Aldrich, Deisenhofen, Germany
Bovine Serum Albumin (BSA) Sigma, Steinheim, Germany
β-Mercaptoethanol Sigma-Aldrich, Deisenhofen, Germany Chlormethiazole (CMZ) Sigma-Aldrich, Deisenhofen, Germany Collagenase type IV Sigma-Aldrich, Hamburg, Germany
DMEM medium PAA Laboratories, Cölbe, Germany
DMSO Sigma-Aldrich, Deisenhofen, Germany
DNAse Qiagen, Hilden, Germany
Ethanol Otto Fischar GmbH & Co. KG, Germany
FCS (fetal calf serum) PAN-Biotech, Aidenbach, Germany
Gentamycin Invitrogen, Karlsruhe, Germany
GIBCO medium (Hepatozyme-SFM) Invitrogen, Carlsbad, USA
Milk powder Carl Roth, Karlsruhe, Germany
N-acetyl cystein Sigma-Aldrich, Deisenhofen, Germany
Oleic acid Sigma, Steinheim, Germany
p-Nitrophenol Sigma-Aldrich, Germany
p-Nitrocatechol Sigma-Aldrich, Germany
PBS buffer PAA, Pasching, Austria
Penicillin Invitrogen, Karlsruhe, Germany
Phenylmethylsulfonyl fluoride (PMSF) Sigma-Aldrich, Germany
Ponceau-S solution Applichem, Darmstadt, Germany
Rapamycin Sigma-Aldrich, Deisenhofen, Germany
Sodium dodecyl sulfate Roth, Karlsruhe, Germany
Sodium hydroxide Roth, Karlsruhe, Germany
Streptomycin Invitrogen, Karlsruhe, Germany
Triton X-100 Sigma-Aldrich, Deisenhofen, Germany
Trypsin/EDTA PAA Laboratories, Cölbe, Germany
Trypan blue solution Sigma-Aldrich, Deisenhofen, Germany
3-methyladenine
Sigma-Aldrich, Deisenhofen, Germany
3.2 Laboratory expendables
CryoTube vials Nunc, Roskilde, Denmark
Pipet tips
(10, 20, 100 und 1000 µl)
Eppendorf, Hamburg, Germany
Falcon tubes (50 ml) Corning, New York, USA
Glassware (various) Schott, Mainz, Germany
Multiwell plates Corning, New York, USA
Pipettes (stripettes ®) (5, 10, 25, 50 ml)
Corning, New York, USA
Reaction vessels (1.5 and 2 ml) Eppendorf, Hamburg, Germany Strip tubes (0.2 ml) Peqlab, Erlangen , Germany Cell culture flasks T25, T75, T175 Corning, New York, USA
3.3 Laboratory instruments
Heating block:
Thermomixer comfort Eppendorf, Hamburg, Germany
PCR-cycler:
GeneAmp® PCR System 9700 Applied Biosystems, Foster City, USA LightCycler® Real-Time PCR System Roche Diagnostics, Mannheim,
Germany Pipettes:
Eppendorf Research
(1000 µl, 200 µl, 100 µl, 20 µl, 10 µl,
2 µl) Eppendorf, Hamburg, Germany
Pipette controllers:
Accu-jet® Brand, Wertheim, Germany
Shaking devices:
KS 260 Basic Orbital Shaker IKA® Werke, Staufen, Germany Power Supplies:
Consort E145 Peqlab, Erlangen, Germany
Power Supply-EPS 301 Amersham Biosciences, Munich, Germany
Spectrophotometer:
EMax® Microplate Reader SPECTRAFluor Plus
MWG Biotech, Ebersberg, Germany Tecan, Männedorf, Switzerland Scale:
MC1 Laboratory LC 620 D Sartorius, Göttingen, Germany Water bath:
Haake W13/C10 Thermo Fisher Scientific, Karlsruhe,
Germany Centrifuges:
Biofuge fresco Megafuge 1.0 R
Heraeus, Hanau, Germany Heraeus, Hanau, Germany Microscope:
Olympus CKX41 with
ALTRA20 soft imaging system
Olympus Hamburg, Germany
3.4 Buffers
PBS buffer 140 mM NaCl
10 mM KCl
6.4 mM Na2HPO4
2 mM KH2PO4 pH 7.4
TE buffer 10 mM Tris/HCl
1 mM EDTA pH 8.0
HEPES Buffer (100 mM)
70 ml 2.383 g
ultrapure water
HEPES pH 7.4
Krebs-Ringer HEPES buffer
123 mM 1.3 mM
NaCl CaCl2
5 mM KCl
100 mM HEPES Buffer
5 mM D-glucose
1.5 % BSA
20 mM sodium pyruvate
1 mM ascorbic acid pH 7.4
3.5 Cell culture
3.5.1 Cell culture medium DMEM (high glucose
/10%FCS) 4.5 g/l Glucose
300 µg/ml L-Glutamine
supplemented with:
10% (v/v) FCS
400 IU/ml Penicillin
50 µg/ml Streptomycin
Primary human hepatocytes medium
HepatoZYME-SFM (Gibco®) (high glucose/ free FCS)
supplemented with:
4 mM L-Glutamine
400 IU/ml Penicillin
50 µg/ml Streptomycin
Freezing medium 5 Vol DMEM (high glucose/10%
FCS)
3 Vol FCS
2 Vol DMSO
3.5.2 Cultivation of cell lines
Cell culture work was always performed within a laminar flow biosafety cabinet (Hera Safe, Heraeus, Osterode, Germany). Cells were cultivated in a Binder series CB incubator (Binder, Tuttlingen, Germany) in 10% CO2 atmosphere at 37°C. For passaging adherent cells were washed with PBS and detached with trypsin
(0.05%)/EDTA (0.02%) (PAA Laboratories, Cölbe, Germany) at 37°C.
Trypsinization was stopped by adding equivalent volume of DMEM containing 10%
FCS. Subsequently, cells were centrifuged at 500 g for 5 min and the obtained cell pellet was resuspended in fresh culture medium and distributed to new cell culture flasks achieving a cell density thinning factor of 5 to 10. Medium was changed every second day. Cell growth and morphology were controlled and documented with a microscope (Olympus CKX41 with ALTRA20 Soft Imaging System, Olympus, Hamburg, Germany). Cell culture waste was autoclaved before disposal with a Sanoclav autoclave (Wolf, Geislingen, Germany).
3.5.3 Human hepatoma cell line
HepG2 stably transfected with CYP2E1 plasmid (E47) HepG2 stably transfected with control mock plasmid (C34)
Cell lines were kindly provided by Prof. A. I. Cederbaum, New York, NY, USA (Wu,D.; Cederbaum,A.I.2008). The both cell lines were maintained in the same medium (DMEM) as HepG2 cells with addition of 400 µg/ml Gentamicin sulfate salt (Invitrogen, Karlsruhe, Germany).
3.5.4 Isolation of primary human hepatocytes
Primary human hepatocytes (PHH) were isolated in cooperation with Prof. Dr.
med. Wolfgang Thasler (Experimental Surgical Research, Grosshadern Hospital, Munich, Germany) and the center of liver cells isolation “hepacult GmbH”
(Regensburg, Germany) from human liver resections using a modified two-step EGTA/collagenase perfusion procedure (Hellerbrand et al. 2007; Hellerbrand et al.
2008; Pahernik et al. 1996; Ryan et al. 1993; Weiss et al. 2002). Experimental procedures were performed according to guidelines of the charitable state controlled foundation HTCR (Human Tissue and Cell Research) with the informed patient’s consent.
3.5.5 Determination of cell number and viability
Cell number and viability was determined by trypan blue exclusion test. The cell suspension was diluted 1:2 with trypan blue solution (Sigma, Deisenhofen, Germany) and applied on a Neubauer hemocytometer (Marienfeld GmbH, Lauda- Königshofen, Germany). Cell with impaired cell membrane integrity are stained
blue, and therefore, can be clearly distinguished from intact cells which appear white under microscopic inspection. The cell number could be calculated after counting cells in all four quadrants of the hemocytometer, each containing sixteen smaller squares, with the following equation:
Cell number/ml = Z x DF x 104 ÷ 4 Z: counted cell number
DF: dilution factor (in the described procedure the factor is 2)
The ratio of viable cells could be determined by setting the number of unstained cells in relation to the total cell number (blue and unstained cells).
3.6 Isolation and analysis of RNA
3.6.1 RNA isolation and determination of RNA concentration
RNA isolation was performed with the RNeasy® mini kit (Qiagen, Hilden, Germany) according to the manufacturer’s instructions. The principle of RNA isolation is based on the absorption of RNA to hydrophilic silicon-gel membranes in presence of suitable buffer systems. Biological samples were first lysed and homogenized in the presence of a highly denaturing guanidine isothiocyanate containing buffer, which immediately inactivates RNases to ensure isolation of intact RNA. To homogenize tissue samples a MICCRA D1 homogenizer (ART Prozess- & Labortechnik, Müllheim, Germany) was used.
After lysis, ethanol has been added to provide ideal conditions for the binding of RNA to the silica-gel membranes. Contaminants have been washed away with suitable buffers before RNA was eluted in water and stored at -80°C. The concentration of RNA was measured with the NanoDrop® ND-1000 UV/VIS spectrophotometer (Peqlab, Erlangen, Germany).
3.6.2 Reverse transcription of RNA to cDNA
Transcription of RNA to complementary DNA (cDNA) was conducted with the Reverse Transcription System Kit (Promega, Mannheim, Germany) which uses avian myeloblastosis virus reverse transcriptase (AMV-RT). The working solution was pipetted with contamination-free aerosol filter pipet tips after the following pipetting scheme:
0.5 µg RNA
4 µl MgCl2 (25 mM)
2 µl 10x reverse transcription buffer 2 µl dNTP mix (10 mM)
1 µl random primer
0.5 µl RNasin ribonuclease inhibitor 0.6 µl AMV RT
ad 25 µl H2Odest.
For reverse transcription samples have been incubated in a GeneAmp® PCR cycler (Applied Biosystems, Foster City, USA) for 30 min at 42°C. For denaturation of the AMV RT the temperature has been raised to 99°C for 5 min. After cooling down to 4°C the obtained cDNA was diluted with 75µl H2Odest.,and used immediately or stored at -20°C.
3.6.3 Quantitative real time polymerase chain reaction
To quantify the expression of specific mRNA, quantitative real time polymerase chain reaction (qRT-PCR) has been performed with the LightCycler® 480 System (Roche Diagnostics, Mannheim, Germany). The qRT-PCR is principally based on a conventional polymerase chain reaction (PCR), but offers the additional possibility of quantification, which is accomplished by fluorescence measurements at the end and/or during a PCR cycle. As fluorescent reagent SYBR® Green (SensiFAST™ SYBR No-ROX Kit, Bioline, Luckenwalde, Germany) has been used. SYBR® Green intercalates with double-stranded DNA whereby the fluorescence emission rises significantly. Therefore, the fluorescence signal increases proportionally with the amount of PCR products. To quantify the expression of a specific gene of interest, the results have been normalized to the housekeeper 18s rRNA. The results were evaluated with the LightCycler® 480 software release 1.5.0 SP4 following the manufacturer’s instructions. qRT-PCR was performed according following protocol:
2.5 µl H2Odest.
0.25 µl forward primer (20 µM) 0.25 µl reverse primer (20 µM) 5 µl SYBR® Green
Following standard scheme has been used and adapted to particular primer melting point temperature:
Initial denaturation: 95°C 2 min Two step PCR (45 cycles): 95°C 5 s
60°C 18 s Analysis of melting curve: 95°C 5 s
65°C 1 min 97°C 0 s
For validation, after qRT-PCR PCR product has been mixed with loading buffer (Peqlab, Erlangen, Germany) and loaded on a agarose gel with ethidium bromide (50 µg/100 ml gel) to determine the PCR product length. Each experimental condition was performed in triplicates and experiments were repeated at least three times.
Table 3.1 Used primers for qRT-PCR, species: mouse or human
name forward primer reverse primer
18S 5’- AAA CGG CTA CCA CAT CCA AG 5’- CCT CCA ATG GAT CCT CGT TA human IL8 5’-TCT GCA GCT CTG TGT GAA GGT GCA GTT 5’-AACCCTCTGCACCCAGTTTTCCT human ICAM1 5’- CTGTCACTCGAGATCTTGAGG 5’- CCTGCAGTGCCCATTATGA
human HMOX1 5’- GAGTGTAAGGACCCATCGGA 5’- GCCAGCAACAAAGTGCAAG
human ACOX1 QIAGEN QuantiTect Primer Assay QIAGEN QuantiTect Primer Assay human ATG7 QIAGEN QuantiTect Primer Assay QIAGEN QuantiTect Primer Assay human ATG12 QIAGEN QuantiTect Primer Assay QIAGEN QuantiTect Primer Assay human CPT1A1 QIAGEN QuantiTect Primer Assay QIAGEN QuantiTect Primer Assay human DGAT1 QIAGEN QuantiTect Primer Assay QIAGEN QuantiTect Primer Assay human DGAT2 QIAGEN QuantiTect Primer Assay QIAGEN QuantiTect Primer Assay human FASN QIAGEN QuantiTect Primer Assay QIAGEN QuantiTect Primer Assay human
PIK3C3(VPS34) QIAGEN QuantiTect Primer Assay QIAGEN QuantiTect Primer Assay human p47Phox QIAGEN QuantiTect Primer Assay QIAGEN QuantiTect Primer Assay human SCD-1 QIAGEN QuantiTect Primer Assay QIAGEN QuantiTect Primer Assay
Primers were synthesized by SIGMA Genosys (Hamburg, Germany) or purchased as QuantiTect Primer Assays from Qiagen (Hilden, Germany). The lyophilized primers (SIGMA Genosys primers) were dissolved in H2Odest. or TE buffer (QuantiTect Primer Assays), respectively, and stored at -20°C.
3.7 Protein analysis
3.7.1 Preparation of protein extracts
To extract whole cell protein from cell lines cultivated in 6-well plates the cell culture medium was discarded and cells were washed once with PBS, then scraped off with a cell scraper (Corning, New York, USA) and taken up into 350 µl cell lysis buffer (Cell Signaling Technology, Boston, USA) supplemented with 1 mM PMSF and a protease inhibitor cocktail (cOmplete Mini Protease Inhibitor Cocktail Tablets from Roche Diagnostics, Mannheim, Germany). Subsequently, probes were treated with an ultrasonoscope (Sonoplus hp 70, Bandelin electronics, Berlin, Germany) 5 x 3 s at an intensity of 70% for cell lysis.
Subsequently, the solved proteins were separated from the non-soluble cell components by centrifugation at 20,000 g (15 min, 4°C). The protein solution was transferred into new reaction tubes and stored at -20°C.
3.7.2 Determination of protein concentration
To determine the protein concentrations of protein solutions the BCATM Protein Assay Kit (Pierce, Rockford, USA) was used. The assay combines the reduction of Cu2+ to Cu1+ by protein in an alkaline medium with the highly sensitive and selective colorimetric detection of the cuprous cation Cu1+ by bicinchoninic acid (BCA). The first step is the chelation of copper with protein in an alkaline environment to form a blue-colored complex. In this reaction, known as biuret reaction, peptides containing three or more amino acid residues form a colored chelate complex with cupric ions in an alkaline environment. One cupric ion forms a colored coordination complex with four to six nearby peptides bound. In the second step of the color development reaction, BCA, a highly sensitive and selective colorimetric detection reagent reacts with the cuprous cation Cu1+ that was formed in step 1. The purple-colored reaction product is formed by the chelation of two molecules of BCA with one cuprous ion. The BCA/copper complex is water-soluble and exhibits a strong linear absorbance at 562 nm with increasing protein concentrations. 200 µl of alkaline BCA/copper(II) solution (50 parts of solution A mixed with 1 part of solution B) was added to 2 µl of protein solution using a 96-well plate and were incubated for 15 min at 37°C. Thereafter the purple color was measured at 562 nm with a spectrophotometer (EMax® Microplate Reader, MWG Biotech, Ebersberg, Germany). The optical absorbance values
could be translated into specific protein concentrations by parallel quantification of a BSA standard.
3.7.3 SDS polyacrylamid gel electrophoresis (SDS-PAGE) Used buffers:
Laemmli buffer 62.5 mM Tris/HCl; pH 6.8 2% (w/v) SDS
10% (v/v) Glycerine
5% (v/v) β-Mercaptoethanol
Running buffer 25 mM Tris/HCl; pH 8.5 200 mM Glycine
0.1% (w/v) SDS
12% Resolving gel 6.6 ml H2Odest.
5.0 ml 1.5 M Tris/HCl; pH 8.8 0.2 ml 10% (w/v) SDS
8 ml Acrylamide/Bisacrylamid 30%/0.8% (w/v) 0.2 ml Ammonium persulfate 10% (w/v)
0.008 ml TEMED
18% Resolving gel 2.6 ml H2Odest.
5 ml 1.5 M Tris/HCl; pH 8.8 0.2 ml 10% (w/v) SDS
12 ml Acrylamide/Bisacrylamid 30%/0.8% (w/v) 0.2 ml Ammonium persulfate 10% (w/v)
0.008 ml TEMED
5% Stacking gel 2.7 ml H2Odest.
0.5 ml 1.0 M Tris/HCl; pH 6.8 0.04 ml 10% (w/v) SDS
0.67 ml Acrylamide/Bisacrylamid 30%/0.8% (w/v) 0.04 ml Ammonium persulfate 10% (w/v)
0.004 ml TEMED
The protein solutions were heated at 95°C for 5 min in Laemmli buffer and applied on a SDS polyacrylamid gel for protein fractionation by size at 35 mA/170 V (XCell SureLockTM Mini-Cell, Invitrogen, Karlsruhe, Germany). As size marker HiMark™
Pre-Stained High Molecular Weight Protein Standard (Invitrogen, Karlsruhe Germany) and peqGOLD Protein-Marker V (Peqlab, Erlangen, Germany) were used.
3.7.4 Western Blotting Used buffers:
Standard transfer buffer:
10% (v/v) Methanol 25 mM Tris 190 mM Glycine
To detect the proteins after SDS-PAGE by use of specific antibodies proteins were transferred electrophoretically to a nitrocellulose membrane (Invitrogen, Karlsruhe, Germany) at 220 mA/300 V for 1.5 h (XCell II Blot Module, Invitrogen, Karlsruhe, Germany).
To block unspecific binding sites, the membrane was bathed in PBS containing 3% BSA or 5% milk powder for 1 h at RT. Then, the membrane was incubated with a specific primary antibody (
Table 3.2) over night at 4°C. After washing, the membrane was incubated with a secondary horseradish peroxidase (HRP) conjugated antibody (
Table 3.2) for 1 h at RT. Thereafter, the membrane was washed and incubated with ImmunStarTM WesternCTM Kit (BioRad, München, Germany) for 3 min. This system utilizes chemiluminescence technology which was detected by the ChemiDoc XRS (BioRad, München, Germany) imaging system.
3.7.5 Analysis of cell culture supernatants
All analysis were performed at the Department of Clinical Chemistry and Laboratory Medicine (University of Regensburg, Germany) using the Advia 1800 analyzer (Siemens Healthcare Diagnostics, Eschborn, Germany).
Table 3.2 Used primary and secondary antibodies for Western Blot analysis
Primary antibody Dilution
rabbit phospho c-Jun (Cell signalling, Beverly, USA) 1:1000
rabbit phospho IκΒ−α (Cell signalling, Beverly, USA) 1:1000
rabbit phospho JNK (Cell signalling, Beverly, USA) 1:1000
mouse anti-β-actin (Sigma-Aldrich, Deisenhofen, Germany) 1:20,000 Secondary antibody
anti-mouse HRP (Santa Cruz Biotechnology, Santa Cruz, CA, USA) 1:2000 anti-rabbit HRP (Santa Cruz Biotechnology, Santa Cruz, CA, USA) 1:2000
For determination of cytotoxic effects of diverse stimulus, cells (5 x 10⁵ cells per well) were seeded in 6 well plates (Corning, New York, USA) and grown overnight followed by stimulation with diverse stimulus for another 24 h. Thereafter, supernatants were collected and centrifuged at 20,000 g for 5 min to remove detached cells and debris. The amount of lactate dehydrogenase (LDH) and aspartate aminotransferase (AST) in the supernatants were used as marker for cell viability.
3.8 Functional assays
3.8.1 Mitochondrial activity assay (XTT)
Cells viability was quantified with the XTT kit (Roche Diagnostics, Mannheim, Germany). The assay is based on the ability of metabolic active cells to reduce the tetrazolium salt XTT (2,3-bis(2-methoxy-4-nitro-5-sulfophenyl)-5- [phenylamino)carbonyl]-2H-tetrazolium hydroxide) to orange colored compounds of formazan. The dye formed is water soluble and dye intensity can be read with a spectrophotometer at a wavelength of 450 nm and a reference absorbance wavelength of 650 nm. The intensity of the dye is proportional to the number of metabolic active cells.
To quantify the effects of alcohol and/or FFA treatment on cells viability, cells were seeded in 6-well tissue culture plates (250 000 cells per well) and incubated with
stimulants for different time intervals. At the chosen time points XTT reagent was added and the intensity of the forming dye was measured 30 min later with an EMax Microplate Reader (MWG Biotech, Ebersberg, Germany). Values of optical density (OD) at individual time points were corrected for background by subtracting the OD value of blank wells without cells. Each experimental condition was performed in triplicate and experiments were repeated three times.
3.8.2 CYP2E1 activity (p-nitrophenol hydroxylation)
4-Nitrophenol (p-NP) hydroxylation activity in terms of 4-nitrocatechol formation was determined in intact cells (Dicker et al., 1990; Perez and Cederbaum, 2001) with some modification. Briefly, at first, the cells were pre-incubated with FFA or BSA (served as control) for 24 h. Subsequently, cells were stimulated with alcohol for16 h. The conditioned media were replaced with Krebs-Ringer HEPES buffer pH 7.4 contained (100 µM) p-nitrophenol. The cells were incubated at 37 °C for 12 h. The reaction was terminated by adding perchloric acid to the reaction mixture (final concentration 4%). The mixture was then cooled on ice, and the protein was removed by centrifugation at 10,000 g for 5 min. transfer 0.5 ml of the supernatant to a clean tube containing 40 µL of 10 M NaOH, the absorbance at 492 nm was immediately measured. The product of p-NP hydroxylation (p-Nitrocatechol) was calculated using a standard curve of p-Nitrocatechol.
3.9 Lipid assays
3.9.1 Triglycerides (TG) assay
To quantify the total hepatic lipids content, lipids were extracted from hepatoma cell line using the method of Bligh and Dyer with slight modifications (BLIGH and DYER, 1959). In brief, cell pellets were weighed into 0.5 ml of a chloroform/methanol mix (2:1 v/v) and incubated for 1 h at room temperature on an orbital shaker to extract the lipids. After addition of 200 µl H2Odest., vortexing and centrifugation for 5 min at 3000 g, the lower lipid phase was collected and dried over night at room temperature. The lipid pellet was then re-dissolved in 60 µl tert-butanol and 40 µl of a Triton X-114/methanol mix (2:1 v/v), and total triglycerides content was quantified using the Triglyceride GPO-PAP Quantification Kit from Roche diagnostic (Mannheim, Germany) according to the manufacturer’s
instructions. The principle of this assay is based on series of coupled enzymatic reactions in which triglycerides are hydrolyzed to produce glycerol. Glycerol is then oxidized using glycerol oxidase into Dihydroxy acetone phosphate and Hydrogen peroxide (H
2O
2).
H2O
2 is measured quantitatively in a peroxidase catalyzed reaction that produces a color. Absorbance is measured at 540 nm using an EMax Microplate Reader (MWG Biotech, Ebersberg, Germany). Each experimental condition was performed in triplicates.
3.9.2 Lipid peroxidation (TBARS assay)
Lipid peroxidation in hepatoma cell lines was assayed by measuring one of the end products of this process, the thiobarbituric acid (TBA)-reactive substances (TBARS) using the method of Ohkawa,H with some modifications. Briefly, 1-2 x 10⁷ cells were homogenized in 1 ml PBS containing antioxidant Butylated hydroxytoluene (BHT) to prevent further oxidation of lipid during sample processing and the TBA reaction. The whole cells homogenates were used in this assay. 5.2 mg/mL TBA reagent (pH 3.5) and sodium dodecyl sulphate (SDS) were added to each sample with volumes proportion (2.5:1:1) respectively. The samples were heated with a thermomixer (Eppendorf, Hamburg, Germany) at 95°C for 60 min. The mixture was then cooled to room temperature in an ice bath for 5 minutes. The samples were centrifuged at 3000 rpm for 15 min. Supernatants were used for the spectrophotometric measurement. The absorbance was measured at 540 nm. As 99% TBARS is malondialdehyde (MDA), so lipid peroxidation levels of the samples were calculated from the standard curve using MDA and expressed as nanomoles of MDA per mg of protein.
3.9.3 Oil Red O staining
Cells were washed with PBS and fixed with 10 % Formaldehyd for 5 min at room temperature, then formaldehyd was removed and cells were washed with 60%
isopropanol and leaved to become dry. Subsequently, cells were incubated with Oil Red O (Sigma) dissolved in Isopropanol for 30-60 min at room temperature.
Finally cells were washed 3 times with distilled water and then intracellular lipid accumulation was examined and quantified by fluorescence microscope.